
“A professional is someone who can do his best work when he doesn’t feel like it.”
– Alistair Cooke
COVID 19 and Markets Update
COVID19
As of writing this report the United States has 6,485,708 confirmed COVID 19 cases and 193,536 confirmed deaths. We seemed to have bottomed out temporarily at 31,658 new cases on August 31, 2020 and rose to 43,725 on September 5, 2020 with the largest increases seemingly coming out of California where restrictions are stricter than anywhere else in the country.
Jobless Claims
The U.S. Labor Department stated on Thursday of last week that U.S. workers filed an additional 881,000 initial jobless claims, bringing the total initial claims since COVID-19 to nearly 59 million. Economists polled by Dow Jones expected a total of 950,000 and news came in better than expected. The four-week moving average was 991,750, a decrease of 77,500 week over week. The previous week’s average was revised up by 1,250 from 1,068,000 to 1,069,250.
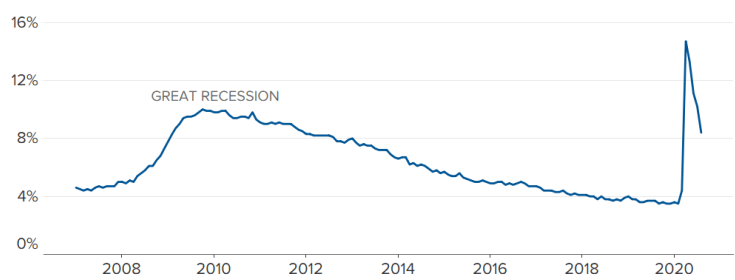
On a good note, 1.37 million net new jobs were created in August 2020. That’s down from 1.73 million in July and 4.78 million in June. Job gains in August reflect continued resumptions of economic activity in much of the country. Net job losses in April and May were 22.2 million. Job gains in May through August were 10.6 million, leaving a net loss of 11.5 million from employment levels right before the pandemic hit. The official unemployment rate fell to 8.4% in August.
Monthly Unemployment Rate Seasonally Adjusted (Jobless rate drops to 8.4%)
Other Economic Indicators we are keeping an eye on:
- Consumer confidence is down – The Conference Board’s consumer confidence index was 84.8 in August, down from 91.7 in July and 98.3 in June. It averaged around 130 in the 18 months prior to the pandemic.
- US industrial output is rising – Total U.S. industrial output rose 3.0% in July 2020 from June 2020, its third consecutive increase after plummeting in March and April. According to the Federal Reserve, which compiles industrial output data, “Most major industries posted increases in July”. Total industrial output in July was 8.4% below its pre-pandemic February level and 8.2% below its July 2019 level.
- Purchasing Managers Index is up – The Purchasing Managers Index from the Institute for Supply Management grew in August for the fourth consecutive month, reaching 56.0 — up from 54.2 in July and the highest it’s been since January 2019. A reading above 50 is meant to indicate that manufacturing is expanding. The new orders component of the PMI rose from 61.5 in July to 67.6 in August, the highest it’s been since at least 2005.
- Consumer spending is up marginally – On August 28, the BEA reported that total consumer spending rose 1.9% in July 2020 from June 2020. That’s much worse than the 8.6% and 6.2% gains in May and June, respectively. Gains over the past three months haven’t been enough to overcome record-setting declines in March and April. While in July, total consumer spending was an annualized $14.2 trillion, about 5% lower than in January and February.
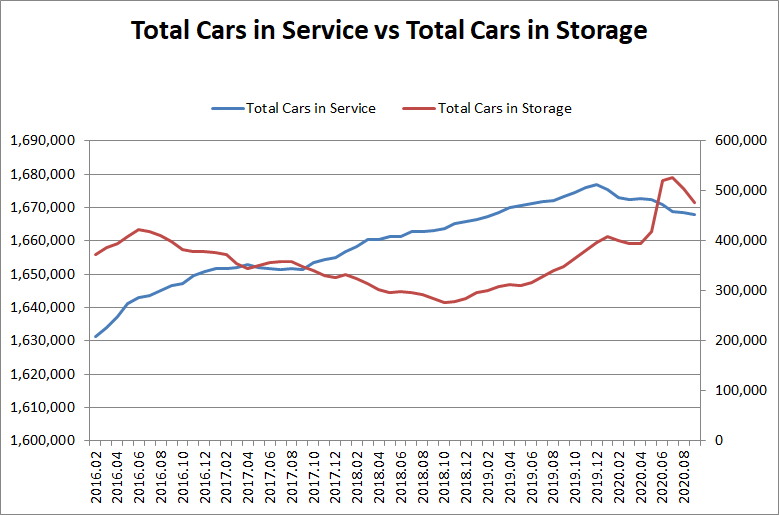
- Railcars in storage continue to decline, as does the fleet size – As of September 1st, the total number of railcars in storage was 476,572, accelerating the downtrend for a month over month decline of 27,451 (-5.45%); still 128,972 (37.1%) higher than this time last year. At these levels this currently represents 28.57% of the total North American fleet in storage, below the July high of 31.55%, but still well above historical averages. Looking at pre-pandemic levels, we are still 82,722 cars above (21%) where we were March 1, 2020. See PFL’s monthly storage report for more details.
DOW and Nasdaq
The DOW closed lower on Friday, down 159.42 points (-0.56%) to finish out the week at 28,133.31 down 520.56 points week over week. The S&P 500 traded lower 28.01 points (-0.81%) on Friday, closing at 3,426.96 down 81.05 points week over week. The Nasdaq finished Friday’s session lower as well, losing 144.97 points (-1.27%) closing out the week at 11,313.14, down 382.49 points week over week. In overnight trading, DOW futures traded higher and are expected to open up this morning 28 points.
Crude Oil Markets
West Texas Intermediate (WTI) traded down $1.60 to close at $39.77 on Friday of last week on the New York Mercantile Exchange, a loss of $3.20 per barrel week over week.
Brent traded up $1.41 to close at $42.66 on Friday of last week, a loss of $3.15 per barrel week over week.
U.S. crude inventories fell by 9.36 million barrels last week and now stand at 498.45 million barrels according to the EIA. Almost all of the declines were in the Gulf region where most production was shut in due to hurricane Laura. Crude inventories are just slightly above the high end of the 5 year average (see chart below)
US Crude Chart (Now Top end of 5 year Average)
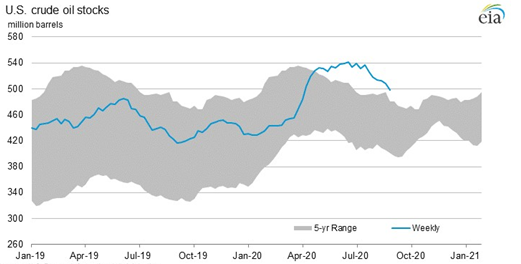
Gasoline inventories were down by 4.32 MM/bbls. The draw was more evenly distributed across the country then crude, but still more than 50% of it came from the Gulf. Gasoline demand was also lower week over week, a potential headwind; however, we are at the very top of our 5 year average as it relates to gasoline inventories. Distillate stocks had a draw of 1.38MM/bbls, vs. a forecasted draw of 1.184 MM/bbls.
Oil is higher in overnight trading and, as of the writing of this report, WTI is poised to open at 38.26 down $1.51 per barrel from Friday’s close.
Things we are keeping an eye on:
- Goldman Sachs says WTI Oil prices will rise in 2021. Goldman Sachs expects WTI to reach $55.88 a barrel in the third quarter of 2021, although it could end the year lower, according to Goldman Sachs analysts. “There is a growing likelihood that vaccines will become widely available starting next spring, helping support global growth and oil demand, especially jet,” the Goldman analysts said. This price forecast is up from $51.38 in an earlier Goldman forecast.
- Iraq seeks OPEC+ exemption for production it oversupplied under agreed upon cuts. Iraq is looking for an exemption from the OPEC+ deal for the first quarter of 2021, raising fears that the group’s compliance may start to slip. A separate report says that Iraq wants a two-month extension on the extra production cuts that it agreed to implement in August and September.
- Hurricane Laura’s Aftermath – Entergy said it will take up to 3 weeks to restore power to Lake Charles customers – approximately 1 MM/bbls/day of refining capacity remains off line. Hurricane Laura will go down in the record books as the strongest storm to hit Louisiana since 1856 and is tied for the fifth strongest storm to make landfall in the continental U.S. Laura made landfall in Cameron, Louisiana, as a catastrophic Category 4 hurricane with maximum sustained winds of 150 mph. Customer outages reached more than 616,000 across Entergy’s service area. Laura’s historic intensity caused severe damage to the Entergy’s distribution and transmission systems across Louisiana and Texas.
- Dakota Access – The US Army Corps of Engineers is set to start an environmental review of Entergy Transfers 570,000/bpd Dakota Access Pipeline (DSPL) as a permitting question lingers in a Federal Court. The review should be finalized by September 4th.
- Petroleum By Rail –The four-week rolling average of petroleum carried on the largest North American railroads held steady at 21,064 compared with 21,065 the prior week. Canadian volumes fell. CP shipments fell 2.6% and CN volumes were down by 10%.
- Alberta – We are trying to forecast when crude by rail may come back in Alberta. In doing so, we have been monitoring basis in Alberta which continues to be unfavorable, however, please keep in mind that those producers that have already sunk transportation costs due to long term contracts with CP or CN this analysis does not come into play. The more relevant factor would be production rates and price. We continue to see steady production increases in Alberta in particular bitumen out of cold lake. Overall heavy crude production in Alberta averaged 1.9 MM/bbls/day in July up 235,000 bpd month over month according to Alberta Energy. Despite the increase in production month over month inventories in Alberta declined by 3 million barrels and now stand at 67 million barrels as of July 31, 2020. We will continue to monitor Alberta.
Rig Count
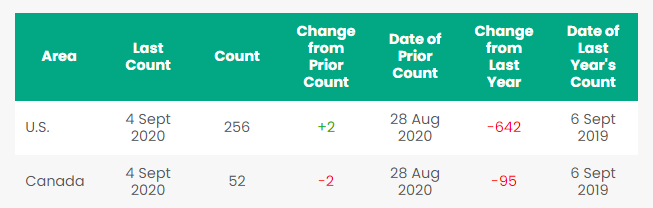
North America rig count is flat week over week. The U.S. gained 2 rigs week over week with 256 active rigs. Canada lost 2 rigs week over week and Canada’s overall rig count is now 52 active rigs. Year over year we are down 737 rigs collectively.
North American Rig Count Summary
We have been extremely busy at PFL with return on lease programs involving rail car storage instead of returning cars to a shop. A quick turnaround is what we all want and need. Railcar storage in general has been extremely active. Please call PFL now at 239-390-2885 if you are looking for rail car storage, want to trouble shoot a return on lease scenario or have storage availability. Whether you are a car owner, lessor or lessee or even a class 1 that wants to help out a customer we are here to “help you help your customer!”
North American Rail Traffic
Total North American rail volumes were down 7.0% year over year in week 35 (U.S. -6.2%, Canada -8.6%, Mexico -11.4%), resulting in quarter to date volumes that are down 8.2% and year to date volumes that are down 11.0% (U.S. -11.8%, Canada -8.6%, Mexico -10.7%). 8 of the AAR’s 11 major traffic categories posted year over year declines with the largest decreases coming from coal (-27.2%), metallic ores & metals (-20.3%), nonmetallic minerals (-17.6%) and petroleum (-28.4%). The largest increase came from intermodal (+1.6%).
In the East, CSX’s total volumes were down 4.4%, with the largest decreases coming from coal (-35.5%) and motor vehicles & parts (-15.5%). The largest increase came from intermodal (+9.0%). NS’s total volumes were down 5.9%, with the largest decreases coming from coal (-26.9%), petroleum (-46.5%) and metals & products (-24.4%). The largest increase came from intermodal (+2.9%).
In the West, BN’s total volumes were down 9.1%, with the largest decreases coming from coal (-25.2%), stone sand & gravel (-42.6%) and petroleum (-22.8%). UP’s total volumes were down 7.6%, with the largest decreases coming from coal (-26.0%), petroleum (-41.0%), stone sand & gravel (-25.3%) and motor vehicles & parts (-17.8%). The largest increase came from intermodal (+3.4%).
In Canada, CN’s total volumes were down 9.5% with the largest decreases coming from coke (-82.6%), petroleum (-36.9%) and chemicals (-16.1%). The largest increase came from grain (+49.0%). RTMs were down 6.9%. CP’s total volumes were down 9.0%, with the largest decreases coming from petroleum (-51.3%), coal (-18.9%) and intermodal (-5.4%). The largest increase came from farm products (+71.9%). RTMs were down 9.8%.
KCS’s total volumes were down 5.0%, with the largest decrease coming from grain (-14.9%).
Source: Stephens
A sign of things getting better – leasing activity and inquiries has picked up substantially
Railcar Markets
PFL is seeking
- 200, 25.5 CPC 1232 cars for use in Mexico for 1-3 years for heavy fuel oil
- 2 Covered hoppers for purchase 5500 series, for storage at plant site in the Chicago area, BN or NS connection
- 10 LPG pressure cars for Texas location and lease terms one year.
- 25 22-30K coiled and insulated for biodiesel in the Midwest off the UP, 6-12 months
- 5-15 6000+ high sided gondolas, no interior bracing for purchase off the CN or CP Ontario destination
- 5-10 31.8s food grade needed in the Midwest for service in Mexico, 5 year lease
- 5-10 syrup cars are needed in the Midwest.
- 200 steel coal gondolas for purchase.
- Seeking 100 4750’s for grain service in the Midwest, one year lease.
- 50-90 263 or 286 GRL needed for corn syrup for purchase anywhere.
- 50-60 Sulfuric acid cars 13.6 for purchase any location.
- 40-50 molten Sulfur Cars 13.8 for purchase any location.
- 50 Veg Oil cars 29.2 12 month lease SD or MI location.
- 200 cars for light oil 6 months to 2 year lease GP30 or similar off the NS in Utica dirty to customer wants cars dirty and will return dirty.
- Need ten 20K to 23.5 coiled and insulated for one year in ethylene glycol
- 10 CPC 1232 or other for industrial alcohol use in Indiana off the NS for 6 months: lessee would take ethanol cars clean then use for industrial alcohol service and deliver the cars back with industrial alcohol heals.
PFL is offering:
- Various tank cars for lease with dirty to dirty service including, nitric acid, gasoline, diesel, crude oil. Lease terms negotiable, short and long term opportunities available Clean cars are available 1-5 years scattered across the country.
- Leases on 117Js and 117Rs, dirty to dirty for sublease.
- 455 117Js cleaned and relined for sale or lease in Texas.
- 207 CPC -1232’s for sale or lease in Texas.
- 61 ft. bulkhead flat cars, lease only.
- Available 200 30K tankers cleaned and ready for service, for sale or lease.
- 100 5650 PD hoppers brand new 65 ft, lease only, available in 60 days.
- 218 73 ft 286 GRL riserless deck, center part for sale.
- 28 auto-max II automobile carrier racks – tri-level for sale.
- 100 65’ 100 ton log cars for sale, various locations.
- 10 food grade 14.3 tanks lined for phosphoric acid for sale in Louisiana
- 49 60’ Box cars 286 EOL refurbished in Tenn.
- PFL has a number of steel and aluminum hoppers for various commodities and tank cars, all for sale.
- Sand cars, box cars, coal cars and hoppers including sugar covered hoppers and plastic pellet cars, are also available for sale and lease in various locations and terms.
Call PFL today to discuss your needs and our availability and market reach. Whether you are looking to lease cars, lease out cars, buy cars or sell cars call PFL today 239-390-2885
PFL offers turn-key solutions to maximize your profitability. Our goal is to provide a win/win scenario for all and we can handle virtually all of your railcar needs. Whether it’s loaded storage, empty storage, subleasing or leasing excess cars, filling orders for cars wanted, mobile railcar cleaning, blasting, mobile railcar repair, or scraping at strategic partner sites, PFL will do its best to assist you. We also assist fleets and lessors with leases and sales and offer Total Fleet Evaluation Services. We will analyze your current leases, storage, and company objectives to draw up a plan of action. By doing so we will save Lessor and Lessee the headache and aggravation of navigating through this rapidly changing landscape
PFL IS READY TO CLEAN CARS TODAY ON A MOBILE BASIS. WE ARE CURRENTLY IN EAST TEXAS
Live Railcar Markets
| CAT | Type | Capacity | GRL | QTY | LOC | Class | Prev. Use | Offer | Note |
|---|