
“It’s not that I’m so smart, it’s just that I stay with problems longer.” – Albert Einstein
Jobs Update
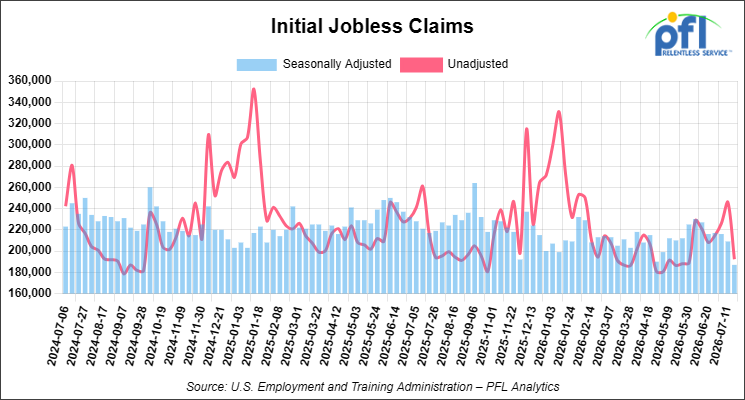
Initial jobless claims seasonally adjusted for the week ending July 18, 2026 came in at 187,000, versus the adjusted number of 209,000 people from the week prior, down 22,000 people week over week.
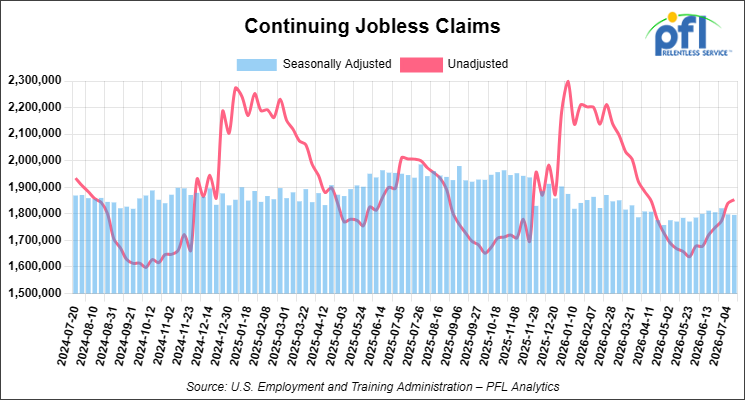
Continuing jobless claims came in at 1,796,000, versus the adjusted number of 1,798,000 people from the week prior, down 2,000 week-over-week.
Stocks closed mixed on Friday of last week, but lower week-over-week
The DOW closed higher on Friday of last week, up 235.60 points (0.46%), closing out the week at 51,947.25, down -198.96 points week-over-week. The S&P 500 closed higher on Friday of last week, up 3.68 points (0.05%), and closed out the week at 7,411.98, down -45.71 points week-over-week. The NASDAQ closed lower on Friday of last week, down -161.87 points (-0.64%), and closed out the week at 24,975.82, down -544.42 points week-over-week.
In overnight trading, DOW futures traded higher and are expected to open at 52,674 this morning, up 550 points from Friday’s close.
Crude oil closed lower on Friday of last week, but higher week-over-week
West Texas Intermediate (WTI) crude closed down -$2.88 per barrel (-3.12%), to close at $89.31 on Friday of last week, but up $6.82 per barrel week-over-week. Brent crude closed down -$3.91 per barrel (-3.88%), to close at $96.78, but up $8.68 per barrel week-over-week.
One Exchange WCS (Western Canadian Select) for September delivery settled on Friday of last week at US$13.90 below the WTI-CMA (West Texas Intermediate – Calendar Month Average). The implied value was US$75.41 per barrel.
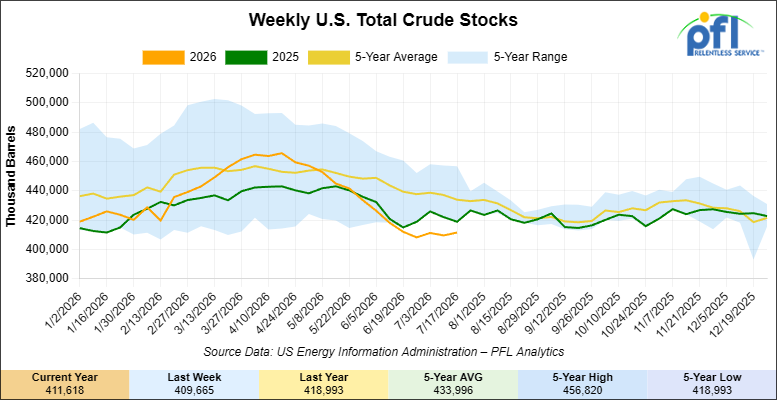
U.S. commercial crude oil inventories (excluding those in the Strategic Petroleum Reserve) increased by 2 million barrels week-over-week. At 411.7 million barrels, U.S. crude oil inventories are 6% below the five-year average for this time of year.
Cushing fell to 19.4 million barrels, below the roughly 20 million barrels operators treat as minimum working inventory. Below tank bottoms the hub stops behaving like a storage buffer and starts behaving like a bottleneck, and every differential priced off Cushing gets noisier.
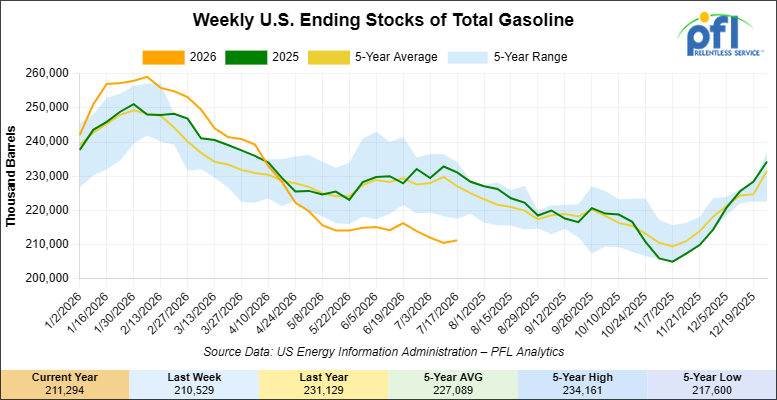
Total motor gasoline inventories increased by 800,000 barrels week-over-week and are 7% below the five-year average for this time of year.
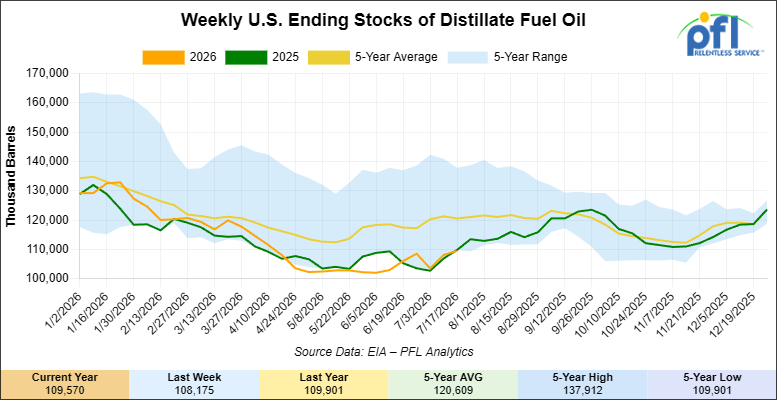
Distillate fuel inventories increased by 1.4 million barrels week-over-week and are 10% below the five-year average for this time of year.
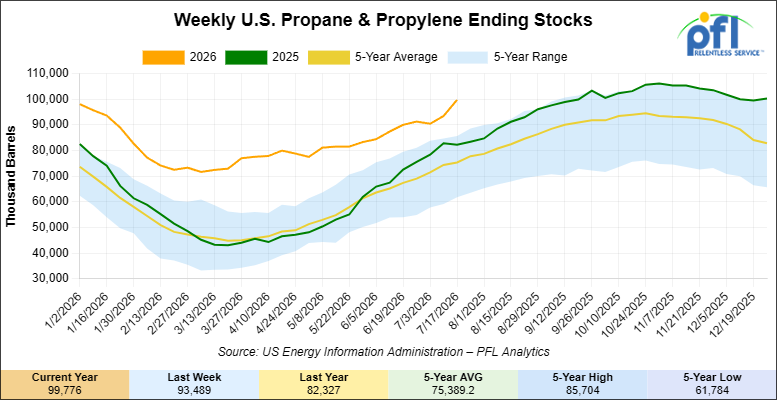
Propane/propylene inventories increased by 6.3 million barrels week-over-week and are 34% above the five-year average for this time of year..
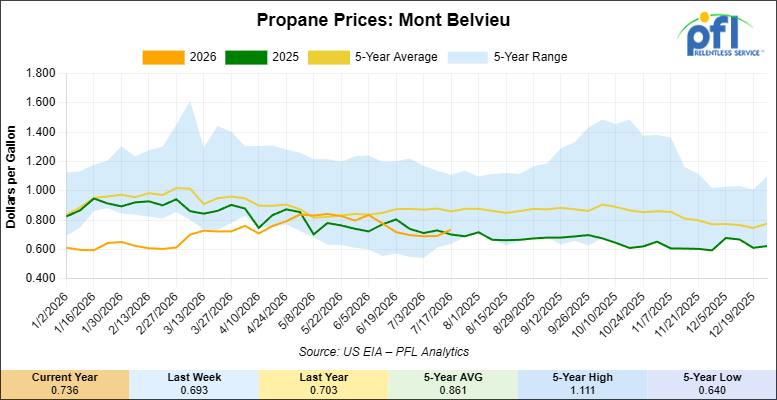
Propane prices closed at 73.6 cents per gallon on Friday of last week, up 4.3 cents per gallon week-over-week, and up 3.3 cents year-over-year.
Overall, total commercial petroleum inventories increased by 11.6 million barrels week-over-week during the week ending July 17, 2026.
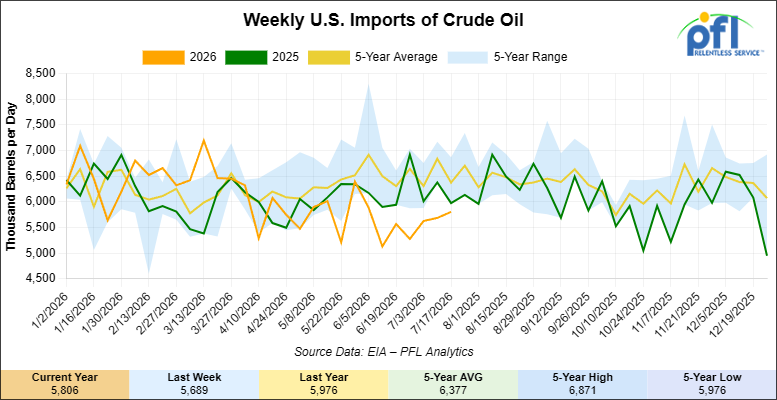
U.S. crude oil imports averaged 5.8 million barrels per day, an increase of 117,000 barrels per day week-over-week. Over the past four weeks, crude oil imports averaged 5.6 million barrels per day, 11.4% less than the same four-week period last year. Total motor gasoline imports (including both finished gasoline and gasoline blending components) averaged 494,000 barrels per day, and distillate fuel imports averaged 173,000 barrels per day during the week ending July 17, 2026.
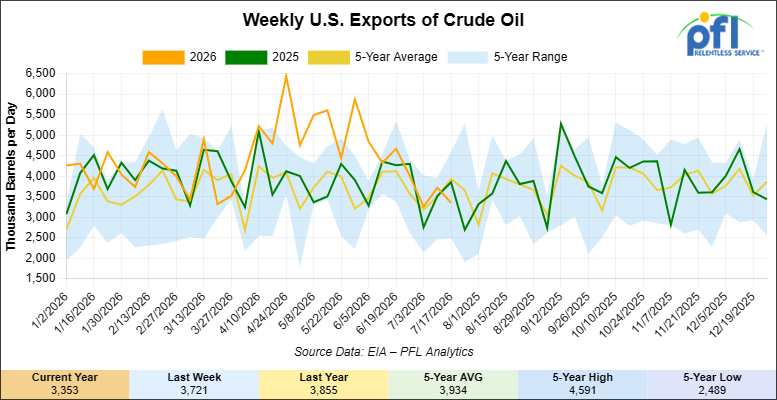
U.S. crude oil exports averaged 3.353 million barrels per day during the week ending July 17, 2026, a decrease of 368,000 barrels per day week-over-week. Over the past four weeks, crude oil exports averaged 3.586 million barrels per day.
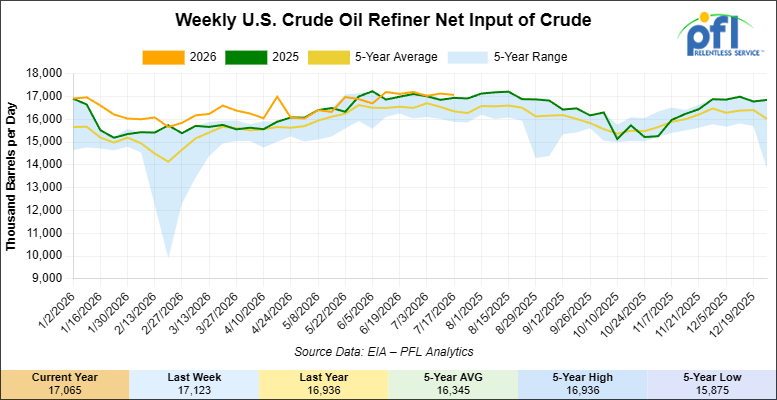
U.S. crude oil refinery inputs averaged 17.1 million barrels per day, during the week ending July 17, 2026 which was 58,000 barrels per day less week-over-week.
WTI is poised to open at $82.21, down $7.10 per barrel from Friday’s close.
North American Rail Traffic
Week Ending July 22, 2026:
Total North American weekly rail volumes were up (+4.49%) in week 30, compared with the same week last year. Total Carloads for the week ending July 22, 2026 were 325,576, up (+1.48%) compared with the same week in 2025, while weekly Intermodal volume was 359,422, up (+7.37%) year over year. 8 of the AAR’s 11 major traffic categories posted year-over-year increases. The largest decrease came from Motor Vehicles and Parts (-4.91%). The largest increase was Other (+12.45%).
In the East, CSX’s total volumes were up (+6.85%), with the largest decrease coming from Petroleum & Petroleum Products (-7.02%), while the largest increase came from Other (+20.64%). NS’s total volumes were up (+3.21%), with the largest increase coming from Petroleum & Petroleum Products (+16.60%), while the largest decrease came from Motor Vehicles and Parts (-11.09%).
In the West, BNSF’s total volumes were up (+5.55%), with the largest increase coming from Grain (+11.52%), while the largest decrease came from Metallic Ores and Metals (-8.55%). UP’s total volumes were up (+3.87%), with the largest increase coming from Metallic Ores and Metals (+31.77%), while the largest decrease came from Grain (-8.61%).
In Canada, CN’s total volumes were down (-0.62%), with the largest increase coming from Farm Products (+30.49%), while the largest decrease came from Motor Vehicles and Parts (-14.46%). CPKCS’s total volumes were up (+6.12%), with the largest increase coming from Metallic Ores and Metals (+41.96%), while the largest decrease came from Other (-15.08%).
Source Data: AAR – PFL Analytics
North American Rig Count Summary
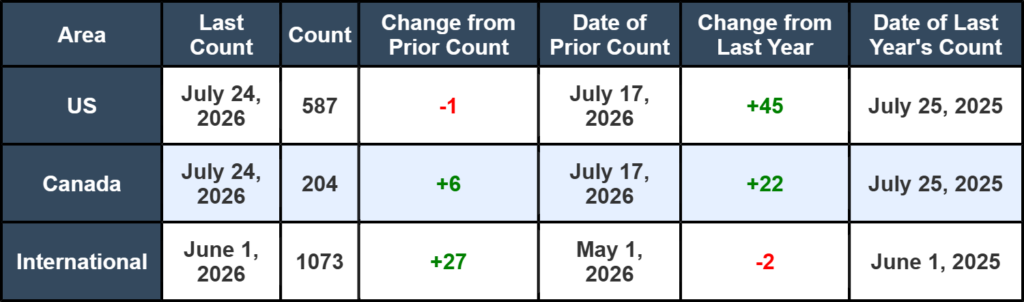
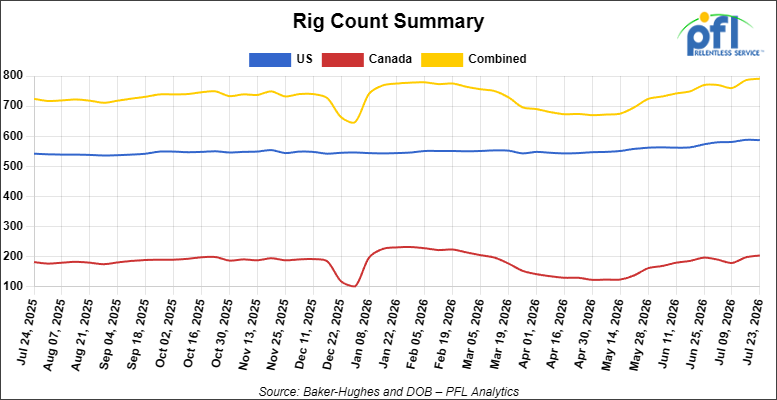
North American rig count was up by +5 rigs week-over-week. The US rig count was down by -1 rig week-over-week, but up by +45 rigs year-over-year. The US currently has 587 active rigs. Canada’s rig count was up by +6 rigs week-over-week and up by +22 rigs year-over-year. Canada currently has 204 active rigs. Overall, year-over-year we are up by +67 rigs collectively.
We are watching a few things out there for you:
We Continue to Watch Our Strategic Petroleum Reserves
The ongoing emergency drawdown of the U.S. Strategic Petroleum Reserve (SPR) remains a major component of global efforts to offset crude oil supply disruptions stemming from the conflict involving Iran and the continued restrictions on oil shipments through the Strait of Hormuz. Since March, the Department of Energy (DOE) has awarded exchanges covering more than 133 million barrels of crude oil, with additional releases expected as part of a broader international response coordinated through the International Energy Agency (IEA).
The United States continues to execute its commitment to make available up to 172 million barrels from the SPR under the IEA’s collective plan to inject roughly 400 million barrels into global energy markets. Officials have argued that the releases are necessary to help stabilize crude supplies and limit further increases in fuel prices as refiners compete for replacement barrels amid ongoing transportation disruptions.
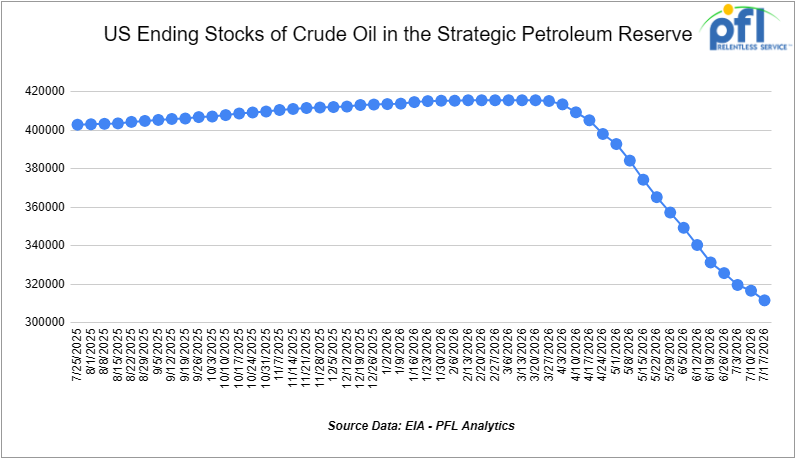
As releases have accelerated, inventories in the SPR have declined to 311.447 million barrels, down from 415.442 million barrels at the start of the conflict with Iran and reaching their lowest level since March 1983. Recent weekly withdrawals have ranked among the largest on record, highlighting the scale of the government’s intervention in oil markets. Since the first SPR drawdown began, the United States has withdrawn approximately 1.04 million barrels per day from the SPR through the week ending July 17, 2026.
Global petroleum inventories have also tightened considerably. The IEA has reported substantial draws in commercial crude and refined-product stockpiles across major consuming nations, underscoring the strain that the conflict has placed on world energy markets. Agency officials have indicated that further coordinated actions remain possible should supply disruptions persist or intensify.
The Administration continues to emphasize that the current program consists primarily of exchange agreements, rather than outright sales. Under these arrangements, companies receiving crude oil today are required to return the borrowed barrels in the future along with additional volumes as a premium. Energy Secretary Chris Wright has stated that the objective is to eventually restore the SPR to levels above those that existed prior to the current emergency releases.
We Are Watching the Bakken
North Dakota crude sold at a $2.56 per barrel premium to WTI in May. Justin Kringstad of the North Dakota Pipeline Authority told the state’s monthly briefing on 22 July that he had to go back to 1986 to find a comparable premium, and called it an anomaly he does not expect to hold. The state’s average realized price was $100.64, some 70.6% above the price assumption in its own revenue forecast, worth an estimated $29mn in additional oil tax receipts for the month.
Production was 1.125 million barrels per day in May, a twelve-month low, with only 24 active rigs. A basin producing less oil and still commanding a premium to the benchmark is telling you the barrels are being pulled to market rather than pushed into it. Cushing tank bottoms is the same signal from the other end of the pipe.
Enbridge reduced apportionment on the Mainline for a second consecutive month for August flow as oil sands turnaround season cut the barrels chasing southbound space. That is a Canadian signal, not a Bakken one, and the two basins are not competing for the same cars.
We Are Watching Trans Mountain
Trans Mountain’s binding open season for firm service on the 890,000 barrel per day system ran from 7 April to 2 June. The company expects the result to leave 80% to 90% of the system under contract, against a committed base of roughly 707,500 barrels per day going in. The results and a long-term tolling arrangement have gone to the Canada Energy Regulator for approval as a package.
At the top of that range the system would hold about 801,000 barrels per day under contract, leaving just under 90,000 barrels per day of uncommitted space on the only tidewater route out of Alberta. Anyone without a contract is being pushed toward spot pipeline capacity that is shrinking by design.
There is a second open season for Trans Mountain going on right now, this one for expansion capacity, opened 13 July and closes 10 August. The drag reducing agent project adds 90,000 barrels per day and is expected to be complete early 2027. The larger Mainline Optimization Project has been cut to 210,000 barrels per day from as much as 270,000 and pulled forward to year end 2028.
We Are Watching Left Wing Carney
Canada’s premiers met in Charlottetown P.EI. last week.from July 21-23, with Prime Minister Mark Carney joining after Donald Trump signed orders raising levies on a range of Canadian goods by 50%. Carney said he would do whatever it takes to protect Canada but responding before the tariffs take effect on 19 August could be counterproductive. The closing communique asked Ottawa for a clear and timely consultation process, which is the polite way of saying the premiers have not been shown a plan.
Cement, agricultural products and alcohol are covered by the new levies. Energy and potash are exempt, which is the whole argument in one line: the U.S. carved out the two commodities it cannot readily replace and taxed the ones it can. Doug Ford, Ontario’s premier, said that Canada could dismantle the U.S. if it wanted. This was a comment only for good television. Alberta and Saskatchewan premiers are quiet – Alberta sits on the world’s fourth largest oil deposit and sells essentially all of it to one customer, over infrastructure that customer’s refiners have spent forty years configuring to receive. Saskatchewan on the other hand sits on all the potash and wants it sold.
Eighteen months of tariff escalation have produced no new sanctioned export egress. Embridge’s Mainline ran at 95.2% utilization in 2025 and has been apportioned in most months since the Trans Mountain expansion started up, and the only near-term capacity coming to either system is drag reducing agent injection. Wab Kinew Manitoba’s premier said Manitoba is willing to entertain an Alberta to Ontario crude oil pipeline. Entertaining is not permitting, and permitting is not building.
In our opinion, a country that spends eighteen months talking about leverage while its only export route runs full and apportioned does not have leverage. It has a customer! Rail is the one egress option in Canada that can be added in quarters rather than decades, and it is the option to our knowledge nobody in Charlottetown mentioned. We continue to watch this one.
We Are Watching Fuel Surcharges
Union Pacific posted record second quarter freight revenue of $6.518bn, up 12%. Fuel expense rose 63% on a 60% increase in average fuel price and cost the railroad roughly 120 basis points of operating ratio. Jennifer Hamann told analysts recent purchases have been above $4 per gallon. Fuel surcharge revenue contributed about $460mn and 750 basis points of the freight revenue growth.
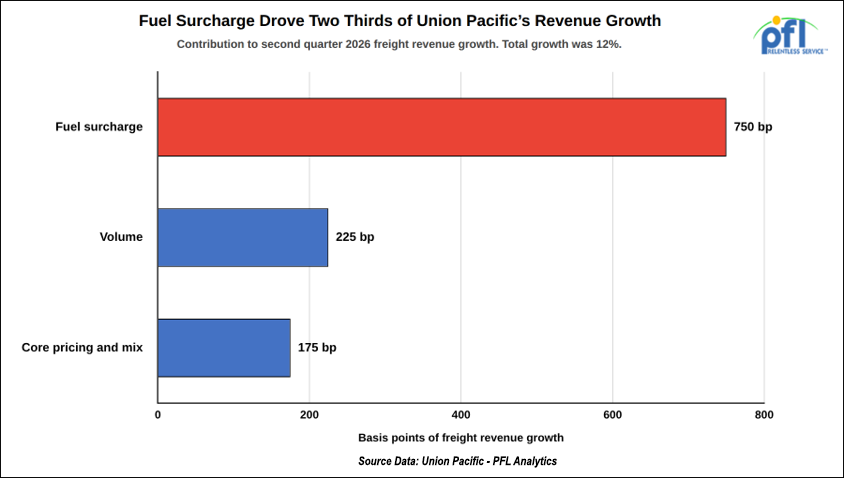
Strip the surcharge out and freight revenue grew 4%, so the headline is a fuel pass-through rather than a demand story. The same arithmetic is running through every carrier’s income statement in both modes. CN reported Friday of last week with revenue ton miles up 5% on grain and energy products and raised its guidance for the year. Jim Vena said he would rather see lower fuel prices despite the surcharge revenue, which is the correct answer.
Where it gets interesting is the spread. Union Pacific improved fuel consumption 1% in the quarter to 1.051 gallons per thousand gross ton miles. A railroad recovering fuel through a published surcharge on that consumption profile is in a structurally different position from a fleet buying retail diesel at $5.13 with a driver shortage layered on top. In our opinion, that spread is the best argument rail has in this market, and it is going to show up in the 2027 bid season.
We Are Watching Trucking
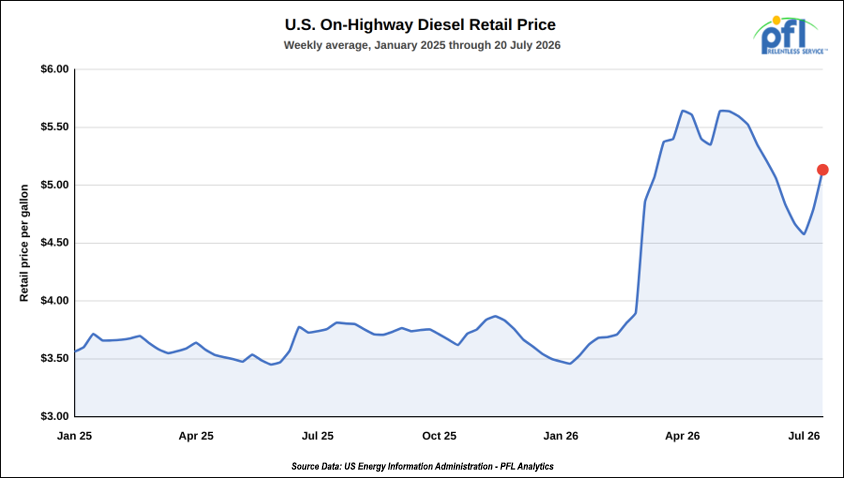
U.S. on-highway diesel averaged $5.134 per gallon in the week ending July 20th, up 33.8 cents on the week and 55.6 cents over two weeks. A year earlier, the same number was $3.812, so fleets are carrying a 34.7% increase in their single largest variable cost. The spike that followed the opening of the Iran war in March never fully unwound, and the July blockade has taken the price back toward the highs.
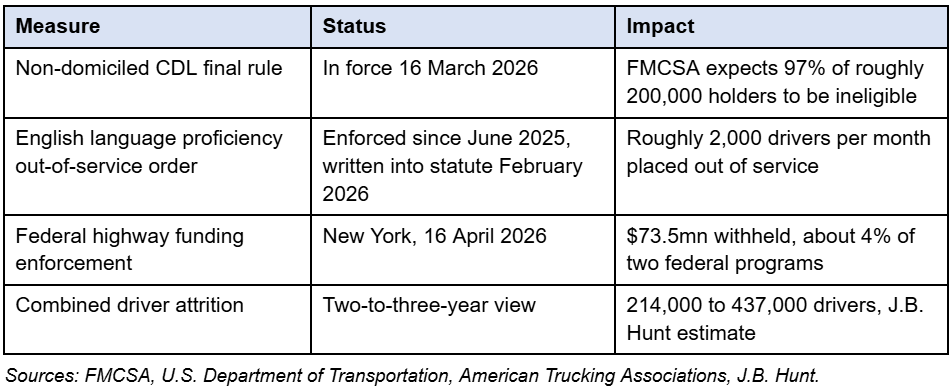
The supply side is worse than the cost side. The Federal Motor Carrier Safety Administration rule on non-domiciled commercial licences took effect 16 March and limits eligibility to holders of H-2A, H-2B and E-2 status. The agency’s own estimate is that 97% of roughly 200,000 non-domiciled licence holders cannot meet the new standard. Washington is enforcing it with money. The Department of Transportation withheld $73.5mn in highway funds from New York on 16 April over licences the state declined to revoke, roughly 4% of its funding under two federal programs. New York and California are the only two states to have actually lost funding. The rest fell into line.
English language proficiency enforcement runs alongside it. Drivers who fail the roadside assessment are placed out of service, and the American Trucking Associations puts the run rate at roughly 2,000 drivers a month. J.B. Hunt has told the market that the two rules together could remove between 214,000 and 437,000 drivers from the workforce over two to three years. Neither measure is reversible by memo. The out-of-service criterion was written into the Consolidated Appropriations Act in February and printed in the April edition of the national inspection criteria.
C.H. Robinson raised its 2026 dry van cost per mile forecast to 34% above last year, with refrigerated at 35%. Spot rates are trading above contract rates for the first time since 2021, which is the clearest signal this market gives that route guides have stopped holding. Tender rejections are at multi-year highs, and the carriers that left after 2022 have not come back.
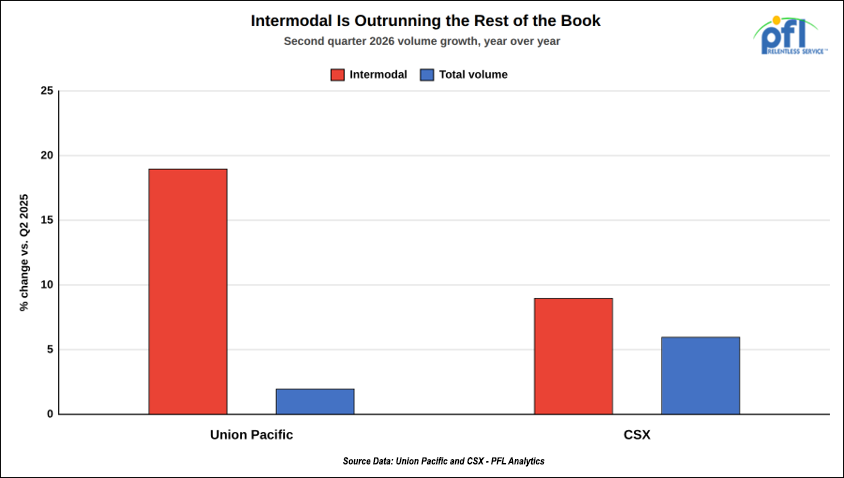
The freight is already moving. Union Pacific’s domestic intermodal carloads rose 19% in the second quarter against 2% total carload growth, and CSX booked 9% intermodal growth on 6% total volume. ACT Research expects 15.6 million intermodal loads in 2026, ahead of the 2018 record of 15.3 million.
In our opinion, this is not a seasonal wobble. When the marginal truck is both more expensive and harder to find, lanes that were marginal for rail on transit time alone start clearing on landed cost, and converted lanes tend to stay converted. PFL is having this conversation with shippers now. The fleet planning needs to happen before the bid season, not during it.
We Are Watching Frac Sand
Magnolia Oil & Gas agreed on 20 July to buy WildFire Energy from Warburg Pincus and Kayne Anderson for approximately $4.06bn including debt. The detail that matters to our readers is buried in the asset list. Included in the transaction is a sand mine that already supplies roughly 80% of Magnolia’s annual sand consumption, all of WildFire’s requirements, and third-party volumes on top. The deal adds about 810,000 net acres in Giddings and takes the pro forma position past 1.25 million net acres across the Austin Chalk, Eagle Ford and Woodbine.
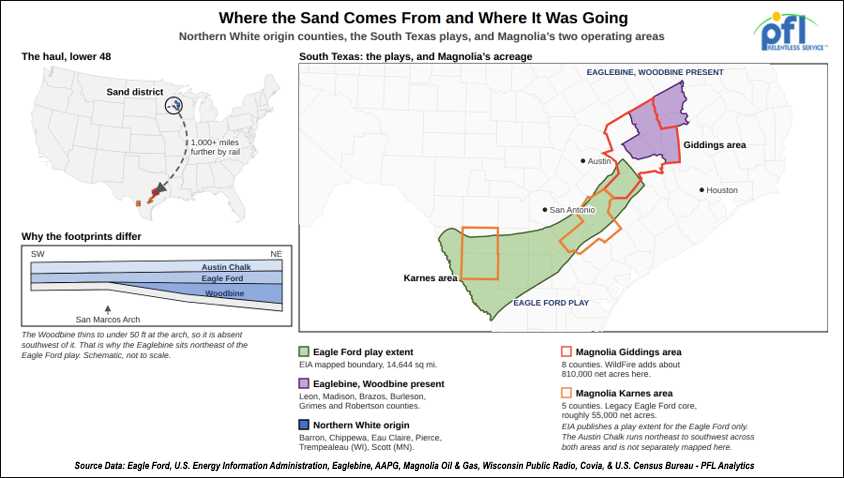
A producer that owns its own in-basin mine does not buy sand carloads. The long-haul Northern White business that filled covered hoppers out of Wisconsin and Minnesota was hollowed out by in-basin sand years ago, and a transaction like this converts that displacement from a commercial decision into a structural one. Magnolia is not renting capacity from a supplier who might one day price rail back into the equation. It owns the pit.
The synergy math says the same thing out loud. Magnolia expects more than $100mn in annual savings with a net present value of roughly $700mn, and the named sources include shared facilities and infrastructure, streamlined field operations and, explicitly, supply chain and logistics pricing. More than 500 miles of gas gathering pipeline came with the assets as well. Every line item on that list is a transport cost coming down.
Nor is this a drilling boom. Magnolia has committed to holding capital spending at 55% of annual adjusted EBITDAX for what it calls moderate production growth, and lifted its standalone 2026 production guidance only to 6% from 5%. The acquired assets run at roughly 53,000 barrels of oil equivalent per day on a 29% base oil decline, sit next to Gulf Coast markets and are served by pipe. There is no crude by rail in the Eagle Ford and there is not going to be.
In our opinion, the consolidation wave in U.S. shale keeps being sold to the freight market as a demand story and it is nothing of the sort. Bigger, better capitalized operators sitting on contiguous acreage buy fewer miles of everything. Covered hopper owners should read this deal as a warning rather than a green light, and anyone still waiting for a shale recovery to soak up an idle sand fleet (what’s left of it) is going to keep waiting.
We Are Watching the Surface Transportation Board
Canadian National and Union Pacific signed two memorandums of understanding on July 22nd. The first is contingent on Surface Transportation Board approval of the Union Pacific and Norfolk Southern merger and commits CN to withdraw its opposition. In exchange, CN gets access to shipper facilities where the merger would cut Class I options from three to two or from two to one. CN also takes overhead rights between Tuscola and East St. Louis in Illinois and between St. Louis and Kansas City in Missouri, usage of Union Pacific’s Neff Yard in Kansas City, and Norfolk Southern’s ownership interests in the Kansas City Terminal Railway and the Terminal Railroad Association of St. Louis.
The second memorandum is not tied to the merger at all. Union Pacific gets expanded rights over CN’s Elgin, Joliet and Eastern corridor around Chicago, and CN gets new rights over Union Pacific between Memphis and Eagle Pass, Texas. Tracy Robinson called it a natural extension of CN’s north-south franchise. Jim Vena was blunter, saying he wanted the quickest way around Chicago. For anyone routing freight between Canada and Mexico, this is the more consequential of the two documents.
The Board is not softening. It ordered Union Pacific and Norfolk Southern on 22 July to redesignate their employee impact exhibits as public by 27 July, rejecting the argument that the data was too commercially sensitive to release. Those exhibits set out how many craft and management positions would be abolished, created or transferred. The Board noted comparable information has been public in past merger cases. Labor asked for it and got it.
Losing CN removes one obstacle and may give Union Pacific a path to arguing that competitive concerns can be addressed through targeted access rather than opposition. It does not remove CPKC, BNSF, agricultural and commodity shippers, or the unions. The combination would create a roughly 55,000 mile network handling about half of U.S. rail freight, and it is the first major Class I merger tested against the 2001 rules requiring applicants to enhance competition rather than merely preserve it. The supplemental filing deadline is 27 July. In our opinion CN did very well here. Kansas City and a Mexico route, in exchange for dropping a comment letter it was probably never going to win with, is a good trade!
We are watching Class 1 Industrial Headcount
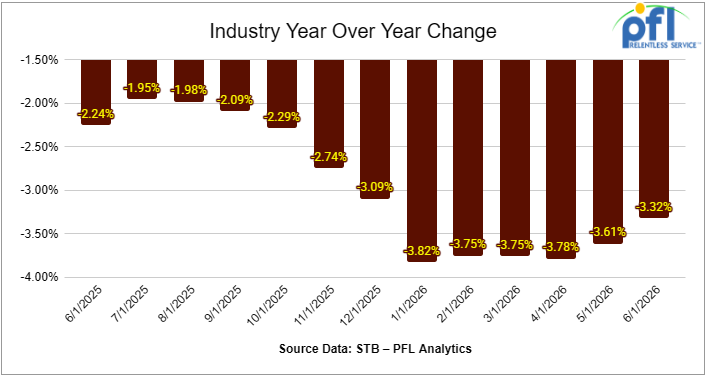
Class I railroads employed 115,013 workers in the United States in June 2026, a -0.01% decrease from May 2026’s count of 115,030, and a -3.32% year-over-year decrease from June 2025’s total of 118,965, according to Surface Transportation Board data.
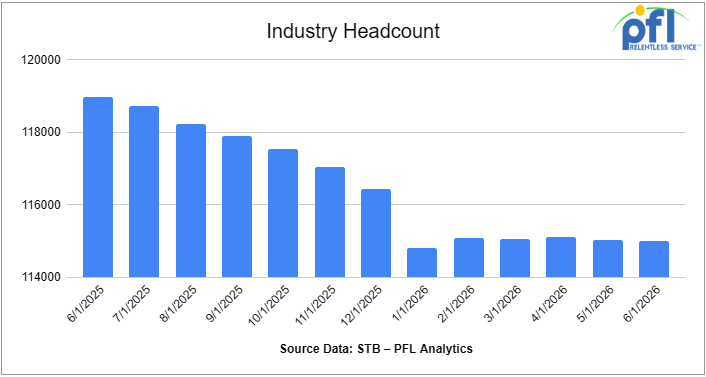
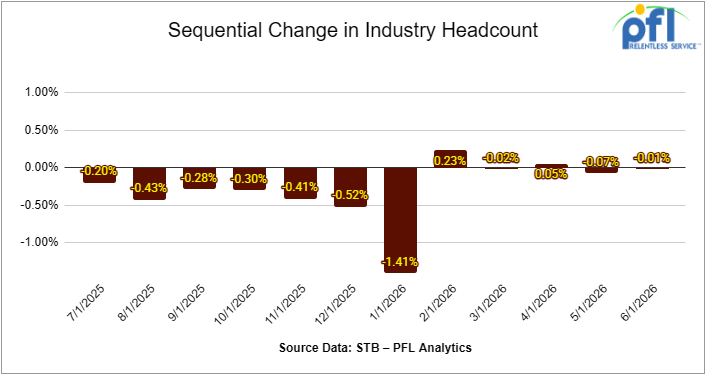
Two of the six employment categories posted month-over-month increases between May and June 2026. These were Executives, officials, and staff assistants, which increased 0.49% to 7,992 workers, and Professional and Administrative, which increased 1.67% to 8,872 workers.
The categories that posted month-over-month decreases were Maintenance of Way and Structures, down -0.53% to 28,641 workers; Maintenance of Equipment and Stores, down -0.36% to 15,888 workers; Transportation (other than train and engine), down -0.39% to 4,627 workers; and Transportation (train and engine), down -0.06% to 48,993 workers.
No employment categories posted a year-over-year gain in June 2026.
Categories that registered year-over-year decreases in June 2026 were Executives, officials, and staff assistants, down -0.11%; Professional and Administrative, down -4.62%; Maintenance of Way and Structures, down -1.50%; Maintenance of Equipment and Stores, down -6.62%; Transportation (other than train and engine), down -6.69%; and Transportation (train and engine), down -3.20%
Lease Bids
- 20-50, 4000-5000 Covered Hoppers located off of UP or BNSF in Houston. For use in Urea, Potash, and Ammonium Sulfate service. Period: 6-12 Months.
- 30-50, 25.5K DOT 111 Tanks located off of All Class 1s in various locations. For use in Asphalt service. Period: 1-3 Years.
- 40, 29K DOT 111 Tanks located off of UP or BNSF in the Midwest. For use in Veg Oil service. Period: 5 Year.
- 20, DOT 117J Tanks located off of NS, CSX, CN, or CPKC in various locations. For use in C5 service. Period: 1 year. Need gauge rods.
- 300, 5200CF Covered Hoppers located off of CP or CM in Canada. For use in Petcoke service. Period: 3 Year.
- 10, 30K 117J Tanks located off of BNSF in Canada. For use in Propane or Butane service. Period: 3 Year.
- 20, 28K or larger 117J Tanks located off of BNSF or UP in California. For use in Crude service. Period: 6 months.
- 75, 30K 117 Tanks located off of NS in Ohio. For use in Condensate service. Period: 6-12 Months. Mag Rods Not Needed.
- 100, 28.3K DOT 111 or 117 Tanks located off of CP or CN in Canada. For use in VGO service. Period: 1-3 Years.
- 5, 28.3K DOT 111 or 117 Tanks located off of CN in Canada. For use in Bitumen service. Period: Trip Lease.
- 5-10, 25.5K DOT 111 Tanks located off of CN in Canada. For use in Caustic service. Period: 3-6 Months.
- 100, 340W Pressure Tank located off of CN or CP in Canada. For use in Propane service. Period: 6 Months.
- 10-20, 3200 or 3281 Covered Hoppercars located off of CN or CP in Canada. For use in Sodium Sulphate service. Period: 3-5 years. Lined.
- 50, 340W Pressure Tank located off of CN or CP in Canada. For use in Propane service. Period: Winter.
- 30-50, 340W pressure Tank located off of NS or CSX in Northeast U.S. For use in Propane service. Period: Winter.
- 25, 340W Pressure Tank located off of UP or BN in US. For use in Propane service. Period: Winter.
Sales Bids
- 28, 3400CF Covered Hoppers located off of UP or BNSF in Texas. For use in Cement service. Cement Gates needed.
- 20, 17K DOT111 Tanks located off of various class 1s in various locations. For use in corn syrup service.
- 120, Various Open-Top Aluminum Rotary Gondolas located off of various class 1s in various locations. For use in Sulphur service. Built 2004 or later.
- 12, 21.5K-25K DOT 111 Tanks located off of Various Class 1s in Michigan. For use in Diesel, Asphalt, Crude service. Coiled and Insulated.
Lease Offers
- 21, 6351 Covered Hoppers located off of CN in Wisconsin. Last used in DDG. Available until February 2027.
- 29, 6500 Covered Hoppers located off of CN in Wisconsin. Last used in DDG. Available until February 2027.
- 50, 20K DOT117J Tanks located off of all class 1s in Moving. Last used in styrene.
- 29, 25.5K DOT117J Tanks located off of UP or BNSF in Texas. Cars are currently clean.
- 200, 340W DOT 112J Tanks located off of all class 1s in Multiple Locations. Last used in propane and butane. Cars are currently clean.
- 15, 6200CF Covered Hoppers located off of all class 1s in Wisconsin. Last used in plastic. Cars are currently clean.
- 30, 6500CF Covered Hoppers located off of all class 1s in Wisconsin. Last used in plastic. Cars are currently clean.
- 6, 21K Stainless Steel Tanks located off of UP in Texas / Mexico Border. Last used in surfactant. Cars are currently clean.
- 100, 28.4K DOT 117J Tanks located off of UP or BNSF in Beaumont, TX. Cars are currently clean.
- 50, 30K DOT117J Tanks located off of UP or BNSF in the South. Last used in ethanol.
- 30, 30K DOT 117R Tanks located off of BNSF in Washington. Last used in renewable jet fuel.
- 80, 30K DOT 117R Tanks located off of BNSF in Washington. Last used in renewable diesel.
- 10, 30K DOT 117R Tanks located off of BNSF in Washington. Last used in renewable naphtha.
- 10, 29K DOT 117R Tanks located off of BNSF and UP in Texas. Last used in gasoline additive. Coiled and Insulated.
- 39, 31K CPC1232 Tanks located off of All Class 1s in Iowa. Last used in diesel.
- 2, 30K DOT 117R Tanks located off of BNSF and UP in Texas. Last used in giesel.
- 1, 30K DOT 117R Tanks located off of BNSF and UP in Texas. Last used in gas blend stock.
- 3, 30K DOT 117R Tanks located off of BNSF and UP in Texas. Last used in gasoline.
- 41, 30K DOT 111 Tanks located off of in Brownsville. Last used in Diesel. Cars are currently clean.
Sales Offers
- 81, 31.8K CPC1232 Tanks located off of UP or BNSF in TX. Last used in Multiple Services. Requal Due in 2025.
- 35, 3400CF Covered Hoppers located off of UP or BNSF in the Midwest. Last used in Sand.
- 25, 30K 117J Tanks located off of CSX in Jackson, TN. Last used in Fuels. Newly Requalified.
Call PFL today to discuss your needs and our availability and market reach. Whether you are looking to lease cars, lease out cars, buy cars, or sell cars call PFL today at 239-390-2885
Railcar for Sale or Lease
| CAT | Type | Capacity | GRL | QTY | LOC | Class | Prev. Use | Offer | Note |
|---|
| CAT | Type | Size | GRL | QTY | LOC | Class | Term | Commodity | Offer | Note |
|---|
| CAT | Type | Capacity | GRL | QTY | LOC | Class | Prev. Use | Clean | Offer | Note |
|---|
| CAT | Type | Capacity | GRL | QTY | LOC | Class | Commodity | Offer | Note |
|---|
PFL will be at the Following Conferences

- Where: The Westin Galleria Dallas
- Attending: David Cohen (954-729-4774), and Curtis Chandler (239-405-3365)
- Conference Website

- Where: The Westin Galleria Dallas
- Attending: Brian Baker (239.297.4519)
- Conference Website