
“Never confuse a single defeat with a final defeat.” – F. Scott Fitzgerald
Jobs Update
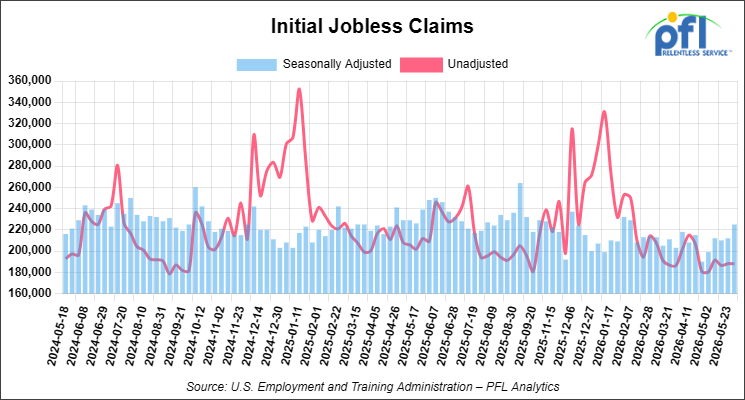
Initial jobless claims seasonally adjusted for the week ending May 30, 2026 came in at 225,000, versus the adjusted number of 212,000 people from the week prior, up 13,000 people week over week.
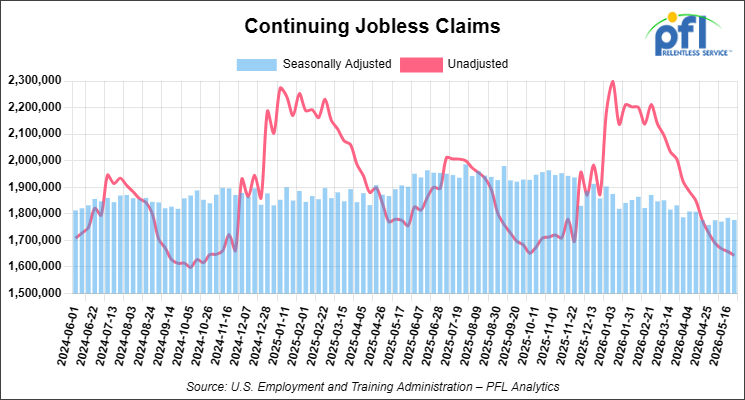
Continuing jobless claims came in at 1,777,000, versus the adjusted number of 1,785,000 people from the week prior, down 8,000 week-over-week.
Stocks closed lower on Friday of last week and lower week-over-week
The DOW closed lower on Friday of last week, down -695.15 points (-1.35%), closing out the week at 50,866.78, down -165.68 points week-over-week. The S&P 500 closed lower on Friday of last week, down -200.47 points (-2.64%), and closed out the week at 7,383.84, down -196.22 points week-over-week. The NASDAQ closed lower on Friday of last week, down -1121.53 points (-4.18%), and closed out the week at 25,709.43, down -1,263.19 points week-over-week.
In overnight trading, DOW futures traded lower and are expected to open at 50,870 this morning, down -66 points from Friday’s close.
Crude oil closed lower on Friday of last week and higher week-over-week
West Texas Intermediate (WTI) crude closed down -$2.50 per barrel (-2.7%), to close at $90.54 on Friday of last week, but up $2.85 week-over-week. Brent crude closed down -$1.94 per barrel (-2%), to close at $93.09, but up $1.04 week-over-week.
One Exchange WCS (Western Canadian Select) for July settled on Friday of last week at US$12.10 below the WTI-CMA (West Texas Intermediate – Calendar Month Average). The implied value was US$76.88 per barrel.
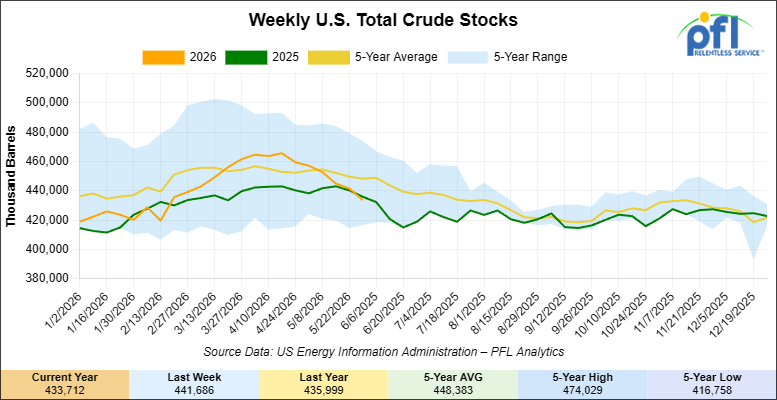
U.S. commercial crude oil inventories (excluding those in the Strategic Petroleum Reserve) decreased by 8 million barrels week-over-week. At 433.7 million barrels, U.S. crude oil inventories are 3% below the five-year average for this time of year.
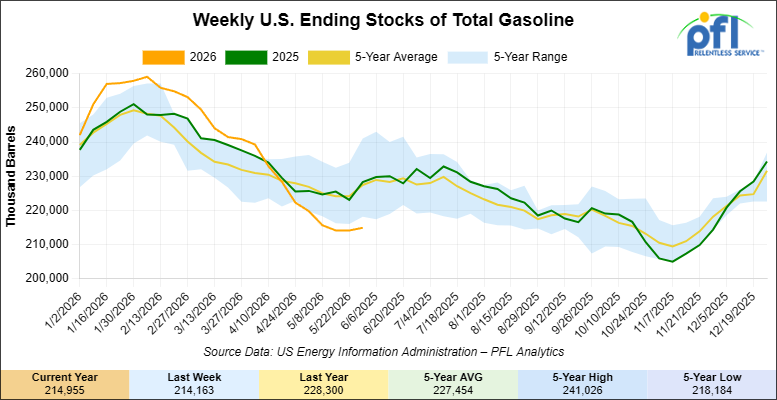
Total motor gasoline inventories increased by 3.4 million barrels week-over-week and are 5% below the five-year average for this time of year.
Distillate fuel inventories increased by 1.5 million barrels week-over-week and are 3% below the five-year average for this time of year.

Propane/propylene inventories increased by 2.1 million barrels week-over-week and are 39% above the five-year average for this time of year.
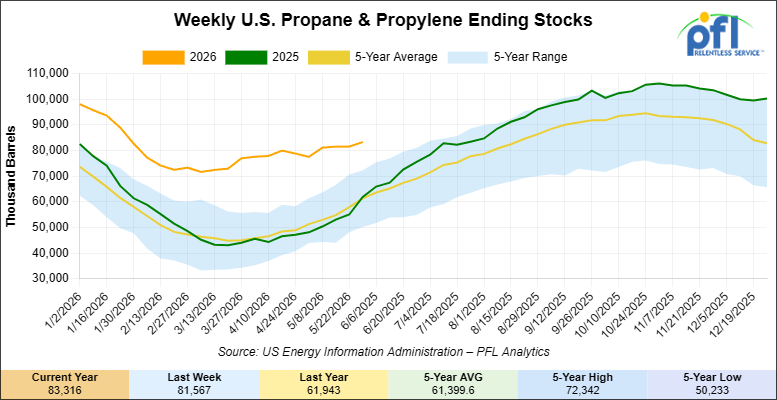
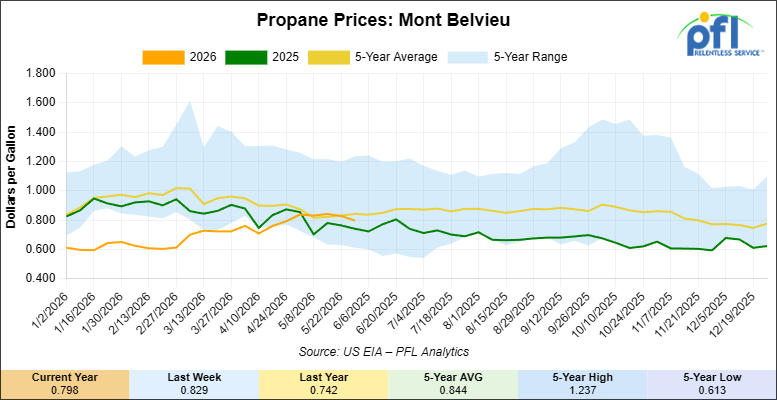
Propane prices closed at 79.8 cents per gallon on Friday of last week, down 3.1 cents per gallon week-over-week, but up 5.6 cents year-over-year.
Overall, total commercial petroleum inventories decreased by 2.6 million barrels week-over-week during the week ending May 29, 2026.
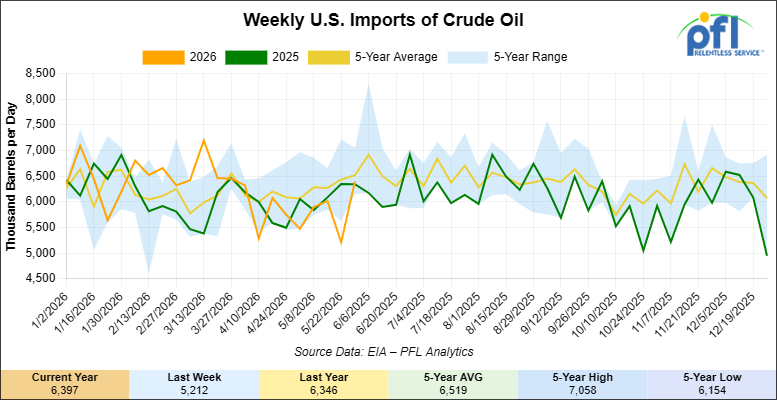
U.S. crude oil imports averaged 6.4 million barrels per day during the week ending May 29, 2026, an increase of 1.2 million barrels per day week-over-week. Over the past four weeks, crude oil imports averaged 5.9 million barrels per day, 4.5% less than the same four-week period last year. Total motor gasoline imports (including both finished gasoline and gasoline blending components) averaged 780,000 barrels per day, and distillate fuel imports averaged 121,000 barrels per day during the week ending May 29, 2026.
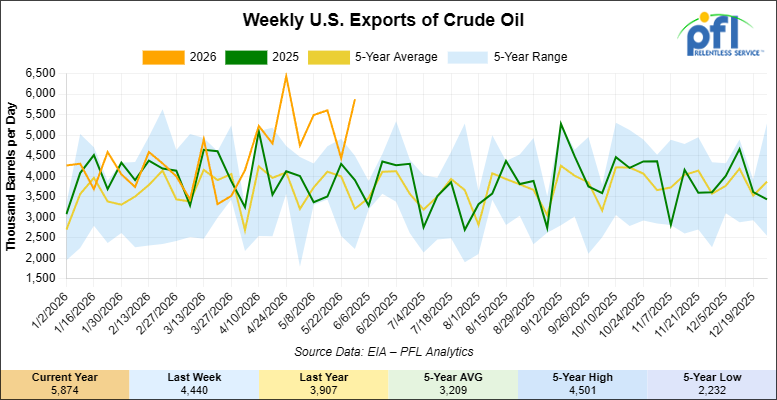
U.S. crude oil exports averaged 5.874 million barrels per day during the week ending May 29, 2026, an increase of 1.434 million barrels per day week-over-week. Over the past four weeks, crude oil exports averaged 5.353 million barrels per day.
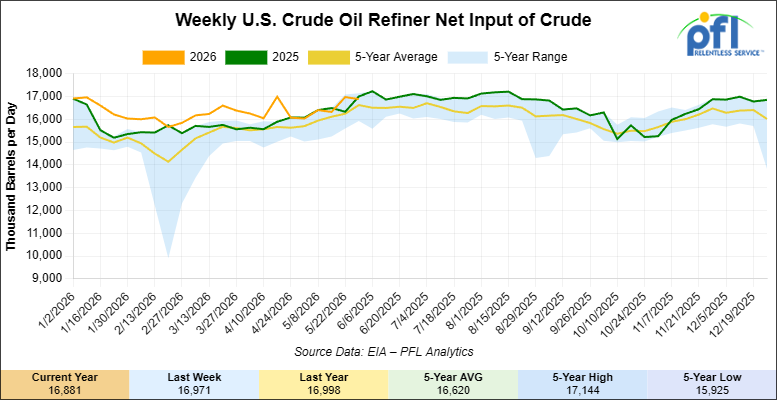
U.S. crude oil refinery inputs averaged 16.9 million barrels per day during the week ending May 29, 2026, which was 90,000 barrels per day less week-over-week.
WTI is poised to open at $94.88, up $4.34 per barrel from Friday’s close.
North American Rail Traffic
Week Ending June 3, 2026:
Total North American weekly rail volumes were up (+6.77%) in week 23, compared with the same week last year. Total Carloads for the week ending June 3, 2026 were 327,635, up (+4.02%) compared with the same week in 2025, while weekly Intermodal volume was 322,419, up (+9.72%) year over year. 10 of the AAR’s 11 major traffic categories posted year-over-year increases. The largest decrease came from Coal (-0.81%). The largest increase was Grain (+27.30%).
In the East, CSX’s total volumes were up (+5.57%), with the largest decrease coming from Petroleum & Petroleum Products (-7.43%), while the largest increase came from Other (+19.78%). NS’s total volumes were up (+6.69%), with the largest increase coming from Petroleum & Petroleum Products (+24.70%), while the largest decrease came from Grain (-12.97%).
In the West, BNSF’s total volumes were up (+13.54%), with the largest increase coming from Coal (+61.71%), while the largest decrease came from Other (-12.26%). UP’s total volumes were up (+1.79%), with the largest increase coming from Metallic Ores and Metals (+26.39%), while the largest decrease came from Coal (-19.05%).
In Canada, CN’s total volumes were up (+1.72%), with the largest increase coming from Coal (+61.71%), while the largest decrease came from Metallic Ores and Metals (-13.28%). CPKCS’s total volumes were up (+12.65%), with the largest increase coming from Grain (+39.98%), while the largest decrease came from Coal (-11.85%).
Source Data: AAR – PFL Analytics
North American Rig Count Summary
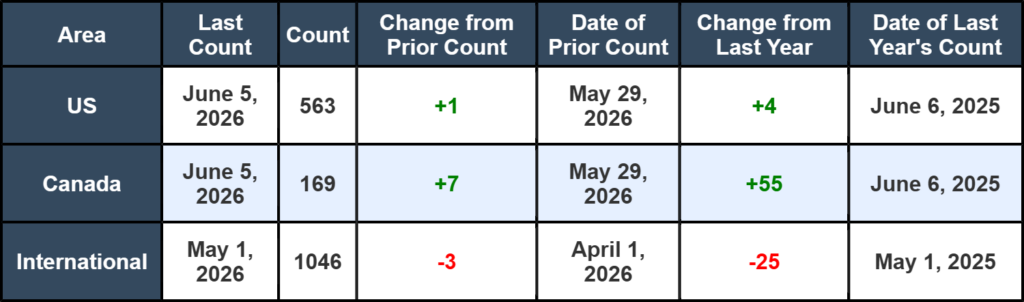
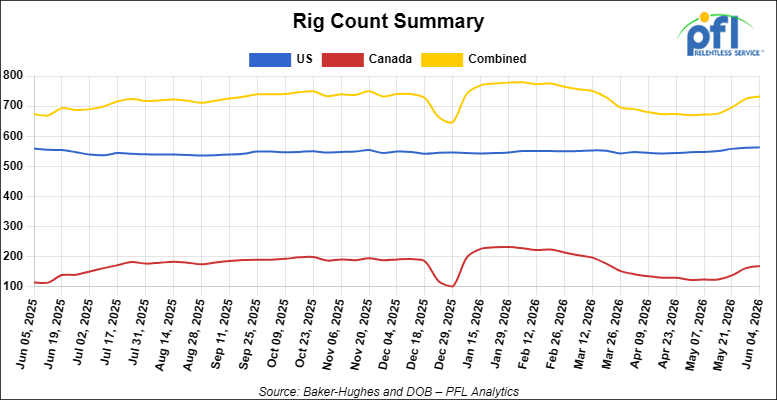
North American rig count was up by +8 rigs week-over-week. The US rig count was up by +1 rig week-over-week, and up by +4 rigs year-over-year. The US currently has 563 active rigs. Canada’s rig count was up by +7 rigs week-over-week and up by +55 rigs year-over-year. Canada currently has 169 active rigs. Overall, year-over-year we are up by +59 rigs collectively.
International rig count was down by -3 rigs month-over-month and down by -25 rigs year-over-year. Internationally there are 1046 active rigs.
We are watching a few things out there for you:
We Are Watching Petroleum Carloads
The four-week rolling average of petroleum carloads carried on the six largest North American railroads rose to 29,665 from 29,494 which was an increase of +171 rail cars week-over-week. Canadian volumes were mixed. CN’s shipments were lower by -3.0% week-over-week, CPKC’s volumes were higher by +13.0% week-over-week. U.S. shipments were also mixed. The UP had the largest percentage decrease and was down by -12.0%. The BNSF had the largest percentage increase and was up by +4.0% week-over-week.
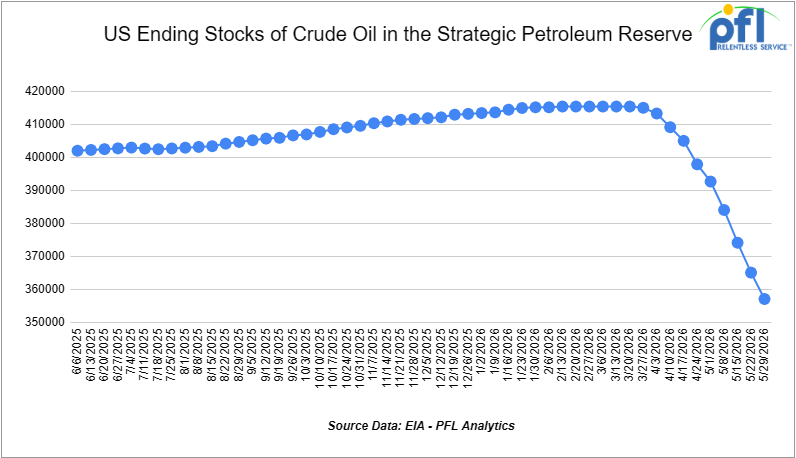
We Continue to Watch Our Strategic Petroleum Reserves
The ongoing emergency drawdown of the U.S. Strategic Petroleum Reserve (SPR) remains a major component of global efforts to offset crude oil supply disruptions stemming from the conflict involving Iran and the continued restrictions on oil shipments through the Strait of Hormuz. Since March, the Department of Energy (DOE) has awarded exchanges covering more than 80 million barrels of crude oil, with additional releases expected as part of a broader international response coordinated through the International Energy Agency (IEA).
The United States committed to making up to 172 million barrels available from the SPR under the IEA’s collective plan to inject roughly 400 million barrels into global energy markets. Officials have argued that the releases are necessary to help stabilize crude supplies and limit further increases in fuel prices as refiners compete for replacement barrels amid ongoing transportation disruptions.
As releases have accelerated, inventories in the SPR have declined to 357.112 million barrels, down sharply from levels above 450 million barrels earlier this year and reaching their lowest level since January 2024. Recent weekly withdrawals have ranked among the largest on record, highlighting the scale of the government’s intervention in oil markets. On average, since the war started with Iran, the United States has withdrawn approximately 1.02 million barrels per day from the SPR through the week ending May 29, 2026.
Global petroleum inventories have also tightened considerably. The IEA has reported substantial draws in commercial crude and refined-product stockpiles across major consuming nations, underscoring the strain that the conflict has placed on world energy markets. Agency officials have indicated that further coordinated actions remain possible should supply disruptions persist or intensify.
The Administration continues to emphasize that the current program consists primarily of exchange agreements, rather than outright sales. Under these arrangements, companies receiving crude oil today are required to return the borrowed barrels in the future along with additional volumes as a premium. Energy Secretary Chris Wright has stated that the objective is to eventually restore the SPR to levels above those that existed prior to the current emergency releases.
Meanwhile, energy prices remain elevated compared with pre-conflict levels, keeping fuel costs a focus for consumers, businesses, and policymakers alike. Market participants continue to monitor developments in the Middle East, future IEA actions, and the pace of SPR releases as key factors influencing oil prices through the remainder of the year.
We Are Watching Trans Mountain Pipeline
The Canada Energy Regulator on Thursday of last week approved Trans Mountain’s drag reducing agent (“DRA”) project, clearing the path for a roughly 10% throughput increase, or approximately 90,000 barrels per day(“b/d”), on top of the existing 890,000 b/d capacity of the system. Construction starts in August, with the additional barrels expected to flow by January 2027. Trans Mountain has also flagged a second, larger expansion of 210,000 b/d for 2029 or 2030, which would push total system capacity above 1.19 million b/d. The DRA approval costs about C$9 million and requires no new pump stations, just 16 skid-mounted units at 12 existing locations.
Trans Mountain Pipeline
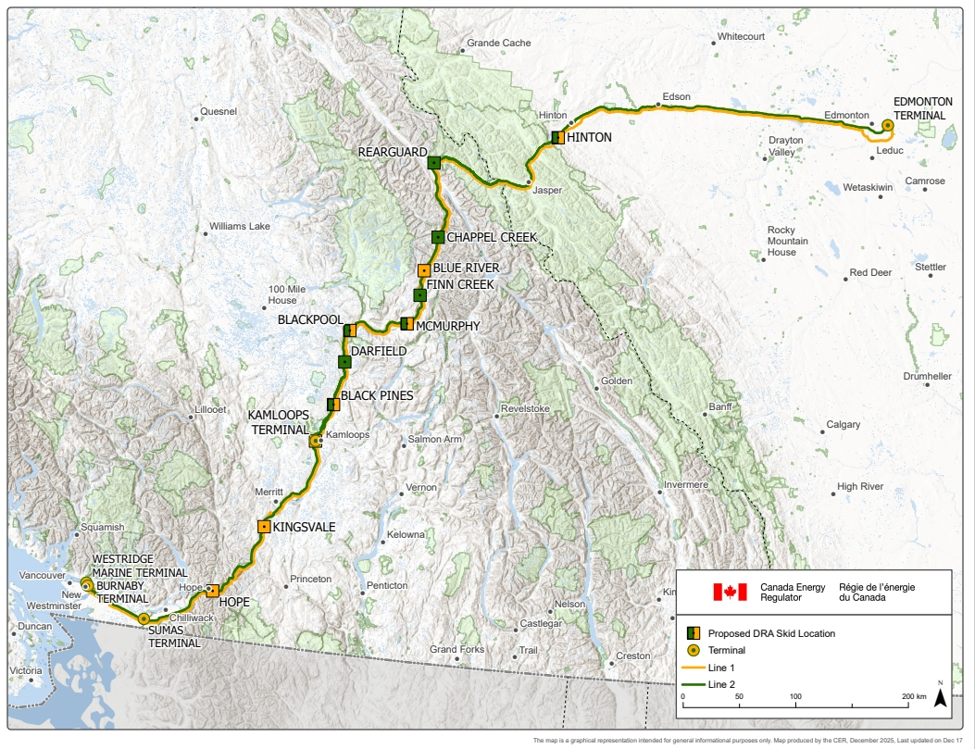
Source: Government of Canada
The Trans Mountain system is now officially full. Trans Mountain apportioned 0.2% of June nominations across both lines, the first time the system has been apportioned since the expansion came on line in May 2024. On top of Trans Mountain being full, Enbridge restricted 19% of heavy crude nominations on it’s Mainline for the same month. Both major egress lines out of Alberta are at the wall at the same time, and the DRA project does not deliver new barrels for another six months.
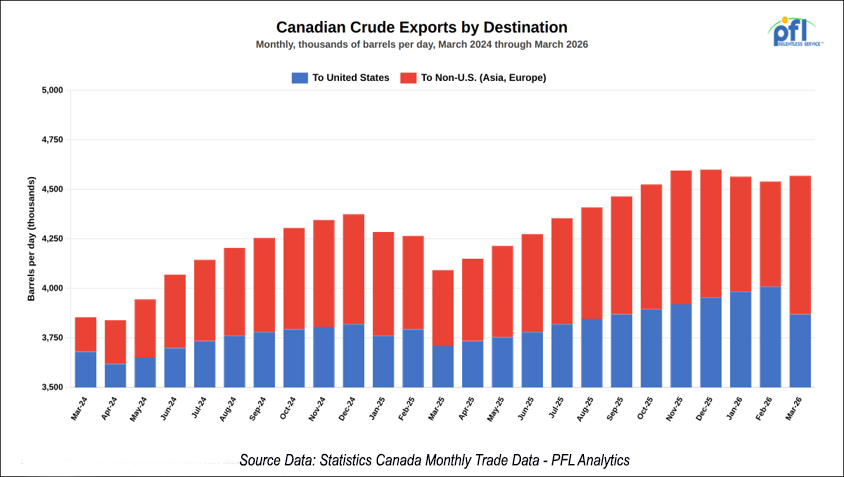
The export data tells the same story. Canadian oil exports hit an all-time monthly record of 4.57 million b/d in March, with exports to non-U.S. destinations at a record 699,000 b/d, nearly double a year ago. The non-U.S. share has grown to 15%, or one in six barrels, up from 9% a year earlier. U.S. imports of heavy Canadian crude hit a quarterly record of 3.18 million b/d in the first quarter, the highest on record.
Liberal Prime Minister Carney has vowed to double non-U.S. exports within ten years and to deliver the fastest-growing economy in the G7. In our opinion, the export data is moving in the right direction in spite of his government, not because of it. Statistics Canada reported last week that the Canadian economy tipped into a technical recession in the first quarter, contracting 0.1% at an annual pace after a 1% contraction in the fourth quarter. Conservative Opposition leader Pierre Poilievre noted that Canada is the only G7 country in recession.
PFL has been watching the Alberta egress story for years and will keep watching. Until DRA barrels are flowing and the next round of capacity is sanctioned, the pipeline system is going to keep bumping into a ceiling, and that ceiling is where the crude by rail conversation lives.
We Are Watching Alberta Wildfires
Wildfires broke out last weekend in the Lac la Biche region of northeast Alberta. Six out of control fires are burning within 20 kilometers of major oil sands sites including Cenovus’s Christina Lake, Canadian Natural’s Jackfish and Kirby North, and ConocoPhillips’ Surmont, sites that together produce about half a million barrels per day. The community of Conklin was placed on evacuation alert over the weekend before being lifted as rains slowed the spread.
Alberta’s fire season runs March through October and is just getting underway. Last year’s Caribou Lake event forced Cenovus to shut in 238,000 b/d at Christina Lake for nearly two weeks and ultimately cost the company about two million barrels of production. Five of Alberta’s eight currently active wildfires are concentrated in the Lac la Biche zone, where most of the in-situ oil sands well sites operate.
Add this to the planned Suncor Firebag and Imperial Kearl turnarounds that take roughly half a million barrels per day of bitumen offline, and the heavy sour supply picture is meaningfully tighter than it was thirty days ago. Sustained shut-ins this summer would tighten Canadian heavy differentials and solve, at least for the short term pipeline apportioned problems. PFL will keep watching as the fire season progresses and report to our readers. Stay tuned to PFL for further updates.
We Are Watching RINs
RIN prices have roughly doubled in six months and continue to grind higher. D6 ethanol RINs closed last week at $2.33 and ½ of a cent per RIN, and D4 biomass-based diesel RINs closed at $2.39 per RIN, up roughly $1.33 for each vintage since December of 2025. Both are now sitting above the 2022 cycle highs of $1.91 for D4 and $1.68 for D6, with no obvious technical resistance.
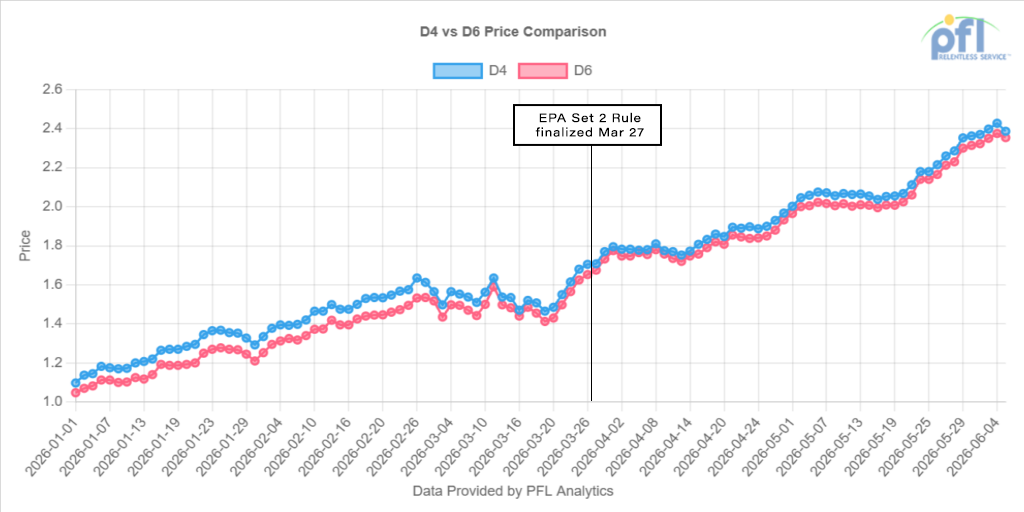
The catalyst is structural. On March 27 the EPA finalized the Set 2 Rule at the highest Renewable Fuel Standard volume requirements in program history, above the original June 2025 proposal, with the foreign-feedstock penalty deferred to 2028 or later. Higher mandates pull more RINs into the compliance bucket. The 45Z Clean Fuel Production Tax Credit that replaced the Blenders Tax Credit in January 2025 rewards only domestic production, and continued SAF and renewable diesel exports to Europe pull supply out of the U.S. compliance pool. A bullish triangle.
Refiners are responding to the math. Valero’s joint-venture Diamond Green Diesel reported first quarter operating income of $139 million, reversing a $141 million loss in the year-ago quarter, and expects to sell about 84,000 b/d of renewable fuels in the second quarter, the highest in more than two years. Marathon’s Martinez Renewables facility is targeting above 90% utilization in the second quarter after completing a turnaround, and the renewable diesel unit swung to $38 million of adjusted EBITDA from a $42 million loss a year ago.
For tank car economics this is unambiguously positive. Higher RIN values widen blender margins, which pulls more ethanol unit trains, more biodiesel and renewable diesel manifest moves, and more SAF railed to coastal export terminals. The mandate increase, the import-restricting structure of 45Z, and the export pull are all moving the same direction, and unlike the geopolitical stories elsewhere in this report, this one does not turn on a peace deal.
PFL’s RIN Recap covers this market in detail every week, make sure you are getting our emails. PFL works with shippers involved in feedstocks (multiple transloading locations) ethanol, biodiesel, and renewable diesel tank car requirements and is well positioned to help as the renewable fuel volumes increase through the back half of the year. We also broker compliant approved RINS and LCFS credits.
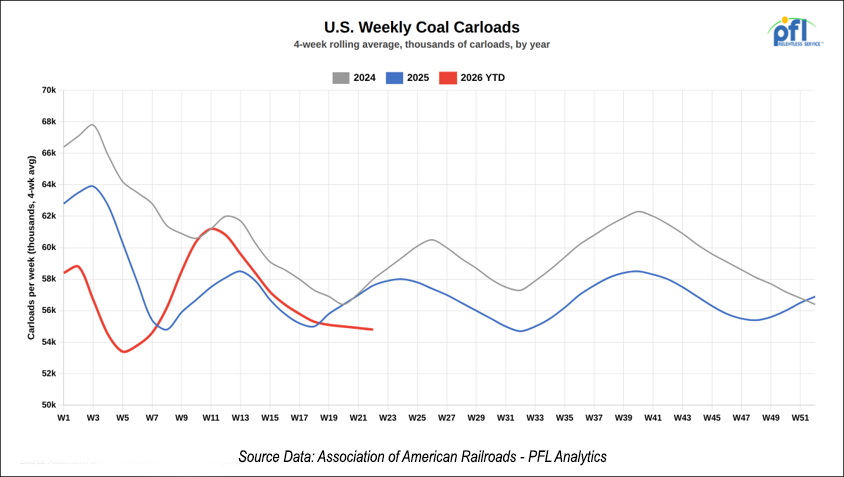
We Are Watching Coal
President Trump on Thursday of last week committed nearly $700 million in federal support to the U.S. coal industry, invoking the Defense Production Act to keep 13 existing coal-fired plants running, fund construction of new plants in Alaska and West Virginia, and finally move the long-delayed West Gateway export terminal at the Port of Oakland forward. For freight rail, every line item in this package is a positive for coal cars.
Here is the breakdown. $425 million goes to the 13 existing plants. $185 million funds the new builds, including the first new coal plants in the United States since 2013 and the restart of a shuttered plant in Maryland. $75 million goes to West Gateway, which is designed to ship up to 12 million tons of coal per year to overseas buyers.
Twelve million tons of coal a year out of Oakland means twelve million tons moving by unit train to get there, almost all of it sourced from Wyoming’s Powder River Basin, the largest coal region in the country. That is incremental loaded volume on BNSF and Union Pacific corridors that serve the basin today. The 13 existing plants getting funded all take coal by unit train, and federal money that extends their operating lives extends those train cycles.
The White House put job creation at 14,000 across mining, construction, rail and maritime. The Oakland terminal still has a permitting process to work through and the new plants will take years to build, but the funding is committed and the direction is clear. PFL is active in Coal in many ways including storage and repair and we will keep watching as the construction timelines firm up.
We Continue to Watch the CPKC Strike
We flagged the strike notice in last week’s report. At 8 a.m. Mountain Time on Sunday May 31, approximately 300 CPKC signals and communications workers walked off the job. No deal was reached. CPKC activated contingency plans immediately and reports that safe and efficient service is continuing across Canada. U.S. operations are not affected.
CPKC’s Senior General Chairman Jason Sommer of IBEW System Council No. 11 said the company had not meaningfully addressed recruitment, retention, or the scheduling demands that are driving experienced signal workers out of the department entirely. CPKC counters that its offer is consistent with agreements every other Canadian union on its network has accepted, and that the IBEW position is an outlier. The railroad is publicly pushing for binding arbitration.
Signals work is specialized. Qualified replacement staff can cover the basics, but the longer this runs, the greater the risk of degraded response times on maintenance, inspections, and incident response across a transcontinental network. Unlike a strike with a defined back-to-work order or arbitration deadline, this one has no end date on the horizon. We will keep watching as the arbitration question develops.
We Continue to Watch the Union Pacific
President Trump floated the idea of a 15% federal stake in a railroad in a Fortune interview last week, without naming the company. Union Pacific chief executive Jim Vena told CNBC on Thursday of last week that he has not had direct conversations with Trump about a federal partnership, and that UP can afford the Norfolk Southern deal on its own. “We do not need anybody’s help to do this,” Vena said.
Vena was careful with the language though. He called it “comforting that the President of the United States looked at what we are doing and says, ‘Son of a gun, this is a good business move … and I’d like to invest.’” Translation, UP does not want the federal money but is not in a position to publicly slam the door on the idea while a contested merger is in front of the Surface Transportation Board.
Speaking of the Board, Shipper groups including the National Industrial Transportation League and the Private Railcar Food and Beverage Association welcomed the STB’s May 28 decision to hold the merger application in abeyance and require UP and NS to demonstrate that the deal will enhance, rather than merely preserve, competition. The 2001 rules being tested here have never been applied to a Class I merger before. The federal-equity wrinkle is on top of all of that.
We have been saying this for months. The combination of an untested regulatory standard, a hostile shipper coalition, a competing BNSF-CSX interline alternative, and now a White House that wants a piece of the action, means this deal has more variables in front of it than it had when it was announced. PFL is watching this one closely.
We are Watching Key Economic Indicators
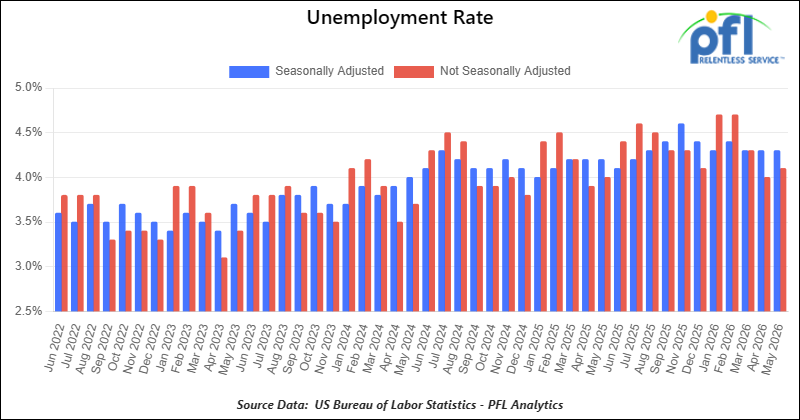
U.S. Unemployment
On June 5, the U.S. Bureau of Labor Statistics (BLS) reported that a preliminary 172,000 net new jobs were created in May 2026, exceeding expectations and marking the third consecutive month of solid job growth. The BLS also revised employment figures for the prior two months upward, adding a combined 93,000 jobs to March and April totals. March was revised up to 214,000 new jobs, while April was revised up to 179,000.
According to the BLS, total nonfarm payroll employment has increased by approximately 410,000 jobs over the last three months (March through May 2026). The official unemployment rate remained 4.3% in May, unchanged from April and consistent with the relatively stable labor market conditions seen throughout much of 2026.
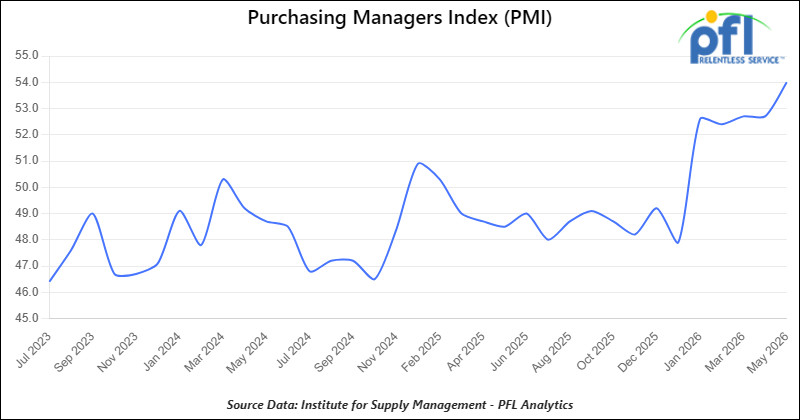
Purchasing Managers Index (PMI)
The Institute for Supply Management releases two PMI reports—one covering manufacturing and the other covering services. These reports are based on surveys of supply managers across the country and track changes in business activity. A reading above 50% on the index indicates expansion, while a reading below 50% signifies contraction, with a faster pace of change the farther the reading is from 50.
The Manufacturing PMI registered 54.0% in May 2026, up from 52.7% in April and marking the fifth consecutive month of expansion and the strongest reading since May 2022. Growth was driven by continued increases in production and new orders, with the New Orders Index rising to 56.8% from 54.1% in April. Despite stronger demand, the employment component remained in contraction territory, indicating manufacturers continue to be cautious about hiring.
The Services PMI registered 54.5% in May 2026, up from 53.6% in April, reflecting the sector’s 23rd consecutive month of expansion. Business activity and new orders both strengthened during the month, with the New Orders Index increasing to 57.3% from 53.5% in April. However, the employment index fell to 47.9%, signaling continued weakness in service-sector hiring despite solid overall business activity.
Lease Bids
- 100, 21.9K 117J Tanks located off of All Class 1s in the Midwest. For use in CO2 service. Period: 6 months.
- 30-50, 30K 117J Tanks located off of NS or CSX in the Northeast. For use in C5 service. Period: 1 year.
- 20-50, 4000-5000 Covered Hoppers located off of UP or BNSF in Houston. For use in Urea, Potash, and Ammonium Sulfate service. Period: 6-12 Months.
- 200, 33K Pressure Tanks located off of CSX or NS in Ohio. For use in Propylene service. Period: 18 Months.
- 30-50, 25.5K DOT 111 Tanks located off of All Class 1s in various locations. For use in Asphalt service. Period: 1-3 Years.
- 40, 33K Pressure Tanks located off of UP in Eunice, LA. For use in Propane service. Period: 1 Year.
- 40, 29K DOT 111 Tanks located off of UP or BNSF in the Midwest. For use in Veg Oil service. Period: 5 Year.
- 70, 30K DOT 117 Tanks located off of NS or CSX in Ohio. For use in Diesel service. Period: 3 months.
- 20, DOT 117J Tanks located off of NS, CSX, CN, or CPKC in various locations. For use in C5 service. Period: 1 year. Need gauge rods.
- 300, 5200CF Covered Hoppers located off of CP or CM in Canada. For use in Petcoke service. Period: 3 Year.
- 10, 30K 117J Tanks located off of BNSF in Canada. For use in Propane or Butane service. Period: 3 Year.
- 20, 28K or larger 117J Tanks located off of BNSF or UP in California. For use in Crude service. Period: 6 months.
- 75, 30K 117 Tanks located off of NS in Ohio. For use in Condensate service. Period: 6-12 Months. Mag Rods Not Needed.
Sales Bids
- 28, 3400CF Covered Hoppers located off of UP or BNSF in Texas. For use in Cement service. Cement Gates needed.
- 20, 17K DOT111 Tanks located off of various class 1s in various locations. For use in corn syrup service.
- 120, Various Open-Top Aluminum Rotary Gondolas located off of various class 1s in various locations. For use in Sulphur service. Built 2004 or later.
Lease Offers
- 21, 6351 Covered Hoppers located off of CN in Wisconsin. Last used in DDG. Available until February 2027.
- 29, 6500 Covered Hoppers located off of CN in Wisconsin. Last used in DDG. Available until February 2027.
- 50, 20K DOT117J Tanks located off of all class 1s in Moving. Last used in styrene.
- 29, 25.5K DOT117J Tanks located off of UP or BNSF in Texas. Cars are currently clean.
- 200, 340W DOT 112J Tanks located off of all class 1s in Multiple Locations. Last used in propane and butane. Cars are currently clean.
- 15, 6200CF Covered Hoppers located off of all class 1s in Wisconsin. Last used in plastic. Cars are currently clean.
- 30, 6500CF Covered Hoppers located off of all class 1s in Wisconsin. Last used in plastic. Cars are currently clean.
- 6, 21K Stainless Steel Tanks located off of UP in Texas / Mexico Border. Last used in surfactant. Cars are currently clean.
- 100, 28.4K DOT 117J Tanks located off of UP or BNSF in Beaumont, TX. Cars are currently clean.
- 50, 30K DOT117J Tanks located off of UP or BNSF in the South. Last used in ethanol.
- 30, 30K DOT 117R Tanks located off of BNSF in Washington. Last used in renewable jet fuel.
- 80, 30K DOT 117R Tanks located off of BNSF in Washington. Last used in renewable diesel.
- 10, 30K DOT 117R Tanks located off of BNSF in Washington. Last used in renewable naphtha.
- 10, 29K DOT 117R Tanks located off of BNSF and UP in Texas. Last used in gasoline additive. Coiled and Insulated.
- 39, 31K CPC1232 Tanks located off of All Class 1s in Iowa. Last used in diesel.
- 99, 31K CPC1232 Tanks located off of BNSF and UP in Texas. Last used in diesel.
- 1, 31K CPC1232 Tanks located off of BNSF and UP in Texas. Last used in naphtha.
- 2, 30K DOT 117R Tanks located off of BNSF and UP in Texas. Last used in giesel.
- 1, 30K DOT 117R Tanks located off of BNSF and UP in Texas. Last used in gas blend stock.
- 3, 30K DOT 117R Tanks located off of BNSF and UP in Texas. Last used in gasoline.
- 36, 31K CPC1232 Tanks located off of CPKC in Texas. Last used in diesel.
- 6, 31K CPC1232 Tanks located off of CPKC in Texas. Last used in naphtha.
Sales Offers
- 81, 31.8K CPC1232 Tanks located off of UP or BNSF in TX. Last used in Multiple Services. Requal Due in 2025.
- 35, 3400CF Covered Hoppers located off of UP or BNSF in the Midwest. Last used in Sand.
- 25, 30K 117J Tanks located off of CSX in Jackson, TN. Last used in Fuels. Newly Requalified.
Call PFL today to discuss your needs and our availability and market reach. Whether you are looking to lease cars, lease out cars, buy cars, or sell cars call PFL today at 239-390-2885
Live Railcar Markets
| CAT | Type | Capacity | GRL | QTY | LOC | Class | Prev. Use | Offer | Note |
|---|
PFL will be at the Following Conferences

- Where: Loews Arlington Hotel
- Attending: Brian Baker (239.297.4519), David Cohen (954-729-4774), and Curtis Chandler (239-405-3365)
- Conference Website

- Where: The Westin Galleria Dallas
- Attending: David Cohen (954-729-4774), and Curtis Chandler (239-405-3365)
- Conference Website

- Where: The Westin Galleria Dallas
- Attending: Brian Baker (239.297.4519)
- Conference Website