
“No man ever steps in the same river twice, for it’s not the same river and he’s not the same man.” – Heraclitus
Jobs Update
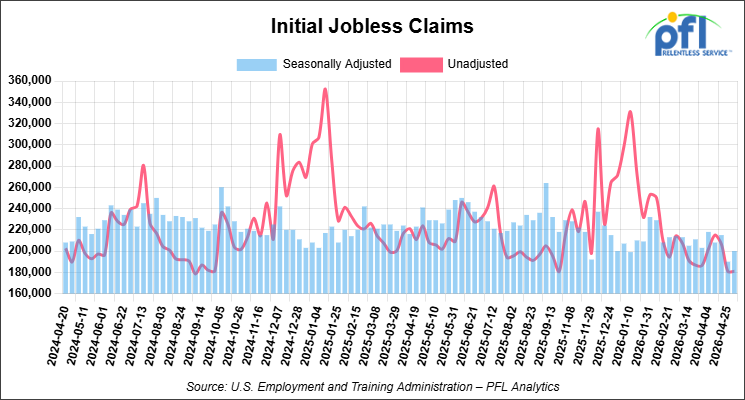
- Initial jobless claims seasonally adjusted for the week ending May 2, 2026 came in at 200,000, versus the adjusted number of 190,000 people from the week prior, up 10,000 people week over week.
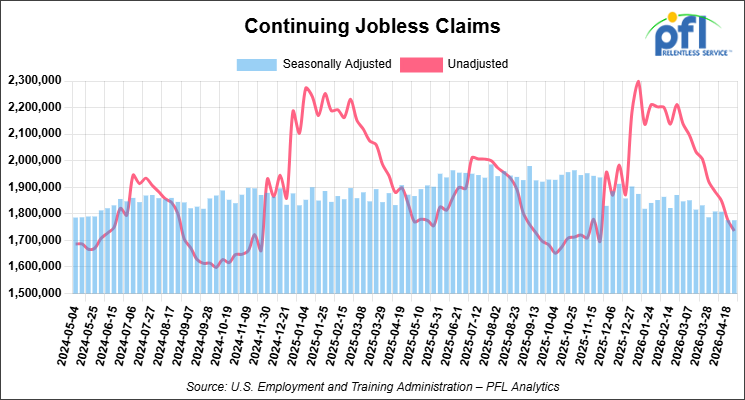
- Continuing jobless claims came in at 1,776,000, versus the adjusted number of 1,776,000 people from the week prior, flat week over week.
Stocks closed higher on Friday of last week and higher week-over-week
The DOW closed higher on Friday of last week, up 12.19 points (0.02%), closing out the week at 49,609.16, up 109.89 points week-over-week. The S&P 500 closed higher on Friday of last week, up 61.82 points (0.84%), and closed out the week at 7,398.93, up 168.81 points week-over-week. The NASDAQ closed higher on Friday of last week, up 440.88 points (1.71%), and closed out the week at 26,247.08, up 1,132.64 points week-over-week.
In overnight trading, DOW futures traded lower and are expected to open at 49,665 this morning, down 26 points from Friday’s close.
Crude oil closed higher on Friday of last week and lower week-over-week
West Texas Intermediate (WTI) crude closed up $0.61 per barrel (0.6%), to close at $95.42 on Friday of last week, but down $6.52 week-over-week. Brent crude closed up $1.23 per barrel (1.2%), to close at $101.29, but down $6.88 week-over-week.
One Exchange WCS (Western Canadian Select) for June delivery settled on Friday of last week at US$15.60 below the WTI-CMA (West Texas Intermediate – Calendar Month Average). The implied value was US$74.22 per barrel.
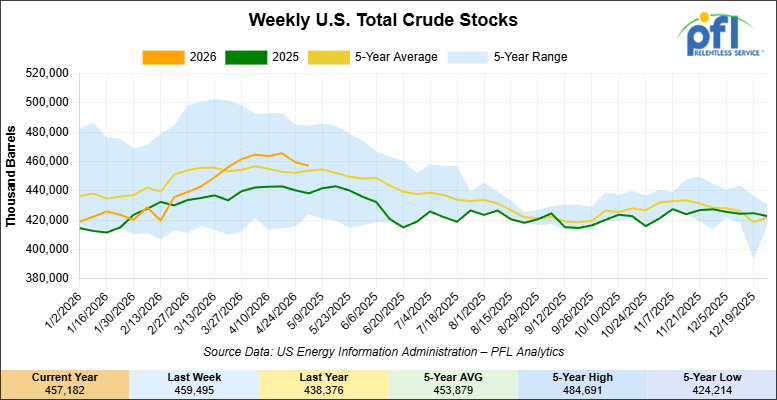
U.S. commercial crude oil inventories (excluding those in the Strategic Petroleum Reserve) decreased by 2.3 million barrels week-over-week. At 457.2 million barrels, U.S. crude oil inventories are 1% above the five-year average for this time of year.
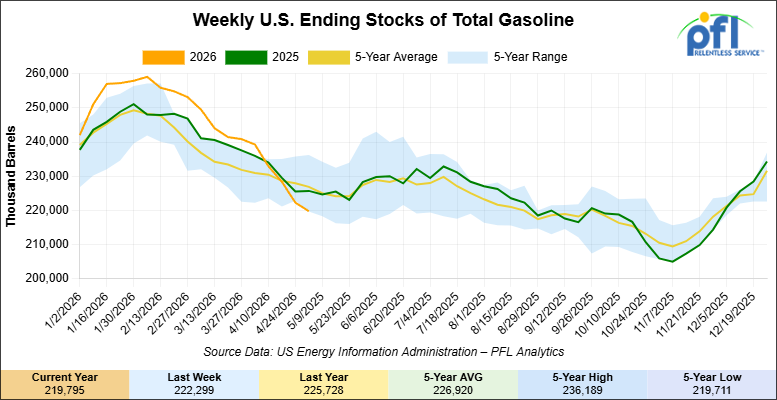
Total motor gasoline inventories decreased by 2.5 million barrels week-over-week and are 4% below the five-year average for this time of year.
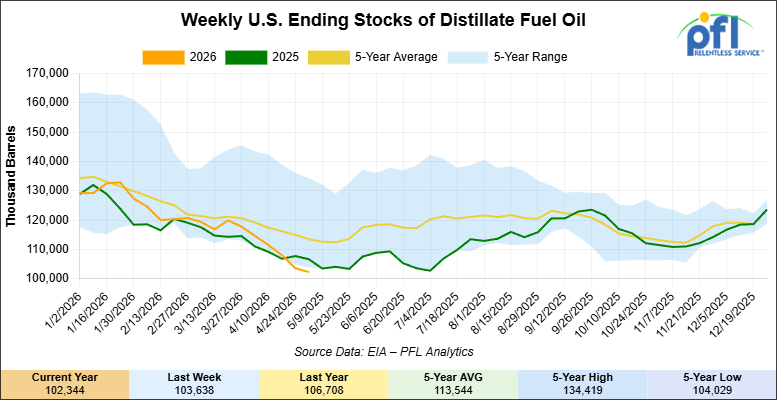
Distillate fuel inventories decreased by 1.3 million barrels week-over-week and are 11% below the five-year average for this time of year.
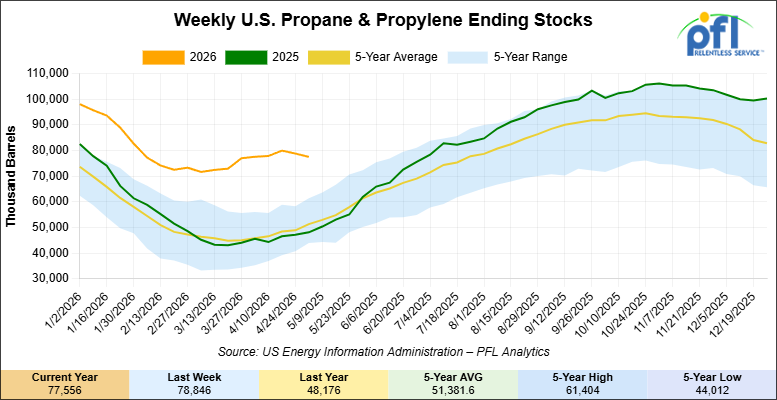
Propane/propylene inventories decreased by 1.3 million barrels week-over-week and are 56% above the five-year average for this time of year.
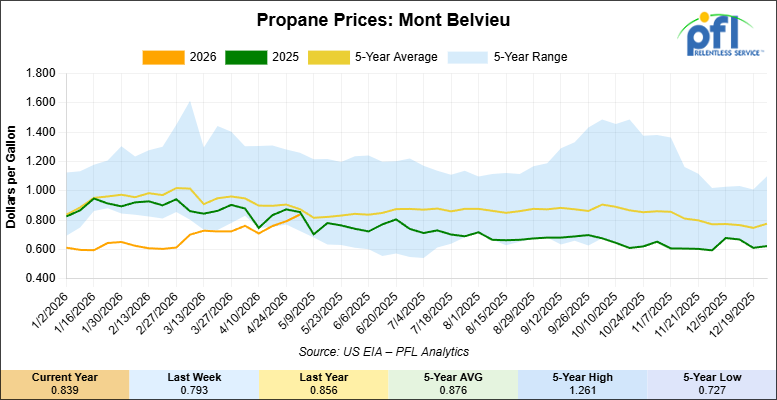
Propane prices closed at 83.9 cents per gallon on Friday of last week, up 4.6 cents per gallon week-over-week, but down 1.7 cents per gallon year-over-year.
Overall, total commercial petroleum inventories decreased by 5.9 million barrels week-over-week during the week ending May 1, 2026.
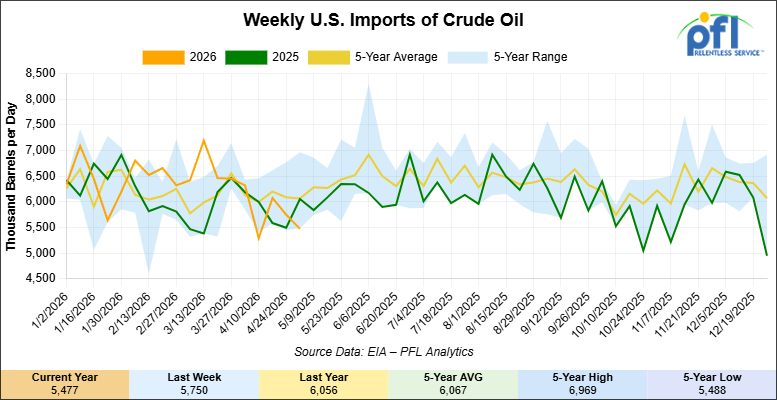
U.S. crude oil imports averaged 5.5 million barrels per day during the week ending May 1, 2026, a decrease of 273,000 barrels per day week-over-week. Over the past four weeks, crude oil imports averaged 5.6 million barrels per day, 2.4% less than the same four-week period last year. Total motor gasoline imports (including both finished gasoline and gasoline blending components) averaged 755,000 barrels per day, and distillate fuel imports averaged 123,000 barrels per day during the week ending May 1, 2026.
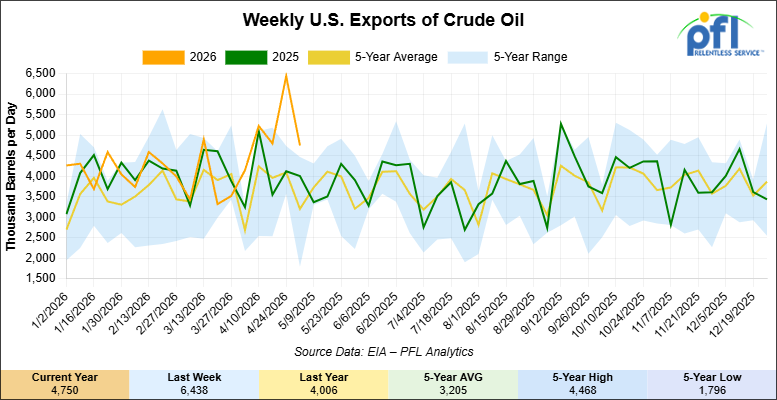
U.S. crude oil exports averaged 4.75 million barrels per day during the week ending May 1, 2026, a decrease of 1.688 million barrels per day week-over-week. Over the past four weeks, crude oil exports averaged 5.303 million barrels per day.
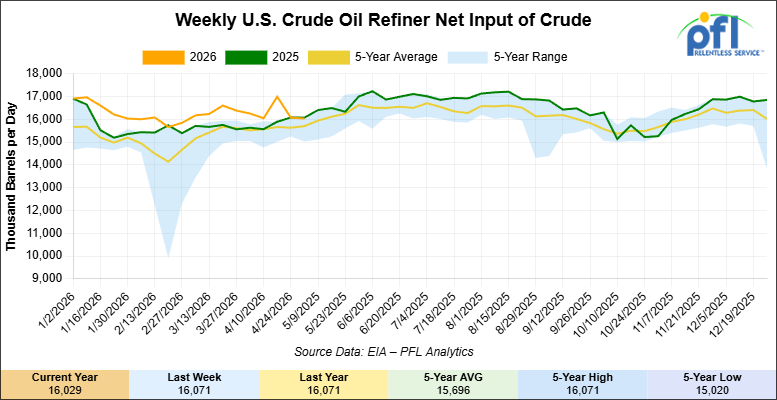
U.S. crude oil refinery inputs averaged 16 million barrels per day during the week ending May 1, 2026, which was 42,000 barrels per day less week-over-week.
WTI is poised to open at $97.69, up $2.27 per barrel from Friday’s close.
North American Rail Traffic
Week Ending May 6, 2026:
Total North American weekly rail volumes were up (+3.37%) in week 19, compared with the same week last year. Total Carloads for the week ending May 6, 2026 were 341,370, up (+3.95%) compared with the same week in 2025, while weekly Intermodal volume was 344,184, up (+2.81%) year over year. 9 of the AAR’s 11 major traffic categories posted year-over-year increases. The largest decrease came from Forest Products (-12.25%). The largest increase was Grain (+14.93%).
In the East, CSX’s total volumes were up (+4.74%), with the largest decrease coming from Motor Vehicles and Parts (-3.40%), while the largest increase came from Other (+21.65%). NS’s total volumes were up (+4.01%), with the largest increase coming from Petroleum & Petroleum Products (+28.92%), while the largest decrease came from Grain (-5.23%).
In the West, BNSF’s total volumes were up (+7.49%), with the largest increase coming from Metallic Ores and Metals (+24.76%), while the largest decrease came from Chemicals (-11.03%). UP’s total volumes were up (+1.67%), with the largest increase coming from Nonmetallic Minerals (+20.33%), while the largest decrease came from Coal (-24.21%).
In Canada, CN’s total volumes were up (+4.58%), with the largest increase coming from Coal (+24.18%), while the largest decrease came from Other (-25.86%). CPKCS’s total volumes were down (-16.61%), with the largest increase coming from Nonmetallic Minerals (+17.28%), while the largest decrease came from Forest Products (-69.25%).
Source Data: AAR – PFL Analytics
North American Rig Count Summary
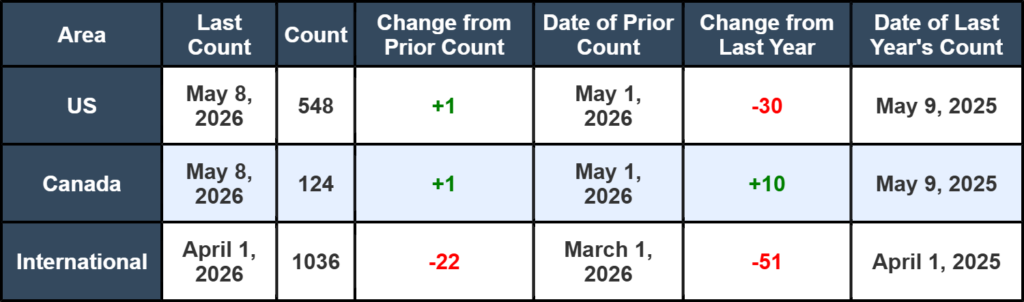
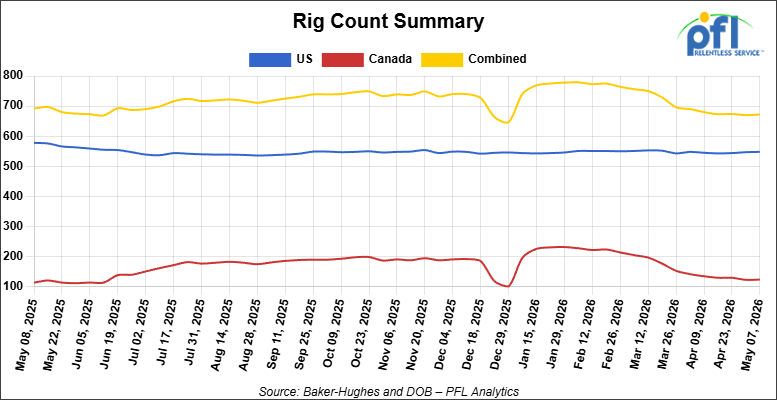
North American rig count was up by +2 rigs week-over-week. The US rig count was up by +1 rig week-over-week, but down by -30 rigs year-over-year. The US currently has 548 active rigs. Canada’s rig count was up by +1 rig week-over-week and up by +10 rigs year-over-year. Canada currently has 124 active rigs. Overall, year-over-year we are down by -20 rigs collectively.
We are watching a few things out there for you:
We are Watching Petroleum Carloads
The four-week rolling average of petroleum carloads carried on the six largest North American railroads fell to 28,820 from 28,934 which was a decrease of -114 rail cars week-over-week. Canadian volumes were mixed. CN’s shipments were lower by -5.0% week-over-week, CPKC’s volumes were higher by +7.0% week-over-week. U.S. shipments were also mix. The NS had the largest percentage decrease and was down by -10.0%. The CSX had the largest percentage increase and was up by +11.0% week-over-week.
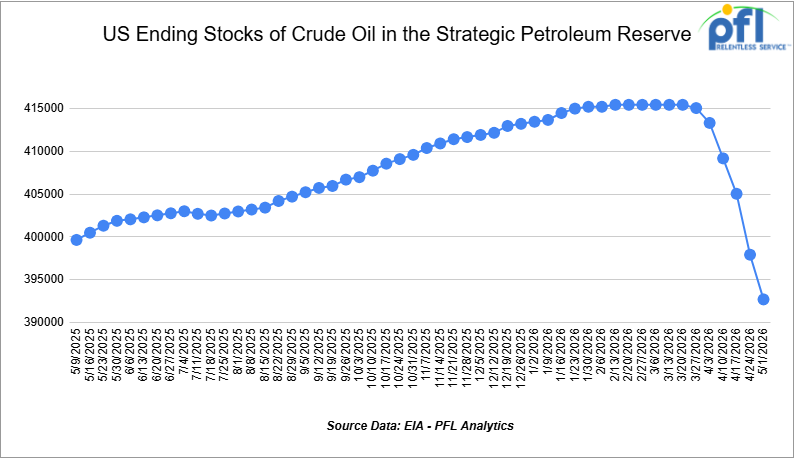
We Continue to watch our Strategic Petroleum Reserves
The Strategic Petroleum Reserve (SPR) declined from 415.442 million barrels reported on March 20, 2026, to 392.700 million barrels reported on May 1, 2026, representing a total drawdown of approximately 22.742 million barrels over the six-week period. Current inventory levels are now approaching the late-2024 low of 392.531 million barrels reported in December 2024. The recent decline equates to an average release rate of roughly 3.79 million barrels per week, a draw down of approximately 542,000 barrels per day, as strategic reserves continue supplementing global crude supplies amid disruptions tied to the Strait of Hormuz crisis.
The Trump Administration announced plans to begin refilling the SPR shortly after taking office in January 2025 after the Biden Administration drew down our reserves to depress gas prices ahead of the Presidential election. Meaningful replenishment efforts did not begin until late 2025, when the Department of Energy awarded contracts for crude oil deliveries into the reserve. Refill activity remained gradual due to funding limitations and ongoing maintenance at SPR storage sites before renewed emergency drawdowns tied to Middle East supply disruptions began in March 2026.
From December 2024 to March 20, 2026 the Strategic Petroleum Reserve increased by approximately 22.9 million barrels before the recent Hormuz-related supply disruptions reversed much of those gains. If you are worried about running out of crude in the nation’s reserves – don’t worry, we will not run out at the current draw rates until sometime in 2028.
We Are Watching Cenovus
Cenovus President and Chief Executive Jon McKenzie, had some strong words on the company’s first quarter earnings call on Thursday of last week directed toward Canadian Prime Minister Mark Caney’s left wing Liberal Government. The current geopolitical environment, with Hormuz still effectively closed and global refiners scrambling for supply, presents Canada with another window to grow oilsands production. McKenzie said that window is being put at risk by Ottawa. “The national dialogue on further development of the oilsands has been myopically focused on the climate agenda and climate policy and has ignored a multitude of benefits that responsible oilsands development has brought to this country.”
It is rare to see a sitting Canadian oilsands chief executive speak this directly about federal energy policy. McKenzie tied the criticism to competitiveness, noting the world needs affordable, abundant, reliable energy from all sources, and that Canada is at risk of squandering a generational opportunity while customers in China and India are knocking on the door. The Carney government has done nothing material on the major projects file since the November carbon pricing reset, and the West Coast pipeline corridor remains a press release rather than a project.
The cost of policy drift is now showing up in capital budgets. Canadian Natural Resources trimmed its 2026 capital spending by C$310 million by deferring engineering work on the C$8.25 billion Jackpine mine expansion, citing “a lack of finalization relating to carbon pricing and methane” that “creates uncertainty and economic burden for long-term growth investments.” That is real Canadian capital sitting on the sidelines waiting for federal clarity. For the rail car industry, the takeaway is straightforward. At some point in the not so distant future rail may just make up this short fall in pipe capacity but involves long term commitments from producers – industry and refiners south of the border.
We Are Watching the Enbridge
Enbridge moved 3.17 million barrels per day on the Mainline in the first quarter, the highest level since the fourth quarter of 2023. The company also rejected 14% of heavy crude nominations for May flow, a clear signal that the system is full. Mainline Optimization Phase 1 will add 150,000 barrels per day in 2027, Phase 2 adds another 250,000 barrels per day by 2028, and the Express system gains 30,000 barrels per day on top of that. None of those barrels arrive in time to relieve current apportionment.
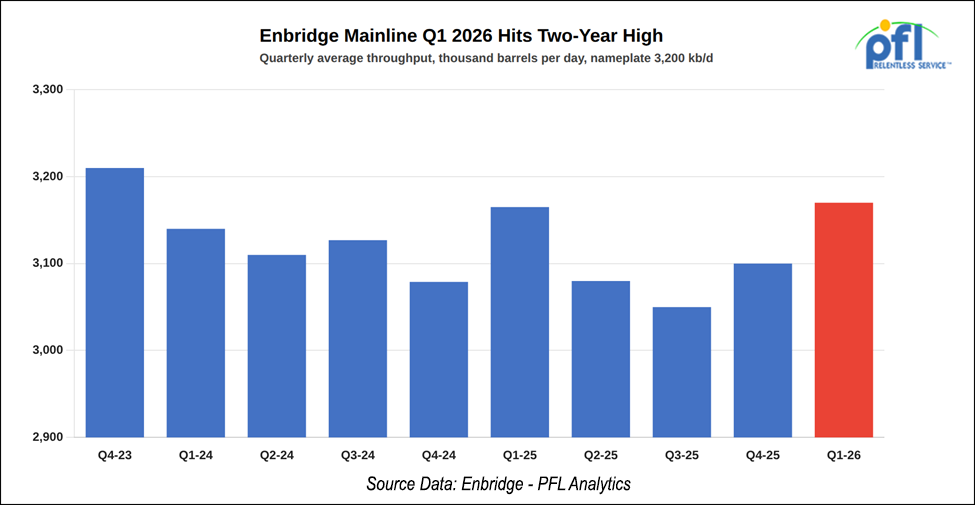
On the diluent side, the Canada Energy Regulator approved Enbridge’s request to expand Southern Lights on Tuesday of last week, lifting capacity from 198,000 to 240,000 barrels per day. More diluent flowing north into Edmonton is a leading indicator of more diluted bitumen flowing south. Enbridge said the request was driven directly by customer demand for imported condensate, and the company expects no system modifications to support the higher capacity. The 21% expansion follows last year’s bump from 180,000 to 198,000 barrels per day, meaning Southern Lights capacity has grown by a third in less than 18 months.
We Are Watching US Crude Exports
U.S. crude exports hit an all-time monthly high of 5.1 million barrels per day in April, up more than 30% from March. The EIA weekly series topped out at 6.4 million barrels per day for the week ended April 24. Most of the surge was a relief valve for European refiners scrambling to replace Middle East Production. This is an inventory drawdown, not a supply response.
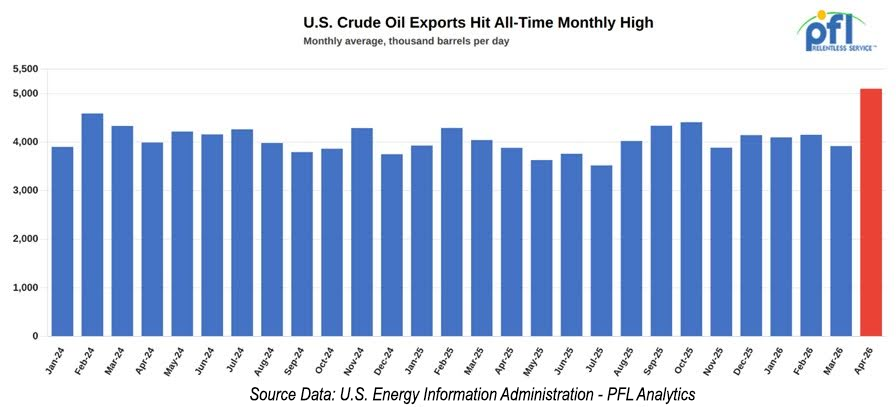
However, infrastructure responses are starting to show. On Tuesday of last week, Sentinel Midstream said it has cleared its final federal approvals for Texas GulfLink, an offshore terminal 30 miles west of Freeport that can fully load a 2-million-barrel VLCC per day. Construction will start immediately and commercial operations target the fourth quarter of 2028. The project is being underpinned by ¥330 billion (about $2.1 billion) in Japanese funding committed under the July 2025 trade deal. GulfLink is the only one of four proposed US offshore VLCC terminals to actually break ground. Enterprise’s competing SPOT permit is sitting unsanctioned because the company has cited anemic shipper interest. The Iran war has solved Sentinel’s anchor shipper problem.
Gibson Energy guided to record throughputs at South Texas Gateway in the second quarter, pushing 1 million barrels per day in May and June. Chief executive Curtis Philippon said “virtually all” customers are exercising their guaranteed loading windows. The Wink-to-Gateway integration coming online in the third quarter will let Permian and Eagle Ford volumes flow concurrently into the dock. None of this throughput is moving by rail, but every additional pipeline barrel pulled south puts more pressure on the egress puzzle in Western Canada and the Bakken. The Permian is sucking U.S. crude pipelines south. That is constructive for the rail option further north.
We Are Watching Butane
U.S. butane exports hit an all-time monthly high of 689,000 barrels per day, or 1.9 million tonnes, in April. That blew past the previous record set in May 2025 during the China trade rerouting. Mont Belvieu butane prices climbed to a 15-month high last Tuesday at 122.375 cents per gallon, the highest mark since January 2025. The Hormuz blockade is trapping roughly 30% of global LPG supply, and Asian buyers have pivoted hard to U.S. butane as the alternative to Middle Eastern butane-heavy cargoes.
India was the biggest buyer in April at 247,000 tonnes, with Morocco at 231,000, China at 162,000, and Korea at 134,000. The pivot is showing up in spot economics. Mideast LPG cargoes are split roughly evenly between propane and butane, while US export terminals are configured to load mostly propane. The result is that spot terminal fees for split cargoes are now sitting at a 10-cent-per-gallon or larger premium to full propane loadings, even with global supplies of both products tight. EPA also issued a national Reid vapor pressure waiver in March allowing higher-volatility summer gasoline, which is propping up domestic butane blend demand at the same time export demand is screaming.
Targa flagged on its earnings call last week that it expects record LPG exports in the second quarter driven by butane-heavy loads, with Galena Park back to full operation after its March compressor outage. The 175,000 barrel per day terminal is undergoing an expansion that will lift capacity to 625,000 barrels per day in the third quarter of 2027. Pressure car demand at midstream loading hubs and inland origin points is moving with this. Anyone who has tried to source pressure cars on short notice over the past year already knows the answer. PFL works with the operators that have the cars, the lease structure, and the visibility into where the equipment actually is. Call PFL at 239-390-2885 if you have LPG moves coming up that need fleet attention.
We Are Watching Heavy Haul
The energy buildout underway across the U.S. is creating a real shortage of the specialized rail equipment needed to move the heavy components into it. LNG export terminals, natural gas power plants, data centers, and grid upgrades all share the same problem: they require power transformers, gas turbines, heat exchangers, and pressure vessels that cannot move on a standard flatcar. Heavy depressed-center cars and Schnabel cars are the answer, and the pool is small.
Power transformers are the tightest piece of the puzzle. Manufacturing lead times run in years, not months, and the cars that haul them are being booked months in advance. The Hormuz disruption has accelerated U.S. LNG project timelines, which has accelerated demand for project cargo equipment, which has tightened an already tight specialty fleet. Contractors on these projects are being told to lock in heavy-haul rail equipment at the engineering stage rather than waiting for the equipment to arrive at the plant gate.
Some shippers caught short have started turning to truck and barge to fill the gaps. That works on certain lanes for certain components. It does not work for a 400-tonne transformer. The projects driving the demand are not slowing down, and the equipment to move them does not get built on a quarterly cycle. For the broader rail car market, the heavy-haul squeeze is a useful reminder that capacity discipline cuts both ways. Specialty fleets that took years to build cannot be replaced in months when demand turns. PFL is watching this one closely and willing to work with shippers that require speciality designs.
We Are Watching the Surface Transportation Board
The Surface Transportation Board on Friday of last week finalized rules requiring the six largest North American Class I railroads to publish two new weekly service metrics starting July 1. The first measures original estimated time of arrival, or OETA, flagging the percentage of weekly shipments that reach destination no later than 24 hours after the carrier’s own dispatch target. The second tracks the carrier’s success at picking up and dropping off cars at origin and destination, the so-called “spots and pulls” metric. The board first put the industry on notice it was coming in September, and it landed largely as expected.
The rules apply to manifest service only. Unit trains and intermodal are exempt, which is the right call given those flows already run on dedicated cycles. The STB framed the move as an effort to address shipper complaints that unpredictable rail service has become a wild card in supply chains, and the board noted Class I carriers already track most of the underlying data internally. The compliance burden should be modest. The transparency burden is another matter.
The shippers that have been quietly maintaining oversized private fleets to absorb Class I service variability now have data they can put on the table in rate negotiations. Carriers that have been performing inconsistently on manifest service are about to find out what that looks like in print. In our opinion, this is a meaningful win for shippers and a small but real check on Class I service drift, and it lands as the UP-NS proceeding is forcing the same competition questions back into the open. PFL is seeing velocity increasing especially for unit car train service. PFL will be watching the first OETA reports in July with interest – stay tuned to PFL for further updates.
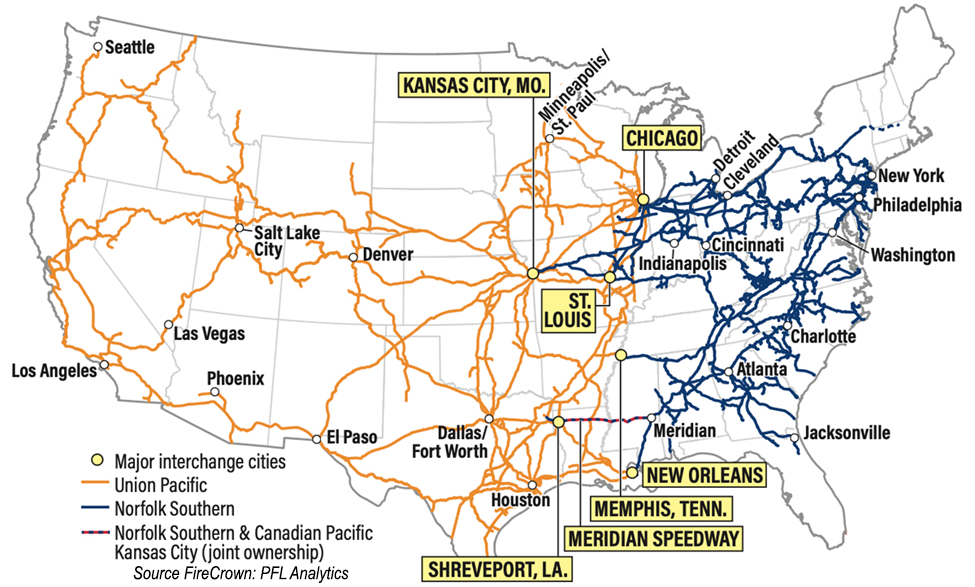
We Are Watching the UP and NS
The comment window on the revised UP-NS merger application has closed. UP and NS now have until tomorrow (May 12) to respond, after which the STB has 30 days to decide whether the application is complete. The walk-away clause that triggered the original rejection is now in the public record. UP will tolerate up to $750 million in conditions imposed by the STB before the deal can be reconsidered, and pulling out triggers a $2.5 billion breakup fee owed to Norfolk Southern. The only structural condition UP has signaled it will accept is a divestiture of one of the two duplicate Kansas City to St. Louis routes.
If the STB rules the application complete, the substantive review is expected to run well into 2027, against a hard merger deadline of January 28, 2028. Stop the Rail Merger Coalition members filed extensively into the comment window and are expected to push hard on trackage rights and divestiture conditions that UP has already said it will not accept. The board now has to decide whether to approve a deal on UP’s terms, or push for the kind of conditions that put the $2.5 billion breakup fee in play. PFL continues to track this one closely.
We Are Watching Key Economic Indicators
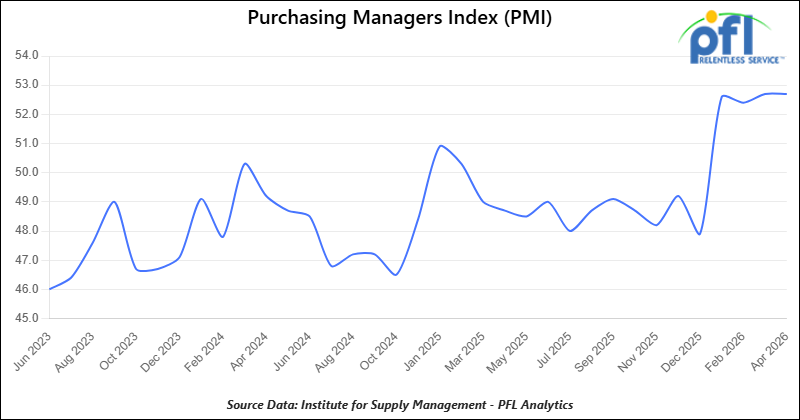
Purchasing Manager Index (“PMI”)
The Institute for Supply Management (ISM) releases two PMI reports – one covering manufacturing and the other covering services. These reports are based on surveys of supply managers across the country and track changes in business activity. A reading above 50% on the index indicates expansion, while a reading below 50% signifies contraction, with a faster pace of change the farther the reading is from 50.
The Manufacturing PMI in April 2026 was 52.7%, unchanged from March’s 52.7% reading and marking the fourth consecutive month in expansion territory following an extended period of contraction. Manufacturing activity continued to be supported by growth in new orders and production, although employment remained in contraction territory.
On the Services PMI side, the most recent reading is 53.6% (April 2026), down slightly from 54.0% in March but still indicating continued expansion in the services sector. Business activity remained solid, though new orders slowed compared to the prior month.
Lease Bids
- 100, 21.9K 117J Tanks located off of All Class 1s in Midwest. For use in CO2 service. Period: 6 months.
- 30-50, 30K 117J Tanks located off of NS or CSX in Northeast. For use in C5 service. Period: 1 year.
- 20-50, 4000-5000 Covered Hoppers located off of UP or BN in Houston. For use in Urea, Potash, Ammonium Sulfate service. Period: 6-12 Months.
- 200, 33K Pressure Tanks located off of CSX or NS in Ohio. For use in Propylene service. Period: 18 Months.
- 30-50, 25.5K DOT 111 Tanks located off of All Class 1s in Anywhere. For use in Asphalt service. Period: 1-3 Years.
- 40, 33K Pressure Tanks located off of UP in Eunice, LA. For use in Propane service. Period: 1 Year.
- 40, 29K DOT 111 Tanks located off of UP or BN in Midwest. For use in Veg Oil service. Period: 5 Year.
- 70, 30K DOT 117 Tanks located off of NS or CSX in Ohio. For use in Diesel service. Period: 3 months.
- 100, 33K Pressure Tanks located off of UP or BN in Texas. For use in Propane service. Period: 6 Months.
- 20, DOT 117J Tanks located off of NS, CSX, CN, or CPKC in Various. For use in C5 service. Period: 1 year. Need gauge rods.
- 50, 30K DOT 117J Tanks located off of CP or CN in Canada. For use in Jet Fuel service. Period: 1 Year.
Sales Bids
- 28, 3400CF Covered Hoppers located off of UP BN in Texas. For use in Cement service. Cement Gates needed.
- 20, 17K DOT111 Tanks located off of various class 1s in various locations. For use in corn syrup service.
- 120, Various Open-Top Aluminum Rotary Gondolas located off of various class 1s in various locations. For use in Sulphur service. Built 2004 or later.
- 30, 29K DOT111 Tanks located off of various class 1s in Chicago. For use in Veg Oil service.
Lease Offers
- 106, 31.8K CPC1232 Tanks located off of UP or BN in Texas. Last used in Diesel.
- 20, 31.8K DOT117R Tanks located off of UP or BN in Texas. Last used in Diesel.
- 86, 29K DOT117R Tanks located off of UP or BN in Texas. Last used in Gasoline. Coiled and Insulated.
- 21, 6351 Covered Hoppers located off of CN in Wisconsin. Last used in DDG. Available until February 2027.
- 29, 6500 Covered Hoppers located off of CN in Wisconsin. Last used in DDG. Available until February 2027.
- 50, 20K DOT117J Tanks located off of All Class 1s in Moving. Last used in Styrene.
- 29, 25.5K DOT117J Tanks located off of UP or BN in Texas. Cars are currently clean. Cars are currently clean.
- 50, 30K DOT117J Tanks located off of UP or BN in Corpus Christie. Last used in Diesel.
- 200, 340W DOT 112J Tanks located off of All Class 1s in Multiple Locations. Last used in Propane and Butane. Cars are currently clean.
- 15, 6200CF Covered Hoppers located off of All Class 1s in Wisconsin. Last used in Plastic. Cars are currently clean.
- 30, 6500CF Covered Hoppers located off of All Class 1s in Wisconsin. Last used in Plastic. Cars are currently clean.
- 24, 21K Stainless Steel Tanks located off of UP in Texas / Mexico Border. Last used in SULFACTANT. Cars are currently clean.
- 34, 30K DOT 111 Tanks located off of UP in Texas / Mexico Border. Last used in Veg Oil. Cars are currently clean.
- 117, 30K DOT117R Tanks located off of UP or BN in Texas. Last used in Gasoline.
- 100, 28.4K DOT 117J Tanks located off of UP or BN in Beaumont, TX. Cars are currently clean.
- 50, 30K DOT117J Tanks located off of UP or BN in the South. Last used in Ethanol.
Sales Offers
- 81, 31.8K CPC1232 Tanks located off of UP or BN in TX. Last used in Multiple. Requal Due in 2025.
- 35, 3400CF Covered Hoppers located off of UP or BN in Midwest. Last used in Sand.
- 25, 30K 117J Tanks located off of CSX in Jackson, TN. Last used in Fuels. Newly Requalified.
Call PFL today to discuss your needs and our availability and market reach. Whether you are looking to lease cars, lease out cars, buy cars, or sell cars call PFL today at 239-390-2885
Live Railcar Markets
| CAT | Type | Capacity | GRL | QTY | LOC | Class | Prev. Use | Offer | Note |
|---|
PFL will be at the Following Conferences

- Where: Loews Arlington Hotel
- Attending: Brian Baker (239.297.4519), David Cohen (954-729-4774), and Curtis Chandler (239-405-3365)
- Conference Website

- Where: The Westin Galleria Dallas
- Attending: David Cohen (954-729-4774), and Curtis Chandler (239-405-3365)
- Conference Website

- Where: The Westin Galleria Dallas
- Attending: Brian Baker (239.297.4519)
- Conference Website