
“Ability is what you’re capable of doing. Motivation determines what you do. Attitude determines how well you do it.” – Lou Holtz
Jobs Update
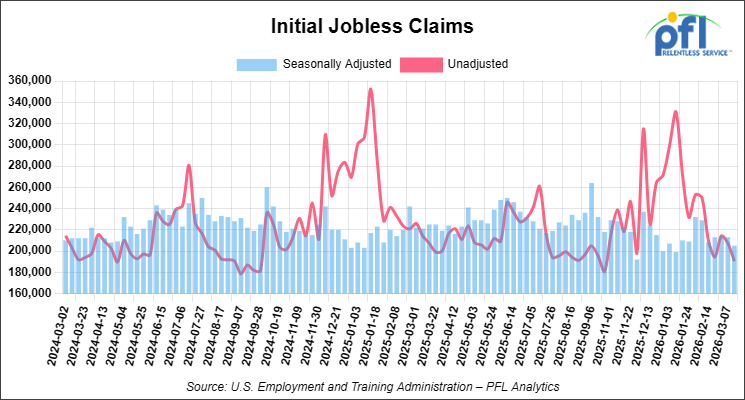
- Initial jobless claims seasonally adjusted for the week ending March 14, 2026 came in at 205,000, versus the adjusted number of 213,000 people from the week prior, down 8,000 people week over week.
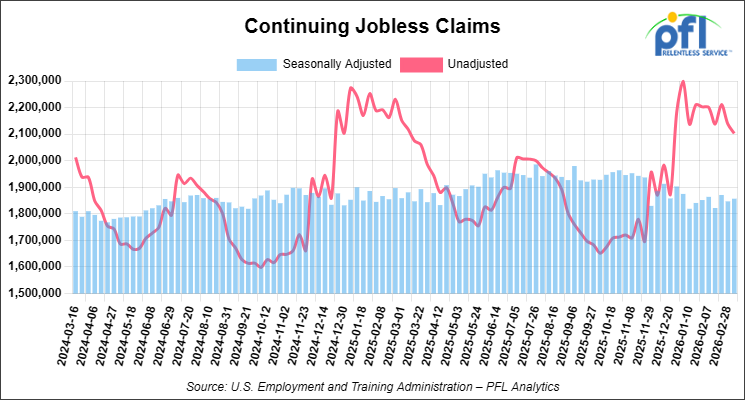
- Continuing jobless claims came in at 1,857,000, versus the adjusted number of 1,847,000 people from the week prior, up 10,000 week-over-week.
Stocks closed lower on Friday of last week and lower week-over-week
The DOW closed lower on Friday of last week, down -443.96 points (-0.96%), closing out the week at 45,577.47, down -981.00 points week-over-week. The S&P 500 closed lower on Friday of last week, down -100.01 points (-1.51%), and closed out the week at 6,506.48, down -125.71 points week-over-week. The NASDAQ closed lower on Friday of last week, down -443.08 points (-2.01%), and closed out the week at 21,647.61, down -457.75 points week-over-week.
In overnight trading, DOW futures traded lower and are expected to open at 45,581 this morning, down 321 points from Friday’s close.
Crude oil closed higher on Friday of last week and mixed week-over-week
West Texas Intermediate (WTI) crude closed up $2.18 per barrel (2.27%), to close at $98.32 on Friday of last week, and down $0.39 week-over-week. Brent crude closed up 3.54 per barrel (3.26%), to close at $112.19, and up $9.05 week-over-week.
One Exchange WCS (Western Canadian Select) for May delivery settled on Friday of last week at US$11.60 below the WTI-CMA (West Texas Intermediate – Calendar Month Average). The implied value was US$80.36 per barrel.
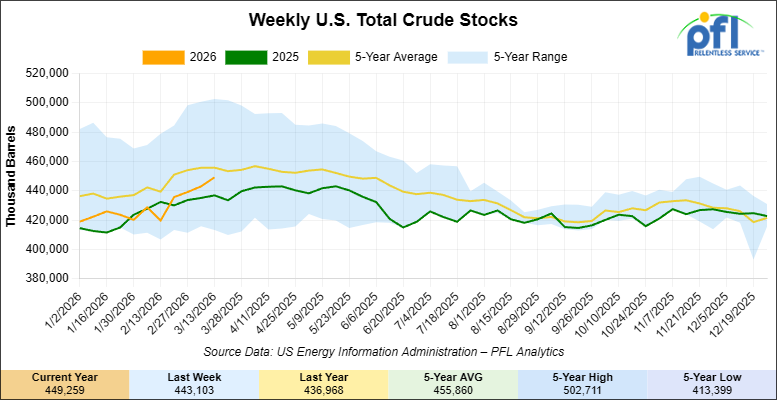
U.S. commercial crude oil inventories (excluding those in the Strategic Petroleum Reserve) increased by 6.2 million barrels week-over-week. At 449.3 million barrels, U.S. crude oil inventories are 1% below the five-year average for this time of year.
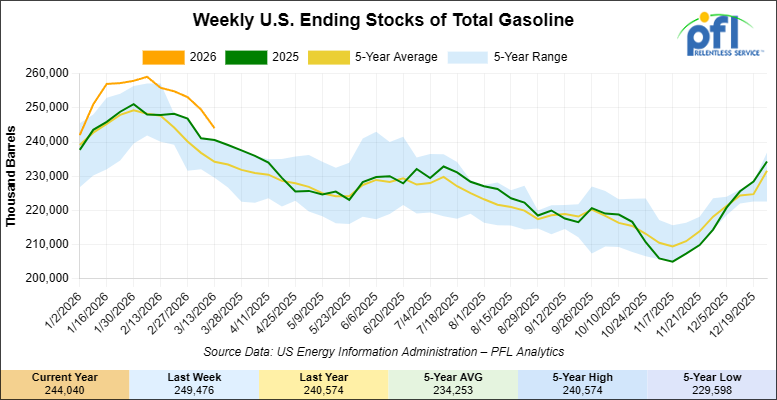
Total motor gasoline inventories decreased by 5.4 million barrels week-over-week and are 3% above the five-year average for this time of year.
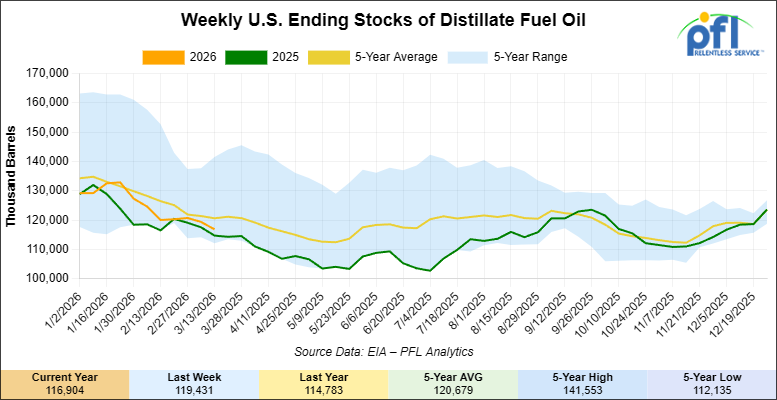
Distillate fuel inventories decreased by 2.5 million barrels week-over-week and are 3% below the five-year average for this time of year.
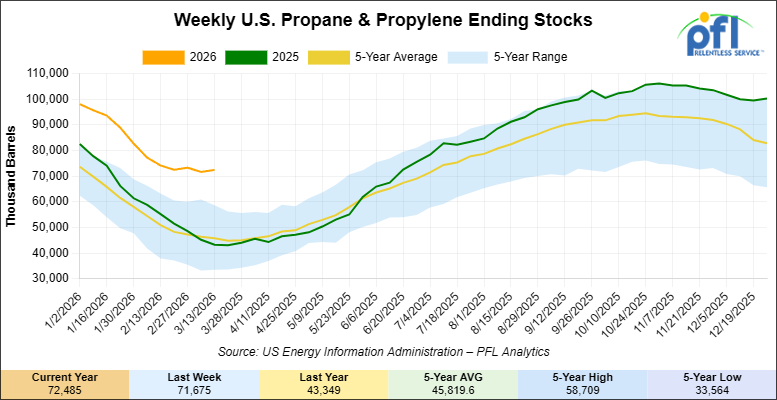
Propane/propylene inventories increased by 800,000 barrels week-over-week and are 57% above the five-year average for this time of year.
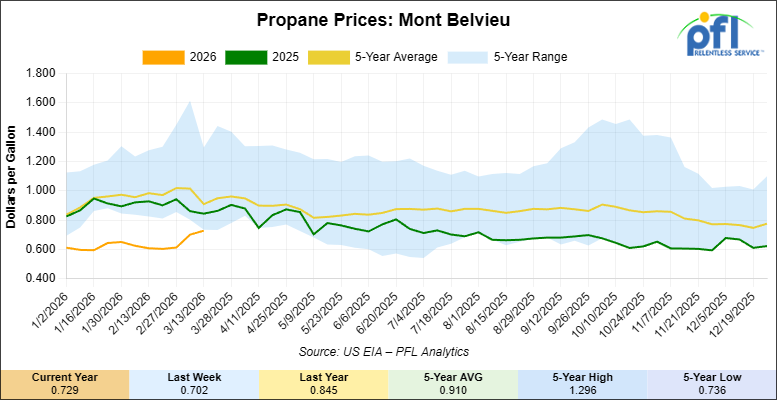
Propane prices closed at 72.9 cents per gallon on Friday of last week, up 2.7 cents per gallon week-over-week, but down 11.6 cents year-over-year.
Overall, total commercial petroleum inventories increased by 400,000 barrels week-over-week, during the week ending March 13, 2026.
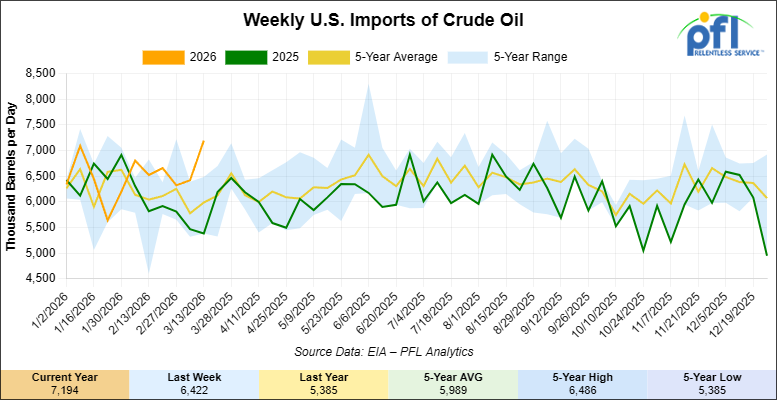
U.S. crude oil imports averaged 7.2 million barrels per day during the week ending March 13, 2026, an increase of 772,000 barrels per day week-over-week. Over the past four weeks, crude oil imports averaged 6.7 million barrels per day, 17.8% more than the same four-week period last year. Total motor gasoline imports (including both finished gasoline and gasoline blending components) averaged 447,000 barrels per day, and distillate fuel imports averaged 221,000 barrels per day during the week ending March 13 2026.
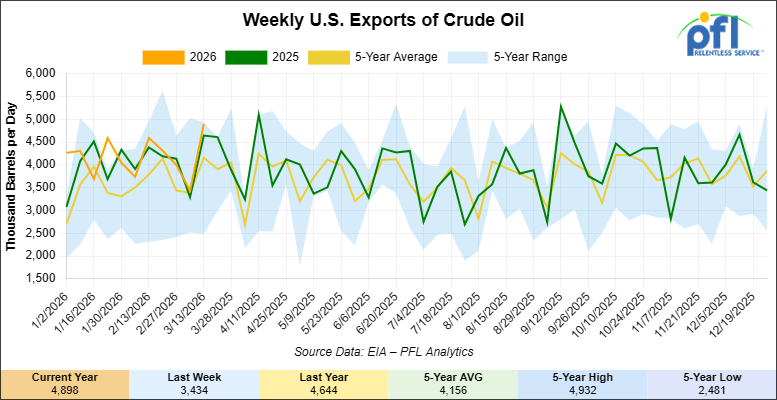
U.S. crude oil exports averaged 4.898 million barrels per day during the week ending March 13, 2026, an increase of 1.464 million barrels per day week-over-week. Over the past four weeks, crude oil exports averaged 4.161 million barrels per day.
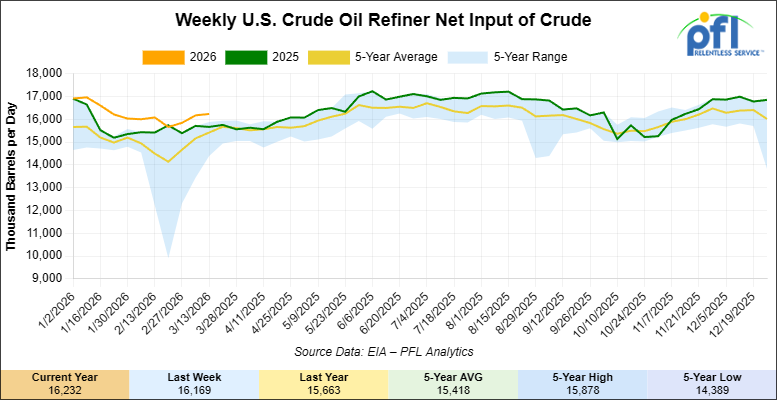
U.S. crude oil refinery inputs averaged 16.2 million barrels per day during the week ending March 13, 2026, which was 63,000 barrels per day more week-over-week.
WTI is poised to open at $99.09 this morning, up 86 cents from Friday’s close.
North American Rail Traffic
Week Ending March 18, 2026:
Total North American weekly rail volumes were down (-0.67%) in week 12, compared with the same week last year. Total Carloads for the week ending March 18, 2026 were 335,313, up (+0.45%) compared with the same week in 2025, while weekly Intermodal volume was 337,419, down (-1.76%) year over year. 7 of the AAR’s 11 major traffic categories posted year-over-year increases. The largest decrease came from Forest Products (-22.77%). The largest increase was Grain (+16.88%).
In the East, CSX’s total volumes were up (+2.55%), with the largest decrease coming from Forest Products (-13.26%), while the largest increase came from Other (+21.60%). NS’s total volumes were up (+1.53%), with the largest increase coming from Petroleum & Petroleum Products (+42.27%), while the largest decrease came from Forest Products (-12.58%).
In the West, BNSF’s total volumes were up (+1.72%), with the largest increase coming from Grain (+23.83%), while the largest decrease came from Metallic Ores and Metals (-16.18%). UP’s total volumes were up (+0.23%), with the largest increase coming from Other (+26.25%), while the largest decrease came from Metallic Ores and Metals (-13.77%).
In Canada, CN’s total volumes were down (-4.20%), with the largest increase coming from Grain (+46.34%), while the largest decrease came from Intermodal Units (-13.93%). CPKCS’s total volumes were down (-28.39%), with the largest increase coming from Other (+1.25%), while the largest decrease came from Forest Products (-73.39%).
Source Data: AAR – PFL Analytics
North American Rig Count Summary
Rig Count
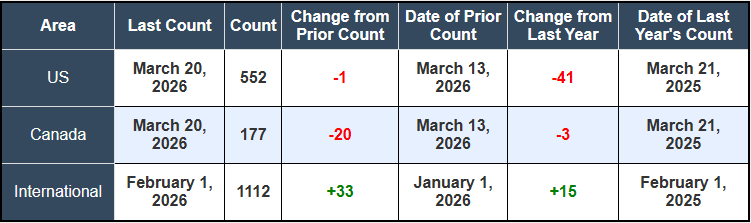
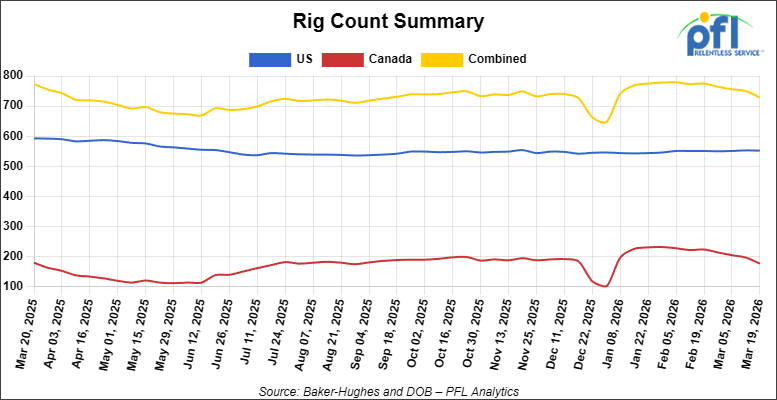
North American rig count was down by -21 rigs week-over-week. The U.S. rig count was down by -1 rig week-over-week, and down by -41 rigs year-over-year. The U.S. currently has 552 active rigs. Canada’s rig count was down by -20 rigs week-over-week and down by -3 rigs year-over-year. Canada currently has 177 active rigs. Overall, year-over-year we are down by -44 rigs collectively.
We are watching a few things out there for you:
We are Watching Petroleum Carloads
The four-week rolling average of petroleum carloads carried on the six largest North American railroads fell to 29,988 from 30,502 which was a decrease of -514 rail cars week-over-week. Canadian volumes were lower. CN’s shipments were lower by -2% week-over-week, CPKC’s volumes were lower by -8.0% week-over-week. U.S. shipments were mostly lower. The CSX had the largest percentage decrease and was down by -8.0%. The NS was the sole gainer and was up by +10% week-over-week.
PFL Was in attendance at last weeks SWARS Conference
Last week was the Southwest Association of Rail Shippers (SWARS) conference in Houston, Texas which brought together a strong cross-section of the rail industry — from Class I railroads to shippers across the energy, chemical, and industrial sectors. 950 of the over 1,200 registered showed up for the event, with many experiencing flight delays for a variety of reasons.
The conference continues to be a valuable forum for shippers to hear directly from railroad leadership and industry experts on the current state of the market. Discussions throughout the week touched on network performance, service consistency, infrastructure investment, and how the railroads are positioning themselves to handle evolving demand across key commodities.
A common theme was the ongoing push for efficiency and visibility across the supply chain. Shippers are looking for more predictability, while railroads are focused on optimizing network fluidity and asset utilization. There was also meaningful dialogue around safety initiatives and the regulatory landscape, both of which remain top priorities across the industry.
Beyond the presentations, SWARS continues to stand out as a place where real conversations and deals happen. It provides an opportunity to connect face-to-face, exchange perspectives, and better understand the challenges and opportunities each side of the industry is navigating.
For PFL, it’s always a valuable opportunity to stay close to the market, strengthen relationships, showcase our services, and meet new contacts across the space.
Appreciate everyone who helped make it a great week in Houston — for more information on SWARS please call PFL today!
We Are Watching the War in Iran
Three weeks into the conflict, the most important thing happening in global energy markets is not the price level. It is the price geography. The Brent-WTI spread, which traded around $4/bl before February 28, widened to nearly $20/bl at its peak last week, a divergence not seen in over a decade. Dubai crude traded as high as $136 per barrel. Oman crude exceeded $165. Crude benchmarks tied to regions closest to the disruption are commanding premiums that have no modern precedent, and North American crude is, for now, relatively insulated. WTI Houston settled last week at $101.69/bl, its widest premium over Nymex-quality WTI in Cushing since April 2020, as refiners globally scrambled to replace Middle Eastern barrels with U.S. export-quality crude. Bakken and Permian grades are suddenly in demand from buyers in Asia-Pacific and Europe who have rarely leaned on American supply this heavily.
For Western Canadian producers, the geography cuts both ways. WCS at Hardisty fell to $80.46/bl this week, down on the week even as WTI surged, reflecting a market that is struggling to move Canadian heavy crude to the buyers who need it most. The rail rate from Alberta to the U.S. Gulf Coast, holds at $15.19/bl, meaning transported WCS still nets well against U.S. Gulf Coast heavy crude values from a Canadian producer perspective. The irony of this moment is that Alberta sits on some of the most production-ready heavy oil inventory in the world, priced at a discount, and the infrastructure to move it at scale is either full or lacks the necessary rail cars to move it. The pipeline and rail picture last week makes that point with unusual clarity, as we discuss in the stories that follow.
We Are Watching Targa
The Hormuz crisis already had global LPG markets on edge. Then on Wednesday last week, Targa Resources issued a force majeure on propane loadings from its Galena Park export terminal on the Houston Ship Channel after mechanical problems knocked the facility to 70% of its regular 472,000 b/d capacity. Terminal fees for LPG export cargoes out of the U.S. Gulf Coast surged to their highest level in more than ten years, as capacity constraints collided with an arbitrage to Asia that blew past $500 per tonne following attacks on gas treatment facilities at Iran’s South Pars project. AFEI propane prices, the benchmark for spot delivered propane into Japan, recorded their largest single-day increase on record on Thursday of last week, surging more than 18% in one session.
Galena Park accounts for roughly 20% of all U.S. LPG exports, with more than half of its volumes typically flowing to Japan and South Korea, markets that are now scrambling for supply as Hormuz throughput remains near zero for Western operators. Loading schedules are delayed by an estimated one to two weeks, and in a market this tight, that compounds quickly. Propane car demand into Gulf Coast accumulation points will reflect the tighter market as midcontinent buyers seek to move supply toward export terminals that are operating below capacity, and that dynamic supports tank car utilization on corridors that were running soft just a few weeks ago. Propane at the U.S. Gulf Coast is up and the inland supply is there. Getting it to tidewater efficiently is the problem.
We Are Watching Alberta
As PFL noted last week, the Trans Mountain Expansion was supposed to be Alberta’s insurance policy against exactly this kind of market dislocation: a geopolitical shock that makes Asian buyers suddenly hungry for non-Hormuz supply. That thesis is not playing out the way producers hoped. Heavy sour Canadian crude loading out of the TMX system fell to a two-week low, with May nominations still looking for buyers well past the point in the cycle when most FOB cargoes have typically traded. Chinese buyers, who have taken roughly 75% of heavy TMX exports since the pipeline came online in May 2024, are largely absent because advanced Chinese refineries cannot process high-TAN Canadian crude without blending it with Saudi Arab Light or Abu Dhabi Murban, neither of which is reliably available while Hormuz remains closed.
The consequence is that volume that would normally flow west to Westridge is backing up into the Enbridge Mainline, and the Mainline is already full. Heavy crude apportionment for April reached 14%, surpassing the previous post-TMX record set in February. Light crude nominations at Kerrobert were cut by 23%. The Chicago WCS crack spread averaged around $34/bl during the April trading cycle, which kept southbound Mainline demand strong and contributed directly to the record apportionment. CPKC petroleum carloads fell 8% last week and CN was down 2%, both reflecting spreads that have made long-haul rail less competitive even as pipeline capacity tightens.
We Are Watching North Dakota
When the Brent-WTI spread trades at nearly $12/bl and is widening fast, the North Dakota Pipeline Authority pays attention. That spread, which stood at roughly $6/bl just six days earlier, nearly doubled in a week as global crude markets repriced the geography of supply. North Dakota produced 1.16 million barrels per day in January, down slightly from the prior year as both winter weather and pre-war low prices constrained activity. Any meaningful increase in North Dakota output to capture coastal market premiums would move by rail, since the pipelines connecting the state to east and west coast refiners are either full or not built. That was true before the Iran war, and it is doubly true now. There are non-coiled railcars out there to ship Bakken crude if one could get loading, call PFL today!
The caution flag is the capital cycle lag. Operators who were pulling rigs in January, including at least one major producer that had cut to zero drilling rigs earlier this year, cannot restart overnight on a price signal that may prove temporary. Meaningful output changes lag capital spending decisions by six to twelve months. West and east coast refiners together imported about 314,000 b/d from the Middle East in 2025. If even a fraction of that volume shifts to Bakken crude delivered by rail, it represents a real demand signal for tank cars on corridors that have been running well below their capacity peak. The economics need to hold long enough for producers to commit capital and shippers commit to rail cars. That is the open question!
We Are Watching BP
At midnight on Thursday of last week, BP locked out more than 800 United Steelworkers members at its Whiting, Indiana refinery, formally moving the labor dispute from threat to reality. Whiting processes 440,000 barrels per day and is the single largest inland refinery in the United States. 98.3% of its members had voted to authorize a strike, and the USW president said publicly that members are prepared for a long fight. BP’s decision to initiate the lockout rather than wait for a strike gives the company control of the timeline, but running a refinery of this complexity on replacement workers and salaried staff is a risk that BP’s public statements have understated.
The timing matters for markets that are already stretched. Illinois retail gasoline averaged $4.18 per gallon last week, up 35% month-over-month. Diesel crack spreads are at levels not seen since the early days of the Russia-Ukraine conflict. Whiting sits at the center of supply chains that feed fuel distribution across the Midwest and into the southeast. Any operational disruption that forces crude throughput reductions, even briefly, would ripple through product markets that have no margin for additional tightening. Both sides say they are willing to keep talking. The Union President’s public posture suggests that the USW is not in a hurry to fold. PFL customers who route crude to the Chicago complex or depend on product movements out of Whiting should keep this one on the radar.
We Are Watching the Jones Act
On Wednesday of last week, the White House announced a 60-day suspension of the Jones Act, allowing foreign-flagged vessels to carry crude oil, natural gas, NGL, refined petroleum products, coal, and fertilizer between U.S. ports. The administration framed it as a national security measure under the same Defense Production Act authority used for other emergency actions taken last week. The American Maritime Partnership, representing domestic carriers, argued that domestic shipping costs account for less than one cent per gallon of gasoline nationwide, making the pump price relief largely symbolic. That is probably right! The more consequential near-term effect is on fertilizer distribution, where a 60-day window landing directly on the spring planting window finds farmers already absorbing a 30% urea price spike at the Port of New Orleans, and looking for every available supply avenue.
A detail from market sources this week deserves attention from anyone watching Gulf Coast product flows. Borco, Buckeye Partners’ terminal in Freeport, Bahamas, became the top destination for Gulf Coast gasoline blending component exports in 2025 precisely because shippers used it to avoid Jones Act tanker costs on domestic voyages. That routing is now being bypassed entirely, with charterers already putting foreign Aframax tankers on subjects for direct Houston to East Coast voyages. Every barrel of refined product that moves by foreign-flagged tanker directly from the Gulf Coast to the Atlantic coast is a barrel that does not move by rail or pipeline, and 60 days is long enough to reshape some routing habits. Whether the waiver gets extended past May is the question worth tracking. It has been done before. Once granted, the political barrier drops.
We Are Watching Ethanol
Ethanol has been waiting for a catalyst. It got one. Rail-delivered ethanol in Chicago hit $1.99 per gallon last week, up more than 10 cents week over week, as the energy price spike from the Hormuz crisis pushed blending economics sharply in ethanol’s favour. With gasoline approaching $3.84 per gallon nationally and blend components tightening across the Atlantic coast, the price advantage of E10 and E15 blends is widening in real time. The Renewable Fuels Association and seven Midwestern governors jointly petitioned the EPA for an emergency year-round E15 waiver for the 2026 summer driving season, and the political conditions for a favourable response have never been better.
The supply picture is equally supportive. The ethanol industry entered 2026 with nearly two billion gallons of unused production capacity after a record 16.5-billion-gallon production year in 2025. That slack can be absorbed quickly if blending mandates expand. For ethanol tank car operators, a 10-cent weekly price move combined with a pending E15 waiver and a gasoline market that needs domestic volume relief all point to meaningfully stronger car demand through the summer driving season. The Omaha-to-Bakersfield unit train rate holds at 27.47 cents per gallon this week, essentially flat on the month, which means the economics of moving Midwest ethanol to West Coast blending hubs have improved materially as the commodity price moved and the transport cost did not.
We Are Watching Fertilizer
Urea at the Port of New Orleans hit $550 per tonne last week, up 30% in less than three weeks. The cause is not a demand surge. It is physical absence of supply. The Strait of Hormuz closure has stranded an estimated 35% of the world’s seaborne urea and phosphate production, with no viable pipeline or land-based alternative capable of moving bulk fertilizer volumes out of the Persian Gulf at scale. The timing is as bad as it gets: this is the spring planting window for North American corn and soy, and farmers are pricing inputs for a crop that goes in the ground in the next four to six weeks. Some global spot prices have been reported as high as $680 per tonne, reflecting panic buying.
North American fertilizer moves overwhelmingly by rail from Gulf Coast import terminals and domestic production facilities to agricultural distribution points across the corn belt. A 30% price spike does not reduce the tonnage that needs to move, it concentrates demand and creates urgency in the supply chain. Farmers who locked in fertilizer supply earlier in the season are insulated. Those who did not, are now competing for a short market on a short timeline, and that competition flows directly into tank car and covered hopper demand on the corridors connecting Gulf ports to Midwest distribution hubs. The Jones Act waiver covers fertilizer and opens some additional marine routing flexibility, the volumes moving inland to farm-level distribution will not be affected. Rail is still the only practical answer for the last several hundred miles.
We Continue to Watch Left Wing Canadian Prime Minister Carney
On Wednesday of last week, TC Energy CEO Francois Poirier used a public investor forum to deliver a direct rebuke of Prime Minister Carney’s energy infrastructure framework. Carney’s Major Projects Office, opened last year to steer proposals to approval within two years, is, in Poirier’s view, simply not competitive in a world where energy demand is rising. He called explicitly for a six-month permitting window. The CEO of the company that would build a new Canadian pipeline corridor is publicly saying the government’s approval process is still too slow, and that signal will land with every institutional investor currently deciding whether to commit capital to Canadian energy infrastructure.
We have covered Carney’s energy posture repeatedly in recent reports. The gap between the rhetoric and the regulatory reality has not closed. Last week, with Hormuz disrupting global supply and the U.S. leaning on Canadian crude as a strategic asset in ongoing tariff talks, the cost of that gap is more visible than it has been in years. Canada pledged 23.6 million barrels to the IEA’s coordinated stabilization effort this week, with production increases from Alberta’s oil sands taking three to six months to reach market. A country that cannot build a pipeline in under a decade, cannot permit a terminal without a court fight, and whose prime minister’s flagship infrastructure office is being called inadequate by the CEO of its largest pipeline company is not an energy superpower. It is a country with energy in the ground and politics above it. Carney needs to make a pivot quickly in our opinion the hard working Canadian people deserve better!
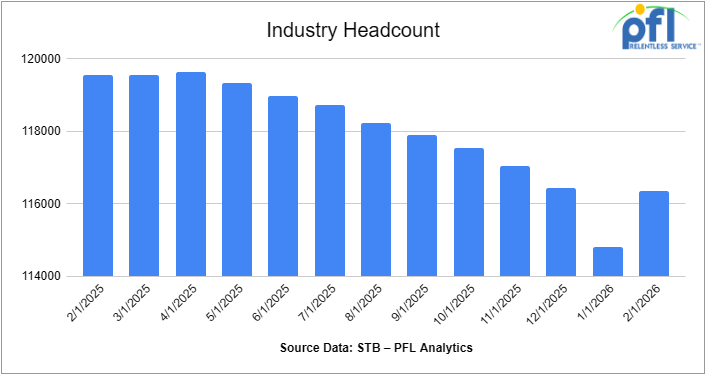
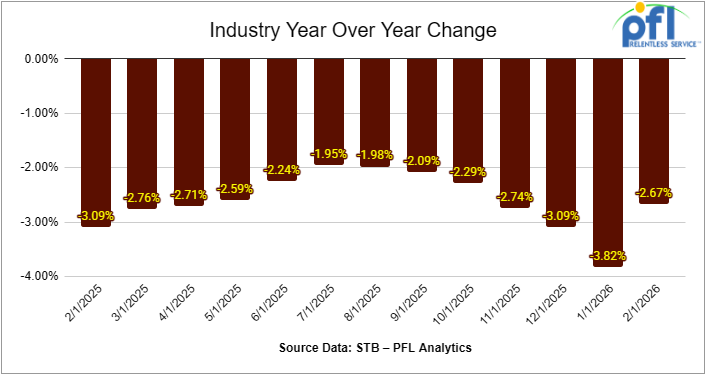
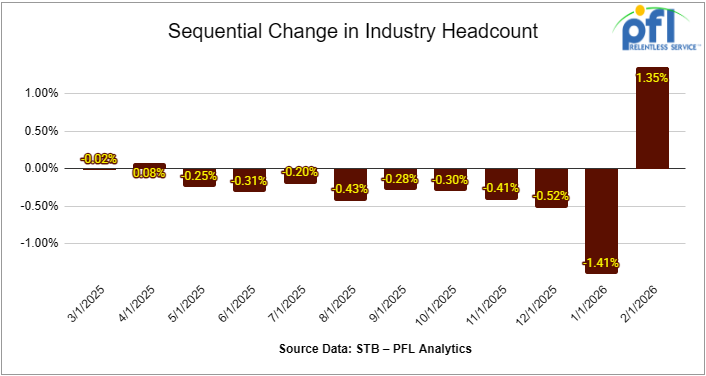
We are watching Class 1 Industrial Headcount
Class I railroads employed 116,364 workers in the United States in February 2026, a 1.35% increase from January 2026’s count of 114,811 but a -2.67% year-over-year decrease from February 2025’s total of 119,562, according to Surface Transportation Board data.
Three of the six employment categories posted month-over-month increases between January and February 2026. These were Professional and Administrative, up 2.08% to 9,016 workers; Maintenance of Equipment and Stores, which increased 1.62% to 16,617 workers; and Transportation (train and engine), which increased 2.17% to 49,670 workers, Maintenance of Way and Structures rose 0.75% to 28,373 workers, and Transportation (other than train and engine) increased 1.29% to 4,800 workers.
The category that posted a month-over-month decrease was Executives, officials, and staff assistants, down -2.76% to 7,888 workers.
Year-over-year, only one category posted an employment gain: Executives, officials, and staff assistants, up 0.33%.
Categories that registered year-over-year decreases in February 2026 were Professional and Administrative, down -6.63%; Maintenance of Way and Structures, down -0.42%; Maintenance of Equipment and Stores, down -2.54%; Transportation (other than train and engine), down -4.97%; and Transportation (train and engine), down -3.46%.
We are Watching Key Economic Indicators
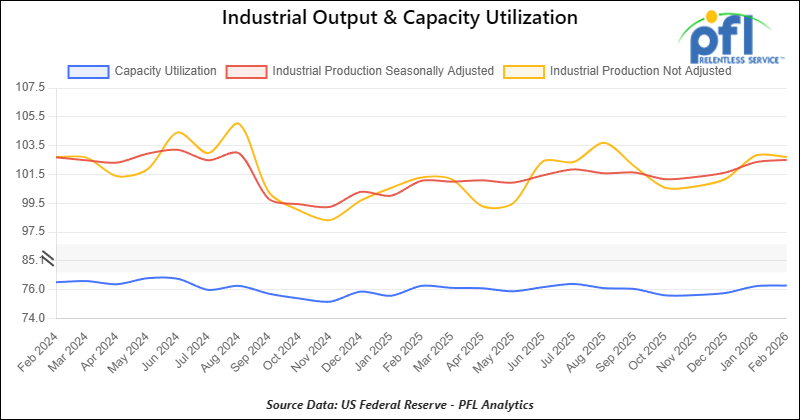
Industrial Output and Capacity Utilization
Manufacturing accounts for approximately 75% of total output. Manufacturing output in February was up 0.20% from January of 2026.
Capacity utilization is a measure of how fully firms are using the machinery and equipment. Capacity Utilization was up 0.05% from January in February.
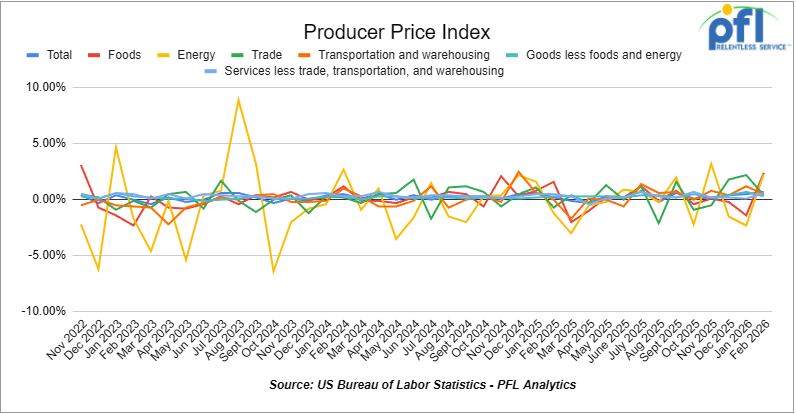
Producer Price Index
In February 2026, the Producer Price Index (PPI) for final demand rose 0.3% month-over-month, easing from the 0.5% increase in January but still indicating continued upstream price pressures. Core PPI (final demand less foods, energy, and trade services) increased 0.2% month over month, slightly below January’s pace. The monthly increase was driven primarily by services, which rose 0.4%, while goods increased 0.2%. Within goods, food prices rose modestly, while energy prices were mixed; goods less foods and energy increased 0.3%, suggesting steady core goods pricing. Within services, trade margins continued to firm, while transportation and warehousing posted moderate gains, and services less trade, transportation, and warehousing were relatively subdued, indicating more balanced services inflation compared to January.
In February 2026, the Consumer Price Index (CPI) increased 0.4% month-over-month, accelerating from January’s gain, and was up approximately 2.9% year over year. Core CPI (all items less food and energy) rose 0.3% month-over-month and was up approximately 2.8% year-over-year. Shelter remained the largest contributor to the monthly increase. Food prices continued to edge higher, while energy prices rebounded modestly, contributing to the firmer headline figure.
Lease Bids
- 100, 21.9K 117J Tanks located off of All Class 1s in Midwest. For use in CO2 service. Period: 6 months.
- 30-50, 30K 117J Tanks located off of NS or CSX in Northeast. For use in C5 service. Period: 1 year.
- 20-50, 4000-5000 Covered Hoppers located off of UP or BN in Houston. For use in Urea, Potash, Ammonium Sulfate service. Period: 6-12 Months.
- 200, 33K Pressure Tanks located off of CSX or NS in Ohio. For use in Propylene service. Period: 18 Months.
- 30-50, 25.5K DOT 111 Tanks located off of All Class 1s in Anywhere. For use in Asphalt service. Period: 1-3 Years.
- 40, 33K Pressure Tanks located off of UP in Eunice, LA. For use in Propane service. Period: 1 Year.
- 40, 29K DOT 111 Tanks located off of UP or BN in Midwest. For use in Veg Oil service. Period: 5 Year.
Sales Bids
- 28, 3400CF Covered Hoppers located off of UP BN in Texas. For use in Cement service. Cement Gates needed.
- 20, 17K DOT111 Tanks located off of various class 1s in various locations. For use in corn syrup service.
- 120, Various Open-Top Aluminum Rotary Gondolas located off of various class 1s in various locations. For use in Sulphur service. Built 2004 or later.
- 30, 29K DOT111 Tanks located off of various class 1s in Chicago. For use in Veg Oil service.
Lease Offers
- 100, 30K CPC1232 Tanks located off of UP or BN in Texas. Last used in Diesel.
- 100, 30K DOT117R Tanks located off of UP or BN in Texas. Last used in Gasoline.
- 100, 29K DOT117R Tanks located off of UP or BN in Texas. Last used in Gasoline. Coiled and Insulated.
- 21, 6351 Covered Hoppers located off of CN in Wisconsin. Last used in DDG. Available until February 2027.
- 29, 6500 Covered Hoppers located off of CN in Wisconsin. Last used in DDG. Available until February 2027.
- 50, 20K DOT117J Tanks located off of All Class 1s in Moving. Last used in Styrene.
- 29, 25.5K DOT117J Tanks located off of UP or BN in Texas. Cars are currently clean. Cars are currently clean.
- 90, 30K DOT117J Tanks located off of UP or BN in Corpus Christie. Last used in Diesel.
- 200, 340W DOT 112J Tanks located off of All Class 1s in Multiple Locations. Last used in Propane and Butane. Cars are currently clean.
- 15, 6200CF Covered Hoppers located off of All Class 1s in Wisconsin. Last used in Plastic. Cars are currently clean.
- 30, 6500CF Covered Hoppers located off of All Class 1s in Wisconsin. Last used in Plastic. Cars are currently clean.
- 50, 30K DOT117J Tanks located off of UP or BN in Corpus Christie. Last used in Gasoline.
- 24, 21K Stainless Steel Tanks located off of UP in Texas / Mexico Border. Last used in SULFACTANT. Cars are currently clean.
- 34, 30K DOT 111 Tanks located off of UP in Texas / Mexico Border. Last used in Veg Oil. Cars are currently clean.
Sales Offers
- 50, 31.8K CPC1232 Tanks located off of UP or BN in TX. Last used in Multiple. Requal Due in 2025.
- 35, 3400CF Covered Hoppers located off of UP or BN in Midwest. Last used in Sand.
- 25, 30K 117J Tanks located off of CSX in Jackson, TN. Last used in Fuels. Newly Requalified.
Call PFL today to discuss your needs and our availability and market reach. Whether you are looking to lease cars, lease out cars, buy cars, or sell cars call PFL today at 239-390-2885
Live Railcar Markets
| CAT | Type | Capacity | GRL | QTY | LOC | Class | Prev. Use | Offer | Note |
|---|
PFL will be at the Following Conferences

- Where: Loews Arlington Hotel
- Attending: Brian Baker (239.297.4519), David Cohen (954-729-4774), and Curtis Chandler (239-405-3365)
- Conference Website

- Where: The Westin Galleria Dallas
- Attending: David Cohen (954-729-4774), and Curtis Chandler (239-405-3365)
- Conference Website

- Where: The Westin Galleria Dallas
- Attending: Brian Baker (239.297.4519)
- Conference Website