
“Only he who attempts the absurd is capable of achieving the impossible.”
― Miguel de Unamuno
COVID-19
The United States currently has 27,611,403 confirmed COVID-19 cases and 474,933 confirmed deaths.
US Jobless Claims
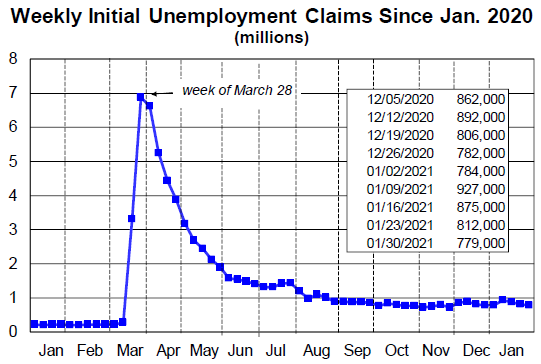
The number of Americans applying for unemployment benefits fell to 779,000 people last week. The job market ended 2020 with no momentum and gained only a small amount back to start 2021.
The Bureau of Labor Statistics (BLS) announced on Friday of last week 49,000 net new jobs were created in January 2021. Estimates ranged from -200,000 to a gain of +400,000, underscoring the uncertainty the pandemic and state shutdowns have created. Job losses for December 2020 were revised from -140,000 last month to -227,000 this month. January 2021’s small job gains mean that, of the 22.4 million jobs lost in March and April 2020, 12.4 million have been recovered, leaving 9.9 million Americans still unemployed.
Manufacturing and construction jobs fell by 10,000 and 3,000, respectively, in January, in both cases their first declines in nine months. They were among the sectors hit relatively less hard by the pandemic, though their employment levels today are still well below where they were before the Covid-19 pandemic.
Employment in leisure and hospitality followed a 536,000 loss in December with another 61,000 jobs lost in January 2021. Retail trade lost 38,000 jobs in January after gaining 135,000 in December. The healthcare industry lost 30,000 jobs in January, its first decline in nine months. Since February 2020, healthcare employment is down by 542,000. In January, temporary help employment rose by 81,000, while education employment rose by 119,000.
The official unemployment rate fell to 6.3% in January from 6.7% in December, thanks to a combination of a lower number of officially unemployed (down to 10.1 million in January from 10.7 million in December) and a 400,000 decline in the official size of the labor force in January. The official size of the labor force often rises or falls by several hundred thousand from one month to the next.
As of January 2021, 4.0 million Americans have been unemployed for more than six months.
Initial claims for unemployment benefits provide a useful weekly snapshot of the condition of the labor market. In January, they provided little reason for optimism. Only when they start coming down substantially will it become clear that the employment situation is recovering. This is a sign that layoffs keep coming as the economy struggles due primarily at this point to forced shutdowns. See the chart below:
Markets close strong Week over Week over 1.9 Trillion Stimulus Bill
The Dow closed higher on Friday of last week, up +92.38 (+0.30%) closing out the week at 31,148.24 points, up 1,165.62 points week over week. The S&P 500 closed higher on Friday of last week, up +15.09 points (+0.39%) and closing out the week at 3,886.83 points, up 172.59 points week over week. The Nasdaq also closed higher on Friday of last week, up +78.55 points (+0.57%) closing out the week at 13,856.30 points, up 785.61 points week over week.
In overnight trading, DOW futures traded higher and are expected to open up this morning 19 points.
Oil Markets Relatively Stable Week over Week
Oil prices hit its highest level in a year on Friday of last week, closing in on $60/bbl, supported by economic revival hopes and supply curbs by producer group OPEC and its allies. Oil was also supported as U.S. stock markets hit record highs on signs of progress towards more economic stimulus, while a closely watched jobs report confirmed the labor market was stabilizing. WTI crude oil for March delivery rose +$0.62 to $56.85 a barrel Friday of last week up $4.35 per barrel week over week. Brent crude oil for April delivery rose +$0.50 to $59.34 a barrel Friday of last week up $4.30 per barrel week over week.
U.S. commercial crude oil inventories decreased by 1.0 million barrels week over week. At 475.7 million barrels, U.S. crude oil inventories are 4% above the five-year average for this time of year. Total motor gasoline inventories increased by 4.5 million barrels last week and are 1% below the five-year average for this time of year. Finished gasoline inventories decreased while blending components inventories increased last week. Distillate fuel inventories were virtually unchanged last week and are 8% above the five-year average for this time of year. Propane/propylene inventories decreased by 1.6 million barrels last week and are 6% below the five-year average for this time of year. Total commercial petroleum inventories increased by 2.9 million barrels last week.
U.S. crude oil imports averaged 6.5 million barrels per day last week, increased by 1.4 million barrels per day from the previous week. Over the past four weeks, crude oil imports averaged 6.0 million barrels per day, 9.2% less than the same four-week period last year. Total motor gasoline imports (including both finished gasoline and gasoline blending components) last week averaged 568,000 barrels per day, and distillate fuel imports averaged 518,000 barrels per day.
Oil is higher in overnight trading and, as of the writing of this report, WTI is poised to open at 52.83, up 56 cents per barrel from Friday’s close.
Rig Count
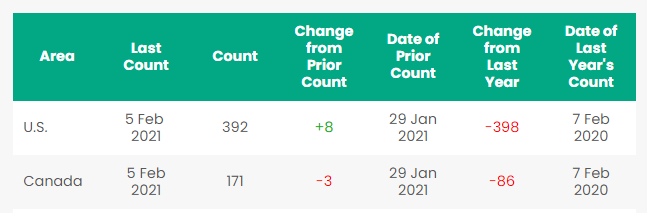
North American rig count is up by 5 rigs week over week. The U.S. gained 8 rigs week over week. The U.S. currently has 392 active rigs (299 of which are oil rigs up four week-over-week and gas rigs were also up four rigs week over week to 92, and miscellaneous rigs unchanged at one rig). Canada’s rig count was down by 3 rigs week over week and Canada’s overall rig count is 171 active rigs. Year over year we are down 484 rigs collectively.
North American Rig Count Summary
North American Rail Traffic
Total North American rail volumes were up 0.7% year over year in week 4 (U.S. +2.1%, Canada -3.3%, Mexico -0.6%) resulting in year-to-date volumes that are up 4.9% year over year (U.S. +5.3%, Canada +5.6%, Mexico -3.7%). 4 of the AAR’s 11 major traffic categories posted year-over-year increases with the largest increases coming from intermodal (+4.7%) and grain (+38.4%). The largest decrease came from coal (-8.9%).
In the East, CSX’s total volumes were down 1.6%, with the largest decrease coming from motor vehicles & parts (-16.3%). The largest increase came from intermodal (+4.6%). NS’s total volumes were up 1.8%, with the largest increase coming from intermodal (+7.9%). The largest decreases came from petroleum (-42.4%) and coal (-9.7%).
In the West, BN’s total volumes were up 0.7%, with the largest increases coming from intermodal (+8.8%) and grain (+44.7%). The largest decrease came from coal (-18.9%). UP’s total volumes were up 0.3%, with the largest increases coming from intermodal (+5.9%) and grain (+50.4%). The largest decreases came from coal (-16.2%), stone sand & gravel (-27.4%), and petroleum (-19.8%).
In Canada, CN’s total volumes were down 2.9%, with the largest decreases coming from petroleum (-34.3%) and metallic ores (-13.6%). The largest increases came from grain (+65.0%) and intermodal (+2.6%). RTMs were up 1.4%. CP’s total volumes were down 4.4%, with the largest decrease coming from intermodal (-12.9%). The largest increase came from chemicals (+16.5%). RTMs were down 1.7%.
KCS’s total volumes were up 2.4%, with the largest increases coming from petroleum (+19.9%) and intermodal (+3.8%).
Source: Stephens
Things we are keeping an eye on
Railcars in Storage
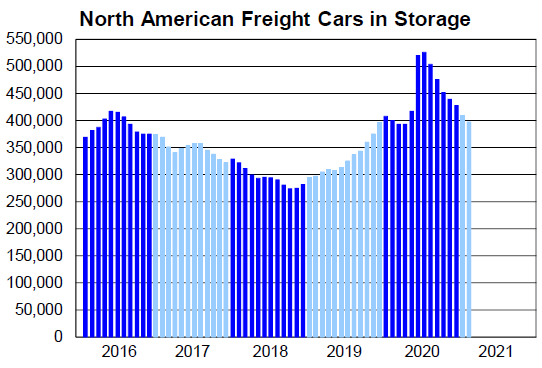
We are watching Rail Cars in Storage – Rail cars in storage continue to decline month over month and now are below pre-Pandemic COVID-19 levels. As of February 1, 2021, 396,867 freight cars — 24.0% of the 1.656 million-unit North American rail freight car fleet are now in storage. Please visit PFL’s just released storage report for a detailed analysis of rail cars in storage across the country CLICK HERE
Several commodities continue to struggle, including coal; crushed stone, sand, and gravel; and petroleum products. All three have seen big year-over-year declines in recent months as energy-related markets continue to transform.
Petroleum By Rail
The four-week rolling average of petroleum carloads carried on the six largest North American railroads rose to 27,892 from 27,405 week over week. Canadian volumes were mixed. CP shipments rose by 2.2% and CN volumes were down by 8.7%. U.S. rail road operators were mostly lower. BN had the largest percentage loss, down by 15.9%.
We are watching this week some key economic indicators just released
- U.S Gross Domestic Product (GDP) – U.S. GDP increased a preliminary 4.0% in Q4 2020, according to the first estimate released by the Bureau of Economic Analysis (BEA) on January 28. The BEA noted that, “The increase in fourth quarter GDP reflected both the continued economic recovery from the sharp declines earlier in the year and the ongoing impact of the COVID-19 pandemic, including new restrictions and closures that took effect in some areas of the United States. The full economic effects of the COVID-19 pandemic cannot be quantified in the GDP estimate for the fourth quarter of 2020 because the impacts are generally embedded in source data and cannot be separately identified.” Exports, consumer spending on services, business investment, and housing had similar contributions to GDP growth in Q4. On an annual basis, GDP fell 3.5% in 2020, its first decline since 2009. GDP estimate from the Federal Reserve Bank of Atlanta says GDP will grow an annualized 4.6% in Q1 2021. Things can change, but right now the consensus among economists is that economic activity will return to pre-pandemic levels in the second half of 2021. The number of people employed is projected to return to its pre-pandemic level in 2024.”
- Industrial Output and Capacity Utilization – Seasonally adjusted total U.S. industrial output rose a preliminary 1.6% in December 2020 from November 2020, its biggest month-to-month gain in five months and seventh gain in the past eight months. However, even after these increases, total output in December 2020 was still 3.6% lower than it was a year earlier and 3.3% below the pre-pandemic February 2020 level.
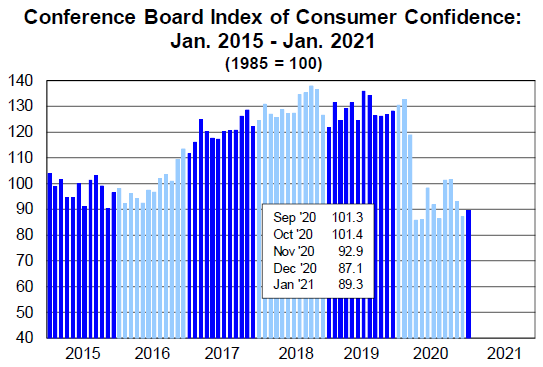
- Consumer Confidence – The Conference Board’s index of consumer confidence improved slightly to 89.3 in January 2021 from a revised 87.1 in December 2020. After plummeting in last spring, the index rose above 100 in September and October before falling to where it is now. The University of Michigan’s index of consumer sentiment went in the opposite direction in January, falling to 79.0 from 80.7 in December. The overall level of the index has averaged 81.5 throughout the pandemic, well below the average of 97.0 from 2017 to 2019 and well below the confidence exhibited during Trump’s years in office see the chart below:
Source: Conference Board
- Consumer Spending – U.S. consumer spending fell a preliminary 0.2% in December 2020 from November 2020, following a revised 0.7% drop in November from October. Spending tanked in March and April, recovered strongly in May and June, but has since petered out. Retail sales, which are essentially a subset of total consumer spending, had a similar pattern. They fell 0.7% in December from November, their third straight month-to-month decline after growing each month from May to September following a sharp decline in April. The spending numbers were worse than most economists expected and reflect a stalling economy due to a surge in coronavirus cases (and restrictions imposed to suppress them) around the country.
- U.S. Housing – A bright spot in the American economy – Total U.S. housing starts were a preliminary and annualized 1.67 million in December 2020 — up 5.8% from November 2020, up 5.2% from December 2019, and the highest for any month since September 2006. Single-family starts were an annualized 1.34 million in December, up 12.0% from November and also the most for any month since September 2006. Multi-family starts were an annualized 331,000 in December, down 13.6% from November. Total housing starts for 2020 were 1.38 million, up 7.0% from 2019 and the most since 2006. Existing home sales were an annualized 6.76 million in December 2020, up 22.2% over December 2019 — the fourth straight month with a gain of at least 20%.
We have been extremely busy at PFL with return on lease programs involving rail car storage instead of returning cars to a shop. A quick turnaround is what we all want and need. Railcar storage in general has been extremely active. Please call PFL now at 239-390-2885 if you are looking for rail car storage, want to trouble shoot a return on lease scenario or have storage availability. Whether you are a car owner, lessor or lessee or even a class 1 that wants to help out a customer we are here to “help you help your customer!”
Railcar Markets
Leasing and Subleasing has been brisk as economic activity picks up. Inquiries have continued to be brisk and strong Call PFL Today for all your rail car needs 239-390-2885
PFL is seeking:
• 35 3000-3400 CF Aluminum Hoppers with Manual Knocker Gates for the use in Sulfur in Alberta for 3-5 Years.
• 50 25.5K-29K CPC 1232’s for the use in Bitumen Service in Saskatchewan for 1 Year.
• 100 30K 117J’s for the use in Bakken Service in North Dakota for 1 Year.
• 100 31.8K CPC 1232’s for the use in Condensate in the Northeast for 1 Year. Must have Mag Rods.
• 10 30K Tank Cars for the Use in Veg Oil in the Midwest for 1-3 Years.
• 50 340W Pressure Cars needed for Butane in the Northeast for 1 Year.
• 10 31.8K CPC 1232’s or 30K 117Rs for the use in Liquor service for 5 Years. Must have specific lining.
• 100 31.8k CPC 1232’s for the Use in Gas or Diesel service in Texas for 1 Year.
• 100 23.5K CPC 1232’s for the use in Asphalt service in the Midwest or Canada.
• 30-50 Stainless Steel Tank Cars needed for the use in Liquor in the Southeast for 3-5 Years.
PFL is offering:
- Various tank cars for lease with dirty to dirty service including, nitric acid, gasoline, diesel, crude oil, Lease terms negotiable, clean service also available in various tanks and locations
- Covered PD Hoppers clean various sizes and locations 263 and 286’s negotiable
- 70 117Js in Texas dirty to dirty price negotiable
- 100 117Js 28.3 C/I for sale or lease in Texas
- 50 CPC 1232 28.3 tanks clean last veg oil various locations negotiable
- 200 30K tankers cleaned and ready for service, for sale or lease,
- 218 73 ft 286 GRL riserless deck, center part for sale,
- 19 auto-max II automobile carrier racks – tri-level for sale or lease in Arkansas
- 49 60’ Box cars 286 EOL refurbished in Tenn.,
- 20 low sided gondolas for lease in NJ 2743 cu ft,
- 100 34.2 Gallon Dot 111 for lease great for Ethanol or Alcohol
- 10 food grade stainless steel cars
- 30 CPC 1232 25.5K Pennsylvania NS clean negotiable
Call PFL today to discuss your needs and our availability and market reach. Whether you are looking to lease cars, lease out cars, buy cars or sell cars call PFL today 239-390-2885
PFL offers turn-key solutions to maximize your profitability. Our goal is to provide a win/win scenario for all and we can handle virtually all of your railcar needs. Whether it’s loaded storage, empty storage, subleasing or leasing excess cars, filling orders for cars wanted, mobile railcar cleaning, blasting, mobile railcar repair, or scrapping at strategic partner sites, PFL will do its best to assist you. PFL also assists fleets and lessors with leases and sales and offers Total Fleet Evaluation Services. We will analyze your current leases, storage, and company objectives to draw up a plan of action. We will save Lessor and Lessee the headache and aggravation of navigating through this rapidly changing landscape..
PFL IS READY TO CLEAN CARS TODAY ON A MOBILE BASIS WE ARE CURRENTLY IN EAST TEXAS
Live Railcar Markets
| CAT | Type | Capacity | GRL | QTY | LOC | Class | Prev. Use | Clean | Offer | Note |
|---|