
“Yesterday, December 7, 1941 — a date which will live in infamy”
– Franklin D Roosevelt Dec 8, 1941
COVID 19
The United States currently has 15,159,529 confirmed COVID 19 cases and 288,906 confirmed deaths.
US Jobless Claims
The U.S. Labor Department stated on Thursday of last week that U.S. workers filed an additional 712,000 initial jobless claims. The number of first-time filers for unemployment benefits were lower than expected and were estimated to come in at 775,000. Continuing jobless claims, which serve as a barometer for ongoing unemployment, fell to a nine-month low of 5.52 million during the week ended November 21. As of last week’s data, 20.2 million Americans were claiming unemployment benefits of some form.
The Bureau of Labor Statistics announced on Friday of last week that 245,000 net new jobs were created in November 2020. Job gains have been shrinking since June, when they peaked at 4.8 million, however, November’s job gains were no better than in some months pre COVID-19 and leave 10.1 million Americans still unemployed. Weak job gains in November weren’t unexpected given the widespread resurgence of COVID-19 and return of lockdowns in some States. It seems likely, that job numbers will get worse before they get better. (See Chart below).

It has taken seven months to recover 60% of the 21 million private-sector jobs lost in March and April this year. At November’s pace, it will take roughly two years to recover the rest. The official unemployment rate fell to 6.7% in November from 6.9% in October and 7.9% in September.
Markets continue to trend Higher
The Dow closed higher on Friday, up +248.74 points (+0.83%) closing out the week at 30,218.26 points up 307.89 points week over week. The S&P 500 closed higher on Friday as well, up 32.40 points (+0.88%) closing out the week at 3,699.12 points, up 60.77 points week over week. The Nasdaq Composite closed higher as well on Friday of last week, up 87.05 points (+0.70%) closing out the week at 12,464.23 points up 258.38 points week over week.
In overnight trading, DOW futures traded lower and are expected to open down this morning roughly 100 points.
Oil gains for fifth straight week OPEC deal Cut for January
Oil rose for a fifth straight week, buoyed by optimism over Covid-19 vaccine progress and a deal cut by OPEC+ on Thursday of last week. OPEC+, after days of tense discussions, agreed on Thursday to increase production by 500,000 barrels per day beginning in January. This will bring the total production cuts at the start of 2021 to 7.2 million bpd.
Oil Futures in New York and London closed at nine-month highs on Friday, with signs that momentum is building toward a U.S. fiscal stimulus plan that could provide an immediate demand boost, before a vaccine is widely available. West Texas Intermediate closed up +62 cents per barrel on Friday of last week to settle at US$46.26/bbl, posting a 1.6 per cent weekly gain.Brent closed higher as well, up +54 cents to end Friday’s session at US$49.25/bbl, with the contract rising more than two per cent this week.
According to the EIA, U.S. commercial crude oil inventories decreased by 0.7 million barrels from the previous week. At 488.0 million barrels, U.S. crude oil inventories are 7% above the five year average for this time of year. Total motor gasoline inventories increased by 3.5 million barrels last week and are 4% above the five year average for this time of year. Finished gasoline inventories decreased while blending components inventories increased last week. Distillate fuel inventories increased by 3.2 million barrels last week and are about 8% above the five year average for this time of year. Propane/propylene inventories decreased by 0.8 million barrels last week and are about 7% above the five year average for this time of year. U.S. refineries operated at 78.2% of their operable capacity last week.
Oil is lower in overnight trading and, WTI is poised to open at $45.83, down 43 cents per barrel from Friday’s close.
North American Rail Traffic
Total North American rail volumes were up 5.1% year over year in week 48 (U.S. +3.7%, Canada +12.5%, Mexico -7.8%), resulting in quarter to date volumes that are up 2.7% and year to date volumes that are down 7.7% (U.S. -8.3%, Canada -4.9%, Mexico -10.2%). 5 of the AAR’s 11 major traffic categories posted year over year increases with the largest increases coming from intermodal (+9.2%) and grain (+29.9%). The largest decrease came from coal (-9.8%).
In the East
CSX’s total volumes were up 7.3%, with the largest increase coming from intermodal (+12.7%). The largest decreases came from motor vehicles & parts (-6.8%) and stone, sand & gravel (-13.2%). NS’s total volumes were down 1.9%, with the largest decreases coming from coal (-24.1%) and petroleum (-52.2%). The largest increase came from intermodal (+3.8%).
In the West
BN’s total volumes were up 4.8%, with the largest increase coming from intermodal (+16.1%). The largest decrease came from coal (-15.3%). UP’s total volumes were up 2.4%, with the largest increases coming from intermodal (+8.5%) and grain (+12.0%). The largest decreases came from petroleum (-19.9%) and coal (-5.6%).
In Canada
CN’s total volumes were up 20.8% with the largest increases coming from intermodal (+15.8%), grain (+97.8%) and chemicals (+35.9%). RTMs were up 43.9%, and we would note the substantial increase is partially due to last year’s blockades on the network (easy comps). CP’s total volumes were down 3.4%, with the largest increase coming from grain (+33.8%). The largest decrease came from petroleum (-32.4%). RTMs were down 4.6%.
Kansas City Southern
KCS’s total volumes were down 2.3%, with the largest decreases coming from intermodal (-6.8%) and coal (-20.2%).
Source: Stephens
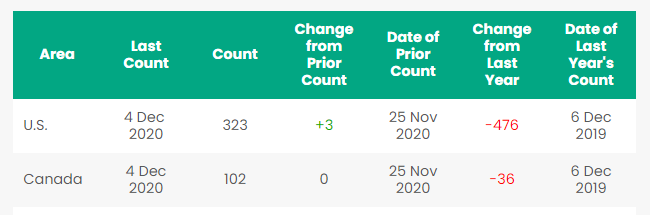
Rig Count
North America rig count is up by 3 Rigs week over week. The U.S. gained 3 rigs week over week with 323 active rigs. Canada’s rig count was flat week over week and Canada’s overall rig count is 102 active rigs. Year over year we are down 512 rigs collectively.
North American Rig Count Summary
Things we are keeping an eye on
- Railcars in Storage. The AAR just released monthly data on railcars in storage on Friday of last week. There were 428,500 railcars in storage at the end of November representing 25.8% of the North America’s fleet a decrease of roughly 11,000 unit’s month over month. (See Chart below)
North American Freight Cars in Storage

Please see PFL’s monthly railcar storage report sent out today for a more detailed analysis of trends and the industry dynamics as a whole.
2) Petroleum By Rail – The four week rolling average of petroleum carloads by rail on North America’s railroads rose to 24,278 from 23,799 the prior week. Canadian volumes fell week over week – CP shipments were down 0.04% and CN’s volumes fell by 4.1%. In the U.S., UP had the largest percentage loss of 10.5%.
3) Enbridge Line three – Enbridge will start construction on the project in Minnesota in December for the 760,000 barrel per day pipeline. Line 3 is expected to be operational in mid-2021 and once complete will double current capacity. The Canadian portion of the pipeline is already built and put into service.
4) Oil Supply and Demand Fundamentals – Are set to change under a Biden Administration and we don’t know how that will look at this point in time. President elect Biden is looking for a new deal with Iran paving the way for more oil coming from Iran in the not so distant future. Also, India wants to resume buying Oil from Iran and Venezuela.
5)We are looking at a bunch of economic indicators just released – Folks, things are starting to look weaker and we believe the change in the White House Administration , COVID-19 and financial aid programs coming to an end January 1, 2021 are key factors that will weigh heavily on the economy as we head into 2021 as consumers and small businesses alike are getting increasingly concerned:
i) Purchasing Managers Index (PMI) – The PMI was 57.5% in November, down 1.8 percentage points from October. It’s been above 50% for six straight months. The new orders component of the PMI fell from 67.9% in October to 65.1% in November. The employment component decreased to 48.4% to contraction territory, down 4.8 percentage points from October’s 53.2%. The customers’ inventories component of the PMI was 35.8% in November, the lowest it’s been since June 2010 and an indication that in the future, even if final demand stagnates, manufacturers will have to raise output just to get inventories back in balance
ii) Industrial Output and Capacity Utilization – Seasonally adjusted total U.S. industrial output rose 1.1% in October from September, following a revised 0.4% decline in September from August.
iii) Consumer Confidence – The Conference Board’s index of consumer confidence fell to 96.1 in November from 101.4 in October. Lynn Franco, who is in charge of the consumer confidence survey, said, “Consumers’ assessment of present-day conditions held steady, though consumers noted a moderation in business conditions, suggesting growth has slowed in Q4. Heading into 2021, consumers do not foresee the economy, nor the labor market, gaining strength. In addition, the resurgence of COVID-19 is further increasing uncertainty and exacerbating concerns about the outlook.” The University of Michigan’s index of consumer sentiment declined too, from 81.8 in October to 76.9 in November. The economist in charge of that index pointed to “the resurgence in covid -19 infections and deaths” as the main cause of the decline.
iv) New light vehicle sales – New light vehicle sales were an annualized and seasonally adjusted 15.6 million in November 2020, down from 16.3 million in October 2020 and 17.0 million in November 2019. The year-over-year decline in November was 8.4%, the most in three months. In 2020 through November, total sales were 12.84 million, down 16.8% from last year’s 15.44 million through November.
v) U.S. Housing – Total U.S. housing starts were an annualized 1.53 million in October 2020 — up 4.9% from September 2020, up 14.2% from October 2020, and the most since February 2020, before the pandemic began. Single-family housing starts were a preliminary and annualized 1.18 million in October, up 6.4% from September and the most since April 2007. Multi-family housing starts were 351,000 in October on an annualized basis, flat from September. Moody’s Analytics Chief Economist Mark Zandi said, “In the pandemic, nothing has been more surprising — positively surprising — than single-family housing,”As more Americans are working remotely, he said, “this is a fundamental shift in underlying housing preferences.”
vi) Consumer Spending – Total U.S. consumer spending rose a preliminary 0.5% in October 2020 from September 2020. Consumer spending accounts for around 70% of the economy. The increase in consumer spending in October 2020 pointed to the continuing expansion of the economy, albeit at a slower pace — the month-to-month increase in October was down from a gain of 1.2% in September 2020 and August 2020. Spending on goods was flat in October from September’s revised 1.3% gain. Spending on services was up 0.7% in October, down from a 1.2% gain in September.
We have been extremely busy at PFL with return-on-lease programs involving rail car storage instead of returning cars to a shop. A quick turnaround is what we all want and need. Railcar storage in general has been extremely active. Please call PFL now at 239-390-2885 if you are looking for rail car storage, want to troubleshoot a return on lease scenario or have storage availability. Whether you are a car owner, lessor or lessee, or even a class 1 that wants to help out a customer we are here to “help you help your customer!”
Railcar Markets
A sign of things getting better – leasing activity and inquiries have continued to be strong
PFL is seeking:
- 340W’s LPG pressure cars for various locations and lease terms,
- 50-90 263 or 286 GRL needed for corn syrup for purchase
- 50-60 Sulfuric acid cars 13.6 for purchase
- 40-50 molten Sulfur Cars 13.8 for purchase
- 15 500W tanks for CO2 use for lease 6-12 months
- 10 23-25.5 for glycerin 6-12 months UP or CN MO to WY
- 10 CPC 1232 needed in Montreal 25.5 on the CN dirty to dirty negotiable
- 12 CPC 1232 needed in Georgia 25.5 on the CSX dirty to dirty negotiable
- 75 340W Dirty to Dirty last LPG – Needed in Canada UP April 2021 negotiable
- 30 5400-5800 286 Hoppers needed in Texas off the BN for grain 2 years negotiable
- 10 Veg Oil tanks 30K needed in Mexico off the BN for 2 years negotiable
- 5100 CU FT plus hoppers needed in the Midwest off the BN or UP negotiable
PFL is offering:
- Various tank cars for lease with dirty to dirty service including, nitric acid, gasoline, diesel, crude oil, Lease terms negotiable,
- 50 CPC 1232 cars in Texas clean last petroleum lease negotiable
- Short and long term opportunities available clean cars are available 1-5 years scattered across the country. Various last commodities. Leases on 117Js and 117Rs, dirty to dirty for sublease,
- 450 117Js 28.3 C/I for sale or lease in Texas
- 50 CPC 1232 28.3 tanks clean last veg oil various locations negotiable
- 200 CPC 1232 Compliant 25.5’s C/I for sale or lease
- 100 65 ft. bulkhead flat cars, for sale or lease
- 200 30K tankers cleaned and ready for service, for sale or lease,
- 100 5650 PD hoppers brand new 65 ft, lease only, available in 30 days,
- 218 73 ft 286 GRL riserless deck, center part for sale,
- 28 auto-max II automobile carrier racks – tri-level for sale,
- 100 65’ 100 ton log cars for lease, various locations,
- 10 food grade 14.3 tanks lined for phosphoric acid for sale in Louisiana,
- 49 60’ Box cars 286 EOL refurbished in Tenn.,
- 132 286 GRL DOT111s coiled and insulated 29K Gal for sale
- 20 low sided gondolas for lease in NJ 2743 cu ft,
- 100 34.2 Gallon Dot 111 for lease great for Ethanol or Alcohol
- 20 food grade stainless steel cars
- 50-80 117J or Rs 28K BN, UP, CN, Diesel dirty multiple locations negotiable
- 100 CPC1232 28.3 gal in Montana crude dirty BNSF negotiable
- 30 111A 30K clean Texas BNSF last ethanol negotiable
- 30 CPC 1232 25.5K Pennsylvania NS clean negotiable
- 10 CPC 1232 23.5 K W Michigan Calcium Chloride dirty negotiable
- 175 117R s or Js 30K Diesel or gasoline dirty to dirty Texas lease negotiable
- 50 300 series Pressure cars
- 100 CPC1232 28K Crude dirty to dirty CN Alberta lease negotiable
- 40 GP 20K in Southeast CSX clean last soap negotiable
- 140 117R 30.3 Dirty Ethanol located east and Midwest, lease negotiable
- 25 117J 25.5 New Texas UP and BN lease negotiable
- 110 2494 CU FT Gondolas for sales or lease 286 GRL in Montana UP negotiable
- PFL has a number of steel and aluminum hoppers for various commodities for sale, Sand cars, box cars, coal cars and hoppers including sugar covered hoppers and plastic pellet cars, are also available for sale or lease in various locations.
Call PFL today to discuss your needs and our availability and market reach. Whether you are looking to lease cars, lease out cars, buy cars or sell cars call PFL today 239-390-2885
PFL offers turn-key solutions to maximize your profitability. Our goal is to provide a win/win scenario for all and we can handle virtually all of your railcar needs. Whether it’s loaded storage, empty storage, subleasing or leasing excess cars, filling orders for cars wanted, mobile railcar cleaning, blasting, mobile railcar repair, or scrapping at strategic partner sites, PFL will do its best to assist you. PFL also assists fleets and lessors with leases and sales and offers Total Fleet Evaluation Services. We will analyze your current leases, storage, and company objectives to draw up a plan of action. We will save Lessor and Lessee the headache and aggravation of navigating through this rapidly changing landscape.
PFL IS READY TO CLEAN CARS TODAY ON A MOBILE BASIS WE ARE CURRENTLY IN EAST TEXAS
Live Railcar Markets
| CAT | Type | Capacity | GRL | QTY | LOC | Class | Prev. Use | Clean | Offer | Note |
|---|