
“Keep your eyes on the stars, and your feet on the ground.” – Theodore Roosevelt
Jobs Update
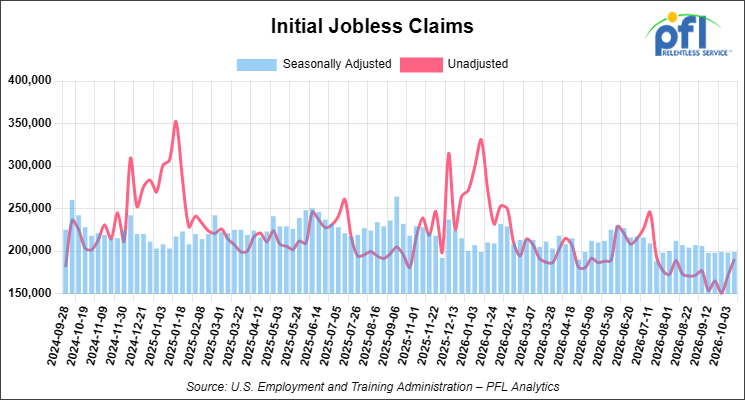
Initial jobless claims seasonally adjusted for the week ending October 10, 2026 came in at 199,000, versus the adjusted number of 198,000 people from the week prior, up 1,000 people week-over-week.
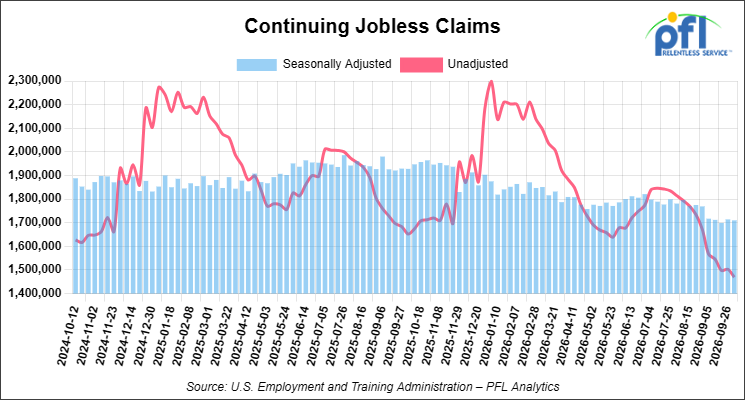
Continuing jobless claims came in at 1,710,000, versus the adjusted number of 1,714,000 people from the week prior, down 4,000 week-over-week.
Stocks closed lower on Friday of last week and mixed week-over-week
The DOW closed lower on Friday of last week, down -175.64 points (-0.24%), closing out the week at 52,002.05, up 347.10 points week-over-week. The S&P 500 closed lower on Friday of last week, down -84.60 points (-1.09%), and closed out the week at 7,659.46, down -152.08 points week-over-week. The NASDAQ closed lower on Friday of last week, down -572.99 points (-2.14%), and closed out the week at 26,140.03, down -1,226.14 points week-over-week.
In overnight trading, DOW futures traded higher and are expected to open at 52,216 this morning, up 2 points from Friday’s close.
Crude oil closed higher on Friday of last week and higher week-over-week
West Texas Intermediate (WTI) crude closed up $3.44 per barrel (3.5%), to close at $101.41 on Friday of last week, and up $9.56 per barrel week-over-week. Brent crude closed up $3.94 per barrel (3.7%), to close at $109.86, and up $5.14 per barrel week-over-week.
One Exchange WCS (Western Canadian Select) for November delivery settled on Friday of last week at US$26.95 below the WTI-CMA (West Texas Intermediate – Calendar Month Average). The implied value was US$74.46 per barrel.
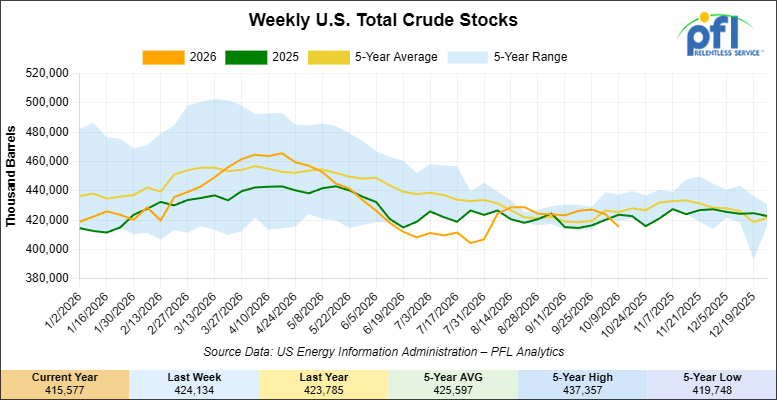
U.S. commercial crude oil inventories (excluding those in the Strategic Petroleum Reserve) decreased by 8.6 million barrels week-over-week. At 415.6 million barrels, U.S. crude oil inventories are 2% below the five-year average for this time of year.
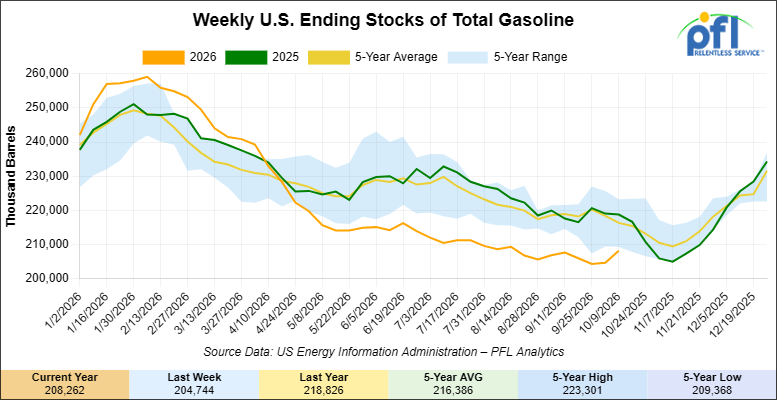
Total motor gasoline inventories increased by 3.5 million barrels week-over-week. and are 4% below the five-year average for this time of year.
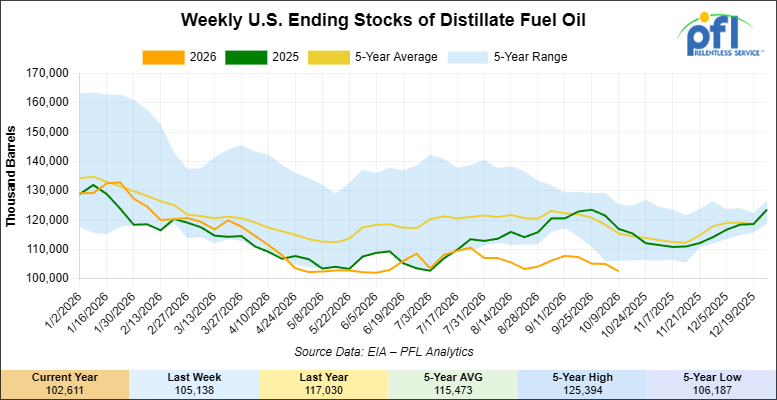
Distillate fuel inventories decreased by 2.5 million barrels week-over-week. and are 11% below the five-year average for this time of year.
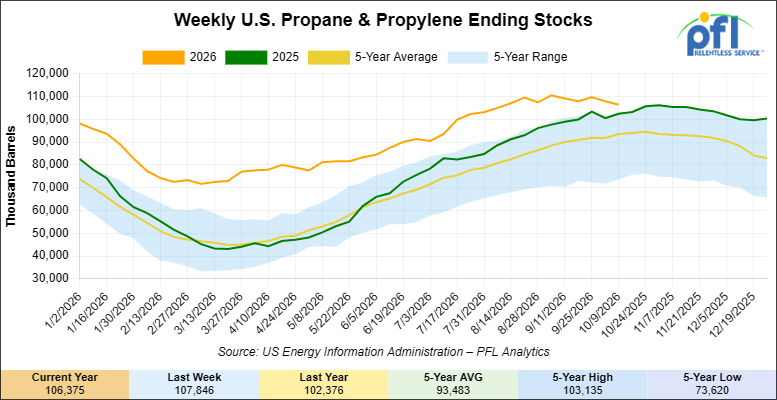
Propane/propylene inventories decreased by 1.5 million barrels week-over-week. and are 14% above the five-year average for this time of year.
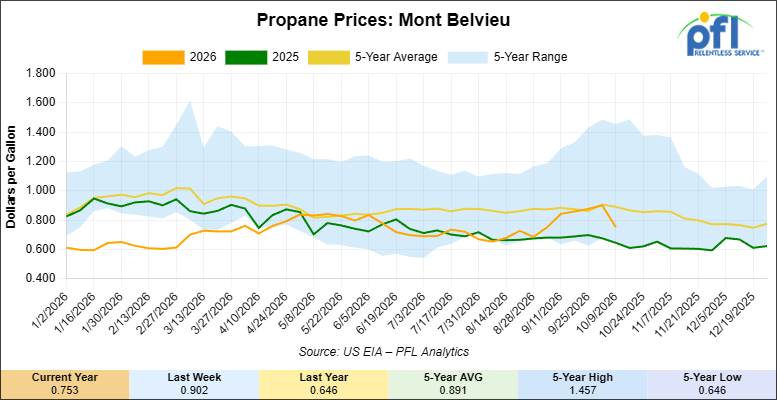
Propane prices closed at 75.3 cents per gallon on Friday of last week, down 14.9 cents per gallon week-over-week, but up 10.7 cents year-over-year.
Overall, total commercial petroleum inventories decreased by 13.4 million barrels week-over-week during the week ending October 9, 2026.
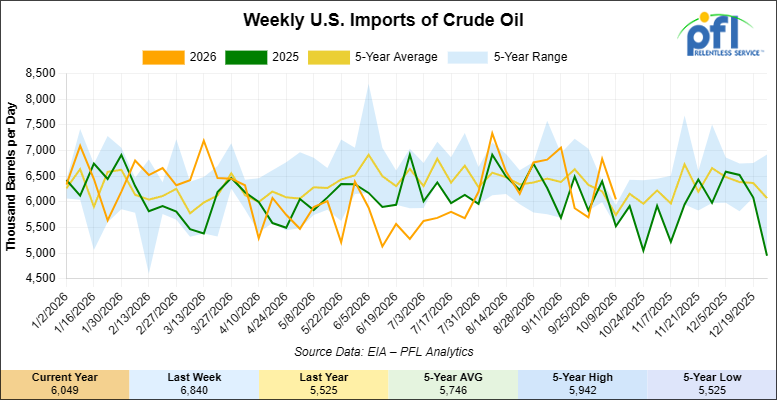
U.S. crude oil imports averaged 6.0 million barrels per day during the week ending October 9, 2026, a decrease of 791,000 barrels per day week-over-week. Total motor gasoline imports (including both finished gasoline and gasoline blending components) averaged 508,000 barrels per day, and distillate fuel imports averaged 145,000 barrels per day during the week ending October 9, 2026.
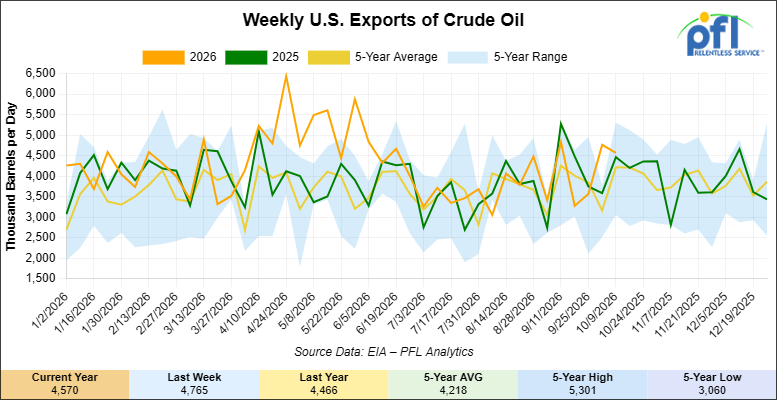
U.S. crude oil exports averaged 4.57 million barrels per day during the week ending October 9, 2026, a decrease of 195,000 barrels per day week-over-week. Over the past four weeks, crude oil exports averaged 4.047 million barrels per day.
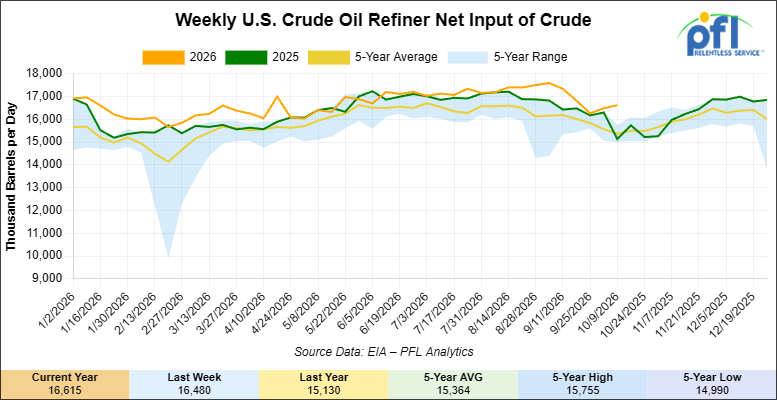
U.S. crude oil refinery inputs averaged 16.6 million barrels per day during the week ending October 9, 2026, which was 135,000 barrels per day more week-over-week.
WTI is poised to open at $98.31, down -$0.71 per barrel from Friday’s close.
North American Rail Traffic
Week Ending October 14, 2026:
Total North American weekly rail volumes were up (+6.79%) in week 42, compared with the same week last year. Total Carloads for the week ending October 14, 2026 were 333,648, up (+2.96%) compared with the same week in 2025, while weekly Intermodal volume was 367,691, up (+10.52%) year over year. 10 of the AAR’s 11 major traffic categories posted year-over-year increases. The only decrease came from Farm Products (-4.70%). The largest increase was Petroleum & Petroleum Products (+10.69%).
In the East, CSX’s total volumes were up (+4.96%), with the largest decrease coming from Nonmetallic Minerals (-5.17%), while the largest increase came from Grain (+15.91%). NS’s total volumes were up (+5.75%), with the largest increase coming from Coal (+17.97%), while the largest decrease came from Grain (-6.54%).
In the West, BNSF’s total volumes were up (+9.42%), with the largest increase coming from Metallic Ores and Metals (+19.62%), while the largest decrease came from Coal (-13.44%). UP’s total volumes were up (+11.05%), with the largest increase coming from Intermodal Units (+19.36%), while the largest decrease came from Farm Products (-13.66%).
In Canada, CN’s total volumes were down (-9.58%), with the largest increase coming from Petroleum & Petroleum Products (+15.75%), while the largest decrease came from Other (-39.48%). CPKCS’s total volumes were up (+7.58%), with the largest increase coming from Other (+33.33%), while the largest decrease came from Motor Vehicles and Parts (-20.73%).
Source Data: AAR – PFL Analytics
North American Rig Count Summary
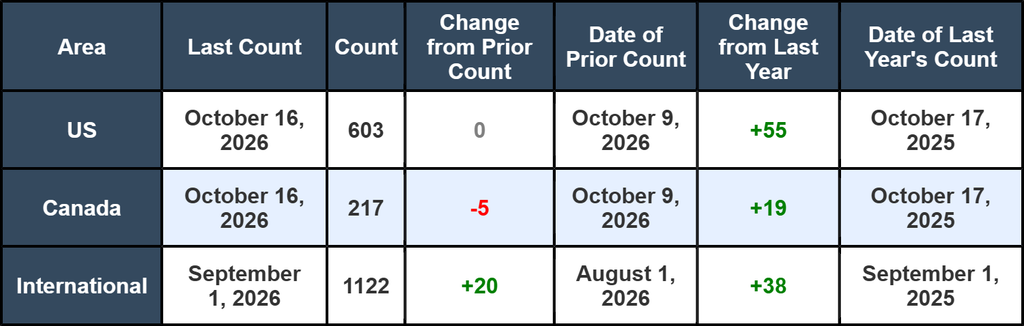
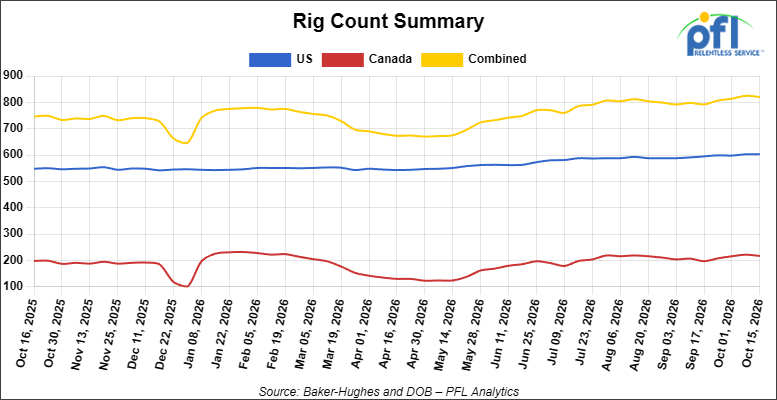
North American rig count was down by -5 rigs week-over-week. The U.S. rig count was unchanged week-over-week, and up by +55 rigs year-over-year. The U.S. currently has 603 active rigs. Canada’s rig count was down by -5 rigs week-over-week, but up by +19 rigs year-over-year. Canada currently has 217 active rigs. Overall, year-over-year we are up by +74 rigs collectively.
We are watching a few things out there for you:
We Are Watching Petroleum Carloads
The four-week rolling average of petroleum carloads carried on the six largest North American railroads rose to 31,163 from 30,447 which was an increase of +716 rail cars week-over-week. Canadian volumes were higher. CPKC’s shipments were higher by +6.0% week-over-week, CN’s volumes were higher by +16.0% week-over-week. U.S. shipments were up across the board. The CSX had the largest percentage increase and was up by +7.0% week-over-week.
We Continue to Watch Our Strategic Petroleum Reserves
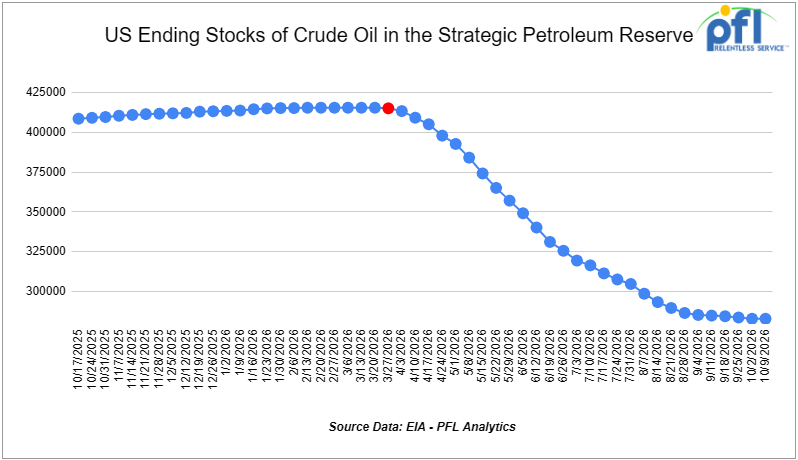
The ongoing emergency drawdown of the U.S. Strategic Petroleum Reserve (SPR) remains a major component of global efforts to offset crude oil supply disruptions stemming from the conflict involving Iran and the continued restrictions on oil shipments through the Strait of Hormuz. Since March, the Department of Energy (DOE) has awarded exchanges covering more than 133 million barrels of crude oil, with additional releases expected as part of a broader international response coordinated through the International Energy Agency (IEA).
The United States continues to execute its commitment to make available up to 172 million barrels from the SPR under the IEA’s collective plan to inject roughly 400 million barrels into global energy markets. Officials have argued that the releases are necessary to help stabilize crude supplies and limit further increases in fuel prices as refiners compete for replacement barrels amid ongoing transportation disruptions. The IEA’s coordinated action remains the largest emergency oil-stock release in the agency’s history.
Inventories in the SPR have declined to 282.983 million barrels, down from 415.442 million barrels at the start of the conflict with Iran and reaching their lowest level since October 1982. The SPR showed no change during the week ending October 2nd. Since the first SPR drawdown began, the United States has withdrawn approximately 132.081 million barrels, equivalent to an average of roughly 652,507 barrels per day through the week ending October 9, 2026.
Global petroleum inventories have also tightened considerably. The IEA has reported substantial draws in commercial crude and refined-product stockpiles across major consuming nations, underscoring the strain that the conflict has placed on world energy markets. While oil flows through the Strait of Hormuz have partially recovered from their initial near-shutdown, the IEA continues to identify significant uncertainty surrounding the pace and durability of the recovery.
The Administration continues to emphasize that the current program consists primarily of exchange agreements, rather than outright sales. Under these arrangements, companies receiving crude oil today are required to return the borrowed barrels in the future along with additional volumes as a premium.
We Continue to Watch Canadian Crude by Rail
The differential has done the work. Western Canadian Select at Hardisty as mentioned above closed on Friday of last week at $26.95 below the WTI-CMA (West Texas Intermediate – Calendar Month Average) for November delivery the lowest level since November 2023. The Alberta to U.S. Gulf Coast unit train rate moved up 53 cents to $17.26 a barrel for November, and Enbridge’s Hardisty-to-Houston heavy toll sits at $9.86. At $26 under, a unit train to the Gulf clears our $18 hurdle by roughly $8 a barrel on paper, the widest rail window since the apportionment months of 2023. The latest Canada Energy Regulator export figure is July’s 72,300 barrels per day; August should be out by the 23rd of October and will not yet show any of this.
The constraints are the usual ones and they have not changed: there are not many 117J crude cars available for Canadian heavy, builds run one to two years, lessors and the Class I railroads both want five-year commitments, and Trans Mountain’s January tranche only takes 90,000 barrels per day off the system. Fourth-quarter production at a record 5.15 million barrels per day with both export systems rejecting nominations says the pressure continues. This could be the beginning of another crude by rail cycle if the differential holds through the January Trans Mountain tranche; time will tell, and it is geopolitically dependent.
We Are Watching Delek
Vice President Vance used a campaign stop in Tyler, Texas last Tuesday to announce that the administration will use the Defense Production Act to expand Delek’s 74,000 barrel per day Tyler refinery. No capacity figure, no timeline and no capital number came with it, only “millions of gallons” of commercial and military-spec fuel and “hundreds” of jobs. A White House official said afterward that Tyler is one of “many refineries” the administration is working with, and that the money would most likely come from the $1 billion fund Congress created in last year’s tax and energy law. Delek had not commented as of Friday of last week. The same law was used in March to force the restart of the Sable Offshore pipeline in California, so this is the second time the Act has been pointed at downstream infrastructure this year.
The rail angle is direct. Tyler has no product pipeline out of its local market; by Delek’s own annual report, everything the plant makes leaves by truck or rail. Any incremental distillate, gasoline or LPG from an expansion goes into tank cars or onto East Texas highways, and at current diesel prices the highway option is not the cheap one. Delek Logistics operates the terminal and pipeline assets around the plant.
Refiners hardly need financial encouragement right now. But, what they do need is less punitive regulation! The Gulf Coast 3-2-1 crack averaged a record $71.96 a barrel in the week ended October 8th and U.S. utilization hit 93.5% last week, up nearly eight points year over year. Debottlenecking at the margin is what a $1 billion fund buys; expansions of any size could take years to engineer and permit, and Delek’s last Tyler expansion, 10,000 barrels per day for about $70 million, took the better part of a year back in 2015. We need to see a lot more refining capacity here in the U.S. and we at PFL will be watching this one.
We Continue to Watch Left Wing Carney
Alberta votes today on ten referendum questions, the last of which asks whether the province should start the constitutional process toward a binding vote on separating from Canada. Prime Minister Carney spent Thursday of last week in Calgary urging Albertans to stay, official results come October 29th. Two weeks after standing in Fort McMurray to designate Pacific Link a project of national interest, the Prime Minister is campaigning on a pipeline that will not move a barrel before 2032. Métis leaders in the oil sands region said Tuesday of last week in Fort McMurray that they were never consulted and were not invited to the October 1st announcement, and the Cold Lake First Nations judicial review we flagged last week is still in front of the court.
Meanwhile the barrels are here now. Western Canadian Select at Hardisty finished last week at $26.95 under WTI, the widest discount since November 2023, with fourth-quarter western Canadian production forecast at a record 5.15 million barrels per day and both Enbridge’s Mainline and Trans Mountain recently rejecting nominations. Trans Mountain’s next 90,000 barrels per day of capacity arrives in January, and after that there is nothing until Pacific Link. Producers are not waiting on Ottawa: Cenovus agreed on October 5th to buy Athabasca Oil for C$5.7 billion, its second oil sands takeout in two years, Suncor sold it’s Atlantic Canada offshore interest to Ithaca for C$1.2 billion to refocus on the oil sands, and 65% of executives in ATB Capital Markets’ fall survey expect production to exceed pipeline capacity before 2030. PFL expects it sooner than 2030. Cenovus’s own sensitivity puts a $1 move in the WCS discount at C$80 million of cash flow, and the discount has widened roughly $12 since the third-quarter average, close to a billion dollars of annualized cash flow for one producer.
Industry is applauding the permitting overhaul in Bill C-39 and the immediate write-off in the Productivity Mega Deduction, and Enbridge’s chief executive said the reforms signal that Canada is serious about building again. That is the same Enbridge that spent $600 million on Northern Gateway before the same party in Ottawa killed it in 2016, and the price of the lost decade is being paid at Hardisty every day the discount sits in the twenties. Folks, a referendum on leaving the country is what you get after ten years of telling Alberta to wait; the pipeline announcement came a decade late. We are watching this one but consensus is Alberta will not vote to separate but polls have been wrong before as we all know.
We Continue to Watch Enbridge
The Wisconsin Department of Natural Resources issued Enbridge a formal Notice of Violation last Tuesday covering seven alleged violations on the $1 billion, 41-mile Line 5 reroute through Ashland and Iron counties between March 30th and September 21st: water quality, navigable waterways, wetlands, air, stormwater and endangered resources. The notice takes in the August 25th Saxon leak that put more than 1.3 million gallons of natural gas liquids into the air, the largest pipeline release in Wisconsin history, and the unpermitted bypass Enbridge built around the spill site afterward. The next step is an enforcement conference, after which the DNR can issue citations or refer the file to the Wisconsin Department of Justice.
The notice landed the morning after a second fire. Early last Monday a horizontal directional drill rig and its support equipment were destroyed in Ashland County; Enbridge called it vandalism and reported graffiti at the site, and the September 17th fire on the same project was already in the hands of the FBI and ATF. The September 28th groundwater release at the Marengo River crossing, flowing at 85 to 100 gallons a minute by Earthjustice’s account, remains under DNR investigation, and the Bad River Band has declared a disaster and renewed its call for a shutdown. Two-thirds built against a 2026 in-service target, the reroute now carries an open federal arson investigation, an aquifer breach and a state enforcement file at the same time.
Line 5 moves 540,000 barrels per day of light crude and natural gas liquids from Superior across Michigan to Sarnia, with propane coming off at Rapid River in the Upper Peninsula, and every month the reroute slips is another month the Bad River crossing stays in federal court. Our read is that a Line 5 interruption of any length would land first on propane and NGL supply in the Upper Midwest and Ontario, and the pressure car fleet is the only backstop that exists. Problem is – there are no pressure cars available! Enbridge is separately advancing the 150,000 barrel per day Mainline Optimization Project 1 while the Mainline itself turns away nominations, which is the clearest statement yet of where the capacity actually is. We are watching this one but dont believe as long as Trump is President line 5 isn’t going anywhere.
We Continue to Watch Diesel
U.S. retail diesel averaged $6.179 a gallon in the week ended October 12th, down 2 cents on the week and 35 cents below the September 21st record of $6.529, but still $2.54 above a year ago. The relief is not coming from inventory. Last Thursday’s EIA report put distillate stocks at 102.6 million barrels, down 2.5 million on the week, 12% below the five-year average and the lowest level for this time of year on record. Atlantic Coast stocks were 32% below the seasonal average in September and EIA expects them to stay 20% to 30% below through the winter; Gulf Coast ULSD was back at $4.87 a gallon on Tuesday of last week, more than double a year ago.
Washington’s answer so far is a Russian diesel deal and a stock release. Russia agreed on October 9th to put 300,000 tonnes of diesel on the market immediately, another 500,000 in November and a million after that; Treasury issued a license good through April 2027, loadings resumed at Primorsk on Wednesday of last week with the first cargo headed to Morocco, and the President clarified on Tuesday of last week that the deal “is not for us.” The IEA said on Thursday of last week that members would accelerate the remainder of the March stock release, including more than 20 million barrels of diesel, with no firm timetable. Russia’s October tranche is less than a day of U.S. diesel consumption; what it can do is free up Gulf Coast barrels now going to Brazil, where the U.S. share of diesel imports jumped to 74% in September from 38% in June after Russia’s export ban.
None of it touches the cause. Two cargo ships were sunk in the Strait of Hormuz on Wednesday and Thursday of last week, more than 20 vessels have been attacked this month, and crude exports through the strait were running 8.5 million barrels per day, about 40% below pre-war. With refiners at 93.5% utilization and Hormuz flows 40% below pre-war, winter distillate inventories depend on exports and the weather, not on anything announced from a podium. The railroads’ own third-quarter review credited diesel, together with trucking’s driver shortage and insurance costs, for a record intermodal quarter, which is the one part of this story the rail industry is enjoying.
We Continue to Watch Rail Car Storage
The industry’s October 1st storage count fell again, to the lowest share of the North American fleet since the spring of 2023 and the fewest cars parked in close to four years, with another several thousand cars pulled out of storage over the month. Tank cars are the laggard: they are stored at a materially higher rate than the fleet as a whole and still account for roughly a third of everything parked in North America. Covered hoppers, by contrast, are coming out of storage faster than the average as harvest demand builds, and intermodal and vehicle flats are effectively fully deployed.
A strong petroleum carload run and a tank fleet stored above the fleet average are not in conflict, because the stored tank fleet is largely the wrong cars: non-jacketed DOT-111s and CPC-1232s that aged out of flammable liquids service, and crude cars idle since 2020. Tank cars on line across the six Class I railroads averaged 255,022 over the four weeks beginning September 12th, down 0.6% on the prior period.
The replacement math has not improved. The BTS fleet report of September 30th counted DOT-117s at 76% of the flammable liquids fleet with about 2,800 cars planned for 2026 against the 4,247 a year needed to meet the December 31st, 2027 cutoff, and the ITC holds its staff conference on UTLX’s antidumping petition against Mexican-built tank cars on Wednesday. If duties land on Mexican-built cars on top of the April Section 232 steel tariff, the 2,800-car build plan gets more expensive, not bigger, and the stored CPC-1232s do not come back into flammable service. Call PFL today if you have an aging fleet and storage costs continue to mount there are options. If you are long 117J’s we do have homes for these cars.
We Continue to Watch the Harvest
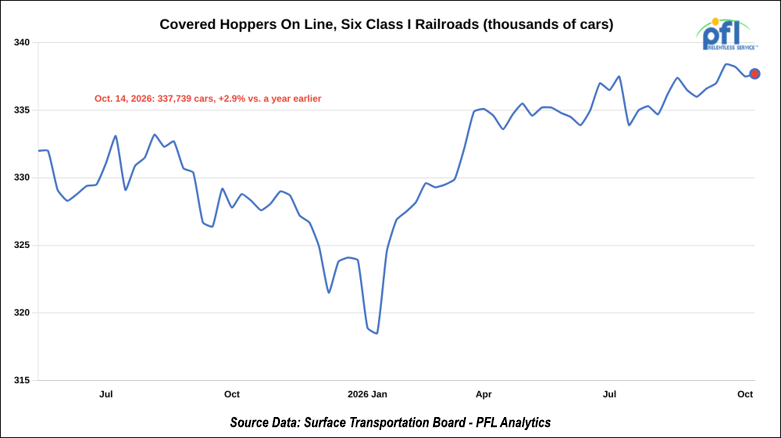
USDA’s crop progress report on Tuesday of last week put corn at 33% harvested as of October 11th against a 39% five-year average, and soybeans at 46% against a 50% five-year average. Iowa corn was only 14% in, Illinois was at 51% for corn and 48% for beans, and conditions held at 56% and 57% good-to-excellent. A dry week helped, but the wet second half of September is still in the numbers. Harvest is running roughly a week behind, which pushes peak covered hopper demand into November and stacks it on top of the unfilled grain car orders we flagged last week. Covered hoppers on line across the six Class I railroads were 337,739 in the week ended October 14th, 2.9% more than a year earlier and within a few hundred cars of the September peak. Grain is already the carload story of the year, with year-to-date volumes at levels not seen in three decades on the strength of exports, and the hoppers are going to be needed in the same six weeks everyone else needs them.
A late, wet crop is also a propane story. Mont Belvieu propane printed a four-year high last week, Houston-to-Chiba VLGC freight hit a five-month high of $345 a tonne, and Mideast Gulf LPG exports to Asia were 3 million barrels in September against 21 million a year earlier, which is why Asian buyers are back in the U.S. Gulf for November. A late corn harvest is the worst combination for Midwest propane: drying demand peaks exactly when export economics are pulling Gulf barrels to Asia.
We Are Watching Mexico
Mexico’s Chamber of Deputies voted last Tuesday to raise the federal duty on rail concessions to 3% of gross revenue from 1.25%, the first change since the 1990s privatizations and a 140% increase in one step. The higher rate applies only to concessions at least 16 years old, which is to say CPKC’s Mexican network and Grupo Mexico’s Ferromex, while the state-run Maya and Tehuantepec lines stay outside the 3% tier. The bill is part of the 2027 revenue package, the Senate has to finish the revenue side of the budget by October 31st, and the new rate takes effect January 1st. CPKC’s own filings describe the 1.25% duty as an operating expense on its Mexican franchise; the government’s position is that the duty is a trivial share of operator costs and will not move freight rates.
The railroads see it differently. The Mexican rail association says the sector has invested $16 billion over 28 years and that security and cargo protection already cost about 3% of revenue, and Grupo Mexico Transportes is lobbying for the same fuel-tax credit trucking receives in exchange, along with a phased, inflation-linked increase instead of 140% overnight. Rail carries 27% of Mexico’s land freight at roughly 4.4 cents a short ton-mile against 4 to 5 cents on a U.S. Class I. Our read is that the cost lands on cross-border shippers one way or another; CPKC did not pay $31 billion for Kansas City Southern to absorb a 1.75-point revenue levy on the Mexican piece of it.
The second Mexican item is regulatory. The energy regulator CNE published rules on Wednesday of last week, effective Thursday, capping permit terms for applications that were still pending when the new hydrocarbons law took effect: marketing permits for refined products, LPG and natural gas are capped at two years, non-pipeline transport at 15 years and storage at 30, and the regulator now has to justify the term it grants in each case. For a tank car shipper moving product or LPG south, a two-year marketing permit is a hard thing to match against a five-year lease. The demand is there: private importers took 101,900 barrels per day of diesel in January through August, up 10%, while Pemex’s own imports fell 8%, and Mexico’s LPG price cap sat at a three-year high last week with delivered propane up 6% in a week.
We Are Watching Key Economic Indicators
Producer Price Index
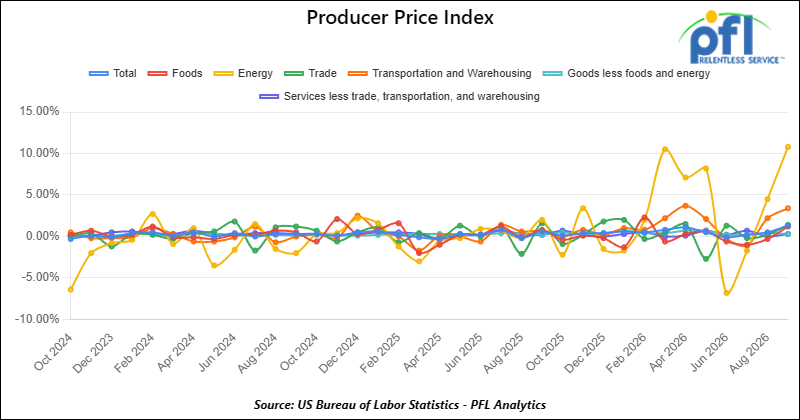
In September 2026, the Producer Price Index (PPI) for final demand increased 1.3% month-over-month, accelerating from a revised 0.5% increase in August, indicating a significant acceleration in producer price pressures. Core PPI (final demand less foods, energy, and trade services) increased 0.5% month over month, up from August’s 0.3% increase, indicating that underlying producer-price pressures also strengthened. The monthly increase was driven primarily by goods, which rose 2.6%, while services increased 0.8%. Within goods, energy prices surged 10.8%, while food prices rose 1.2% and goods less foods and energy increased 0.3%. Within services, trade margins and transportation costs contributed to higher prices, with transportation and warehousing services increasing 3.4%. Overall, the September data showed that rising energy costs drove a sharp increase in headline PPI, while higher prices across services also pointed to broader inflationary pressures. Final demand prices increased 6.3% over the 12 months ended in September, the largest annual increase since December 2022.
In September 2026, the Consumer Price Index (CPI) increased 0.6% month-over-month, accelerating from August’s 0.4% increase, while the index was up 3.7% year-over-year. Core CPI (all items less food and energy) increased 0.3% month-over-month, matching August’s pace, and was up 2.6% year over year. Energy prices were a major contributor to the monthly increase, with gasoline prices rising 9.1% and accounting for more than half of the overall monthly increase. The broader energy index increased 5.2% during the month, while shelter rose 0.4% and remained an important contributor to inflation. Food prices were unchanged overall, with food away from home increasing 0.2% and food at home declining 0.1%. Within core inflation, recreation, used cars and trucks, education, airline fares, medical care, and apparel increased, while communication prices declined. The September report showed renewed acceleration in headline inflation, driven largely by energy costs, while core inflation remained elevated, suggesting that broader price pressures persist alongside the renewed increase in fuel prices.
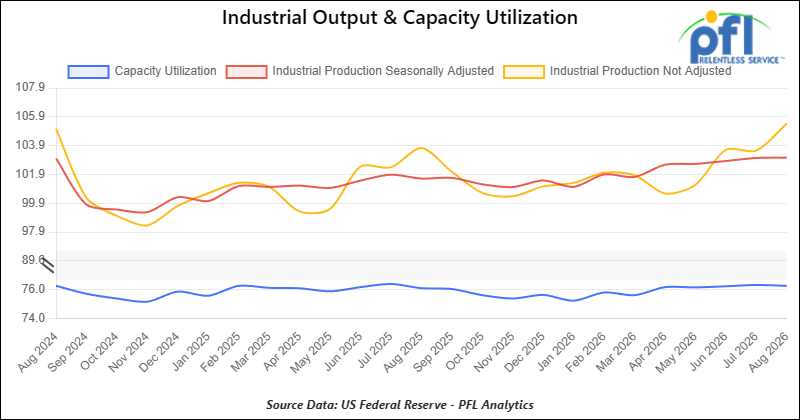
Industrial Output and Capacity Utilization
Manufacturing accounts for approximately 75% of total output. Industrial output in August increased 0.02% from July 2026.
Capacity utilization is a measure of how fully firms are using machinery and equipment. Capacity utilization in August decreased 0.08% from July 2026.
Lease Bids
- 300, 5200CF Covered Hoppers located off of CPKCS or CN in Canada. For use in Petcoke service. Period: 3 Year.
- 10-20, 3200 or 3281 Covered Hoppers located off of CN or CPKCS in Canada. For use in Sodium Sulphate service. Period: 3-5 years. Lined.
- 50-100, 29K 117, DOT 111, or CPC 1232 Tank located off of UP or BNSF in Minnesota, Kansas, or Oklahoma. For use in Fuel Oil service. Period: 6 Months. Nov-April.
Sales Bids
- 28, 3400CF Covered Hoppers located off of UP or BNSF in Texas. For use in Cement service. Cement Gates needed.
- 20, 17K DOT111 Tanks located off of various class 1s in various locations. For use in corn syrup service.
- 12, 21.5K-25K DOT 111 Tanks located off of various class 1s in Michigan. For use in Diesel, Asphalt, Crude service. Coiled and Insulated.
Lease Offers
- 15, 6200CF Covered Hoppers located off of all class 1s in Wisconsin. Last used in plastic. Cars are currently clean.
- 30, 6500CF Covered Hoppers located off of all class 1s in Wisconsin. Last used in plastic. Cars are currently clean.
- 50, 30K DOT117J Tanks located off of UP or BNSF in the South. Last used in ethanol.
- 93, 31.8K CPC 1232 Tanks located off of Various Class 1s in Texas. Last used in Diesel. Cars are currently clean.
- 30, 25.5K DOT 117J Tank located off of BNSF and UP in Texas. Last used in Benzene. NO BOV, NO LINER.
- 21, 20K DOT 111 Tank located off of BNSF and UP in Texas. Cars are currently clean. Cars are currently clean. C/I, NO Liner.
- 1000, 31.8K CPC 1232 Tank located off of BNSF and UP in Texas. Last used in Diesel.
Sales Offers
- 81, 31.8K CPC1232 Tanks located off of UP or BNSF in TX. Last used in Multiple Services. Requal Due in 2025.
- 15, 5750 CF Hopper located off of CSX, NS, CPKCS, CN, BNSF, UP in St Louis. Last used in Grain.
- 50, 30 DOT 111 Tank located off of multiple class 1s in multiple location. Last used in Fuels.
Call PFL today to discuss your needs and our availability and market reach. Whether you are looking to lease cars, lease out cars, buy cars, or sell cars call PFL today at 239-390-2885
Railcar for Sale or Lease
| CAT | Type | Capacity | GRL | QTY | LOC | Class | Prev. Use | Offer | Note |
|---|
| CAT | Type | Size | GRL | QTY | LOC | Class | Term | Commodity | Offer | Note |
|---|
| CAT | Type | Capacity | GRL | QTY | LOC | Class | Prev. Use | Clean | Offer | Note |
|---|
| CAT | Type | Capacity | GRL | QTY | LOC | Class | Commodity | Offer | Note |
|---|
PFL will be at the Following Conferences

- Where: The Westin Galleria Dallas
- Attending: David Cohen (954-729-4774), and Curtis Chandler (239-405-3365)
- Conference Website

- Where: The Westin Galleria Dallas
- Attending: Brian Baker (239.297.4519)
- Conference Website