“There are no secrets to success. It is the result of preparation, hard work, and learning from failure”
– Colin Powell
COVID-19
The United States currently has 22,917,334 confirmed COVID 19 cases and 383,275 confirmed deaths.
US Jobless Claims
New US jobless claims fell for a third straight week but remained near 800,000, as many businesses struggle under renewed curbs following a COVID-19 resurgence and lockdowns in certain parts of the country.
The Department of Labor tallied a seasonally adjusted 787,000 initial applications for unemployment benefits in the seven days that ended on January 2, compared with 790,000 during the week that included Christmas. The latest figure came in below economists’ forecast for 815,000 new claims.
Continuing claims fell for a fourth straight week. There were 5.1 million Americans actively collecting state jobless aid by December 26, down from 5.2 million.
Pandemic Unemployment Assistance, a federal program that provides benefits to the self-employed and others who would not qualify for regular benefits, took in 161,460 new claims last week on an unadjusted basis. That was down from 310,462 a week earlier.
Markets up Big Week over Week
The Dow closed higher on Friday of last week, up +56.84 points (+0.18%) closing out the week at 31,097.97 points, up 491.49 points week over week. The S&P 500 closed higher on Friday of last week, up +20.09 points (+0.55%) closing out the week at 3,824.68 points, up 68.61 points week over week. The Nasdaq Composite closed higher as well on Friday of last week, up +134.5 points (+1.03%) closing out the week at 13,201.98 points, up 313.70 points week over week.
In overnight trading, DOW futures traded lower and are expected to open down this morning 203 points.
Oil had a great week as OPEC’s Saudi Arabia cuts production
In an OPEC meeting last Tuesday the Saudi’s presented an oil cut of its own production by 1 million barrels per day. Saudi Arabia presented its voluntary cut, which will see the countries January target of 9.119 million barrels per day shrink to 8.125 million barrels per day, as a pre-emptive action to guard against any dip in demand. As a result oil rallied and had a great week. WTI crude oil for February delivery rose $1.90 to $52.73 per barrel Friday of last week up $4.21 per barrel week over week. Brent crude oil for March delivery rose $1.61 to $55.99 a barrel up $4.19 a barrel week over week.
U.S. commercial crude oil inventories decreased by 8.0 million barrels from the previous week. At 485.5 million barrels, U.S. crude oil inventories are 9% above the five year average for this time of year. Total motor gasoline inventories increased by 4.5 million barrels last week and are at the five year average for this time of year. Finished gasoline inventories decreased while blending components inventories increased last week. Distillate fuel inventories increased by 6.4 million barrels last week and are 4% above the five year average for this time of year. Propane/ propylene inventories decreased by 2.4 million barrels last week and are about 6% below the five year average for this time of year. Total commercial petroleum inventories increased by 1.7 million barrels last week.
U.S. crude oil imports averaged 5.4 million barrels per day last week, up by 43,000 barrels per day from the previous week. Over the past four weeks, crude oil imports averaged about 5.4 million barrels per day, 18.1% less than the same four-week period last year. Total motor gasoline imports (including both finished gasoline and gasoline blending components) last week averaged 445,000 barrels per day, and distillate fuel imports averaged 302,000 barrels per day.
Oil is lower in overnight trading. WTI is poised to open at $51.80, down 44 cents per barrel from Friday’s close.
Rig Count
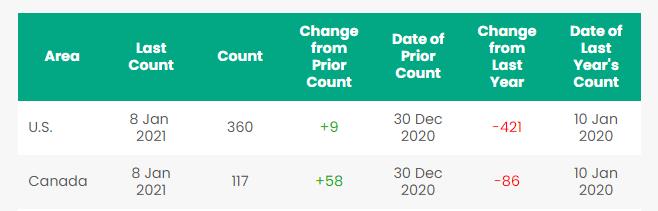
North America rig count is up by 67 Rigs week over week. The U.S. gained 9 rigs week over week. The U.S. currently has 360 active rigs. Canada’s rig count was up by 58 rigs week over week and Canada’s overall rig count jumped to 117 active rigs. Year over year we are down 507 rigs collectively.
North American Rail Traffic
Total North American rail volumes were up 1.3% year over year in week 53 (U.S. +1.9%, Canada -0.1%, Mexico -2.6%), resulting in fourth quarter volumes that finished up 3.0% and 2020 volumes that finished down 6.7% (U.S. -7.2%, Canada -4.1%, Mexico -9.8%). 7 of the AAR’s 11 major traffic categories posted year over year increases with the largest increases coming from intermodal (+8.1%) and grain (+30.8%). The largest decreases came from coal (-20.0%) and nonmetallic minerals (-11.6%). Note: Due to the extra week of data in 2020, the year over year comparison used was week 1 of 2020.
In the East, CSX’s total volumes were up 3.1%, with the largest increases coming from intermodal (+11.0%) and chemicals (+4.9%). The largest decrease came from coal (-19.9%). NS’s total volumes were up 3.7%, with the largest increase coming from intermodal (+12.0%). The largest decrease came from coal (-21.8%).
In the West, BN’s total volumes were up 2.2%, with the largest increases coming from intermodal (+17.7%) and grain (+25.7%). The largest decreases came from coal (-27.3%), petroleum (-30.6%) and stone sand & gravel (-33.5%). UP’s total volumes were up 1.4%, with the largest increases coming from grain (+37.2%) and intermodal (+2.6%). The largest decreases came from coal (-35.3%) and stone sand & gravel (-28.9%).
In Canada, CN’s total volumes were down 1.2%, with the largest decrease coming from petroleum (-33.9%). The largest increases came from intermodal (+6.1%) and grain (+39.6%). RTMs were down 4.5%. CP’s total volumes were up 1.9%, with the largest increases coming from farm products (+46.7%) and grain (+51.5%). RTMs were up 6.1%.
KCS’s total volumes were up 10.6%, with the largest increases coming from petroleum (+64.1%) and intermodal (+19.6%).
Source: Stephens
North American Rig Count Summary
Things we are keeping an eye on
1. Some Economic Indicators
i:) GDP– Folks this is tough one – Biden says one of the first items he will address when he assumes power on January 20th is the Trump tax cuts. It’s not a matter of if Biden will increase taxes and regulations it is a matter of when he will do it. Will these tax increase be retroactive to January 1, 2021? No one knows but the economy right now is fragile. If we see an increase in taxes and regulations too soon it could be problematic for the U.S. economy. U.S. GDP fell an annualized 31.4% in Q2 2020 and rose 33.4% in Q3 2020. We’re now in Q1 2021, but it’s still not clear how the economy did in Q4 2020. The consensus of a December 2020 survey of economists by the Wall Street Journal says +4.1%. The Federal Reserve Bank of Atlanta’s January 7 “GDPNow” forecast says 8.5%. The January 8 “Nowcasting” estimate from the Federal Reserve Bank of New York says 2.2%. The first official estimate from the Bureau of Economic Analysis will be released on January 28. In terms of Q1 2021 growth, a WSJ panel predicts 1.9% growth; Nowcasting says 5.5%. Economists who think Q1 growth will be very low point to the impact of recent extremely high COVID-19 counts and accompanying widespread restrictions on business and personal activity.
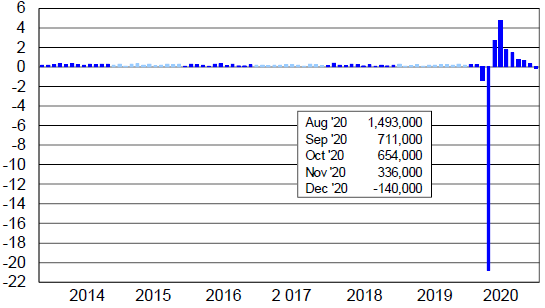
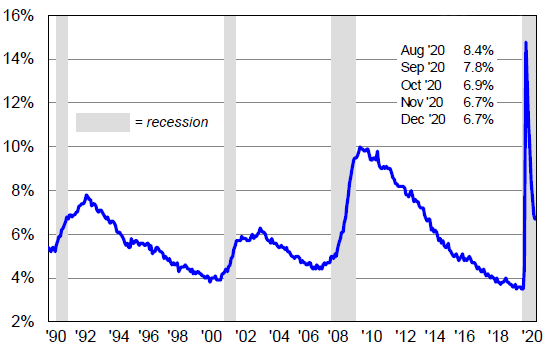
ii:) U.S. unemployment – Folks we actually lost jobs in December of 2020.A preliminary 140,000 net jobs were lost in December 2020 from November 2020. Job losses were large in March and unprecedented in April. May and June saw big job gains, but after June the job gains got smaller and smaller each month and finally turned negative in December. Job losses in December were paced by a nearly half million lost jobs in leisure and hospitality, mostly at bars and restaurants. There were 9.8 million fewer jobs in December 2020 than in February 2020. The December-to- December job loss for 2020 was 9.4 million, a new record that easily exceeded the 5.1 million jobs lost in 2009. In December 2020, the unemployment rate was 6.7%, the same as in November. It was 3.5% in February and 14.8% in April. (See Charts below)
Net New U.S. Jobs Created January 2014- December 2020 (millions)
U.S. Unemployment Rate Since 1990
iii:) Consumer Confidence- Is down again and given the events of last week we expect to see lower numbers next month. The Conference Board’s index of consumer confidence fell to 88.6 in December, down from 92.9 in November. “Consumers’ assessment of current conditions deteriorated sharply in December.
iv:) Consumer Spending – Total U.S. consumer spending fell a preliminary 0.4% in November 2020 from October 2020. This is the first time it’s fallen since April 2020; spending fell on both goods (down 1.0%) and services (down 0.2%). Consumer spending accounts for around 70% of the economy, and this disappointing drop is just the latest sign that the surges in virus cases are sapping the economic recovery.
2) Crude by Rail Out of Canada
It looks as though crude by rail out of Canada is set to rebound in 2021. There is a tight heavy market out there right now. The Chinese and the U.S. are wanting more heavy. Inventories are increasing in Alberta and pipeline congestion is evident as detailed in our previous reports. Although more pipeline space is coming it is not coming soon enough and basis is widening with WCS closing at -14.95 against WTI on Friday. We expect basis to continue to widen as more production comes online and a possible resurgence for crude by rail especially for the producers of Alberta given the current higher price environment who have sunk costs on railcar leases, loading and take or pay transportation agreements on CP and CN. Enbridge’s line 3 pipeline760,000 barrel per day pipeline is expected to come online in the fourth quarter of 2021 and TC Energy Keystone XL’s 830,000 barrel per day pipeline is expected to come online in 2023.
3) Petroleum By Rail
The four week rolling average of petroleum carloads carried on the six largest North American railroads fell to 25,641 from 26,020 week over week. Canadian volumes were lower. CP shipments were down by 13.4% and CN volumes fell by 2.9%. U.S. rail road operators were mostly higher. UP had the largest percentage increase, up by 13.8%.
4) Rail Cars in storage
Continue to decline – see PFL rail car storage report issued today and contains the latest data.
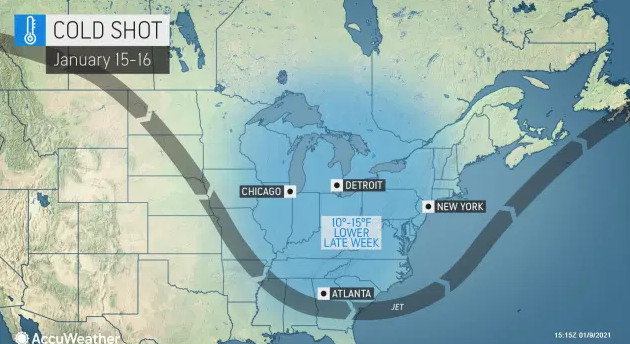
5) The Vortex is back folks
The initial cold push is expected to begin this week by January 15th expect to see temperatures 15-20 degrees below normal.
We have been extremely busy at PFL with return on lease programs involving rail car storage instead of returning cars to a shop. A quick turnaround is what we all want and need. Railcar storage in general has been extremely active. Please call PFL now at 239-390-2885 if you are looking for rail car storage, want to trouble shoot a return on lease scenario or have storage availability. Whether you are a car owner, lessor or lessee or even a class 1 that wants to help out a customer we are here to “help you help your customer!”
Railcar Markets
A sign of things getting better – leasing activity and inquiries have continued to be strong
PFL is seeking:
- 100 1232 23.5 tanks for asphalt in Quebec 6 months price negotiable
- 100 31.8K CPC 1232s or 30.3K 117R for the use of Gas and Diesel.
- 340W’s LPG pressure cars for various locations and lease terms,
- 50-90 263 or 286 GRL needed for corn syrup for purchase
- 50-60 Sulfuric acid cars 13.6 for purchase
- 40-50 molten Sulfur Cars 13.8 for purchase
- 15 500W tanks for CO2 use for lease 6-12 months
- 10 23-25.5 for glycerin 6-12 months UP or CN MO to WY
- 10 CPC 1232 needed in Montreal 25.5 on the CN dirty to dirty negotiable
- 12 CPC 1232 needed in Georgia 25.5 on the CSX dirty to dirty negotiable
- 75 340W Dirty to Dirty last LPG – Needed in Canada UP April 2021 negotiable
- 30 5400-5800 286 Hoppers needed in Texas off the BN for grain 2 years negotiable
- 50 1232 Tanks 28.3 for crude 6 months in Alberta on the CN price negotiable
- 10 Veg Oil tanks 30K needed in Mexico off the BN for 2 years negotiable
- 5100 CU FT plus hoppers needed in the Midwest off the BN or UP negotiable
- 35 lined 4000 cubic foot steel gondolas for Sulphur service. Needed in Alberta for 3-5 year lease
PFL is offering:
- Various tank cars for lease with dirty to dirty service including, nitric acid, gasoline, diesel, crude oil, Lease terms negotiable,
- 70 117Js available March in Texas dirty to dirty price negotiable
- 450 117Js 28.3 C/I for sale or lease in Texas
- 50 CPC 1232 28.3 tanks clean last veg oil various locations negotiable
- 200 CPC 1232 Compliant 25.5’s C/I for sale or lease
- 100 65 ft. bulkhead flat cars, for sale or lease
- 200 30K tankers cleaned and ready for service, for sale or lease,
- 100 5650 PD hoppers brand new 65 ft, lease only, available in 30 days,
- 218 73 ft 286 GRL riserless deck, center part for sale,
- 28 auto-max II automobile carrier racks – tri-level for sale,
- 100 65’ 100 ton log cars for lease, various locations,
- 10 food grade 14.3 tanks lined for phosphoric acid for sale in Louisiana,
- 49 60’ Box cars 286 EOL refurbished in Tenn.,
- 132 286 GRL DOT111s coiled and insulated 29K Gal for sale
- 20 low sided gondolas for lease in NJ 2743 cu ft,
- 100 34.2 Gallon Dot 111 for lease great for Ethanol or Alcohol
- 20 food grade stainless steel cars
- 50-80 117J or Rs 28K BN, UP, CN, Diesel dirty multiple locations negotiable
- 100 CPC1232 28.3 gal in Montana crude dirty BNSF negotiable
- 30 111A 30K clean Texas BNSF last ethanol negotiable
- 30 CPC 1232 25.5K Pennsylvania NS clean negotiable
- 10 CPC 1232 23.5 K W Michigan Calcium Chloride dirty negotiable
- 175 117R s or Js 30K Diesel or gasoline dirty to dirty Texas lease negotiable
- 50 300 series Pressure cars
- 100 CPC1232 28K Crude dirty to dirty CN Alberta lease negotiable
- 40 GP 20K in Southeast CSX clean last soap negotiable
- 140 117R 30.3 Dirty Ethanol located east and Midwest, lease negotiable
- 25 117J 25.5 New Texas UP and BN lease negotiable
- 110 2494 CU FT Gondolas for sales or lease 286 GRL in Montana UP negotiable
- PFL has a number of steel and aluminum hoppers for various commodities for sale, Sand cars, box cars, coal cars and hoppers including sugar covered hoppers and plastic pellet cars, are also available for sale or lease in various locations.
Call PFL today to discuss your needs and our availability and market reach. Whether you are looking to lease cars, lease out cars, buy cars or sell cars call PFL today 239-390-2885
PFL offers turn-key solutions to maximize your profitability. Our goal is to provide a win/win scenario for all and we can handle virtually all of your railcar needs. Whether it’s loaded storage, empty storage, subleasing or leasing excess cars, filling orders for cars wanted, mobile railcar cleaning, blasting, mobile railcar repair, or scrapping at strategic partner sites, PFL will do its best to assist you. PFL also assists fleets and lessors with leases and sales and offers Total Fleet Evaluation Services. We will analyze your current leases, storage, and company objectives to draw up a plan of action. We will save Lessor and Lessee the headache and aggravation of navigating through this rapidly changing landscape.
PFL IS READY TO CLEAN CARS TODAY ON A MOBILE BASIS WE ARE CURRENTLY IN EAST TEXAS
Live Railcar Markets
| CAT | Type | Capacity | GRL | QTY | LOC | Class | Prev. Use | Clean | Offer | Note |
|---|