
“You can be discouraged by failure, or you can learn from it. So go ahead and make mistakes, make all you can. Because, remember that’s where you’ll find success – on the far side of failure.” – Thomas J Watson
Jobs Update
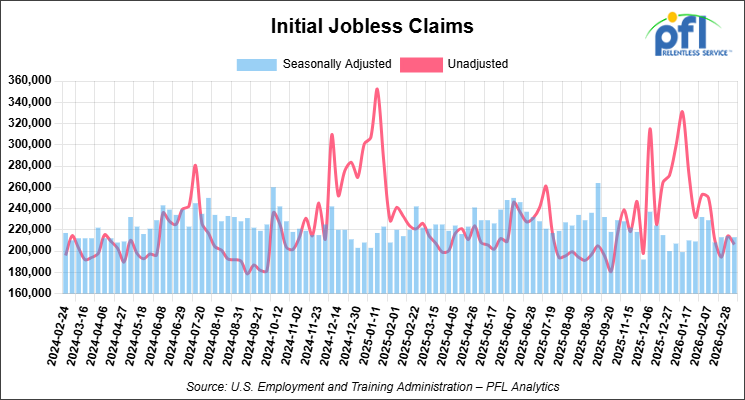
- Initial jobless claims seasonally adjusted for the week ending March 7, 2026 came in at 213,000, versus the adjusted number of 214,000 people from the week prior, down 1,000 people week over week.
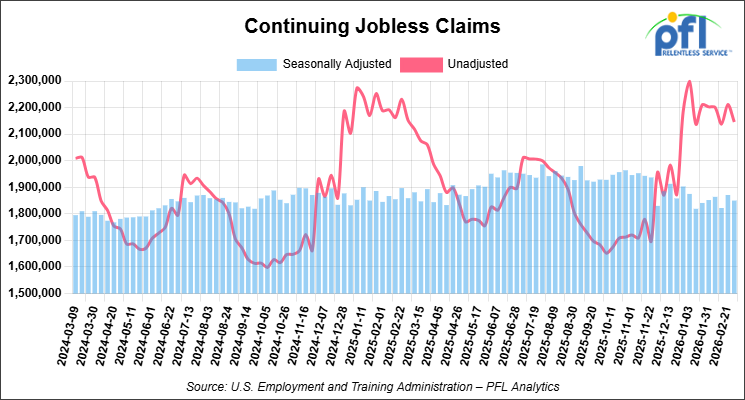
- Continuing jobless claims came in at 1,850,000, versus the adjusted number of 1,871,000 people from the week prior, down 21,000 week-over-week.
Stocks closed lower on Friday of last week and lower week-over-week
The DOW closed lower on Friday of last week, down -119.38 points (-0.26%), closing out the week at 46,558.47, down -943.08 points week-over-week. The S&P 500 closed lower on Friday of last week, down -40.43 points (-0.61%), and closed out the week at 6,632.19, down -107.83 points week-over-week. The NASDAQ closed lower on Friday of last week, down -206.62 points (-0.93%), and closed out the week at 22,105.36, down -282.32 points week-over-week.
In overnight trading, DOW futures traded higher and are expected to open at 46,952 this morning, up 66 points from Friday’s close.
Crude oil closed higher on Friday of last week and higher week-over-week
West Texas Intermediate (WTI) crude closed up 2.98 per barrel (3.11%), to close at $98.71 on Friday of last week, up $7.81 week-over-week. Brent crude closed up $2.68 per barrel (2.67%), to close at $103.14, and up $10.45 week-over-week.
One Exchange WCS (Western Canadian Select) for April delivery settled on Friday of last week at US$13.15 below the WTI-CMA (West Texas Intermediate – Calendar Month Average). The implied value was US$79.96 per barrel.
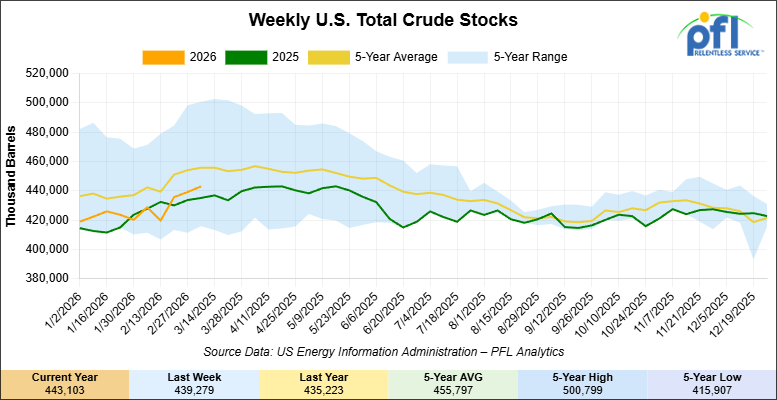
U.S. commercial crude oil inventories (excluding those in the Strategic Petroleum Reserve) increased by 3.8 million barrels week-over-week. At 443.1 million barrels, U.S. crude oil inventories are 2% below the five-year average for this time of year.
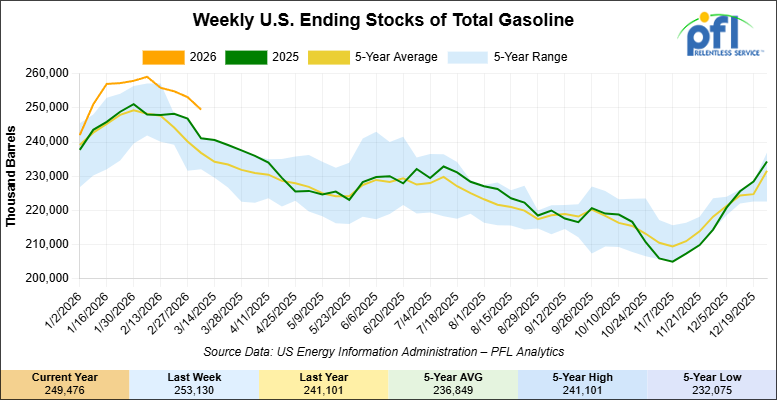
Total motor gasoline inventories decreased by 3.7 million barrels week-over-week and are 5% above the five-year average for this time of year.
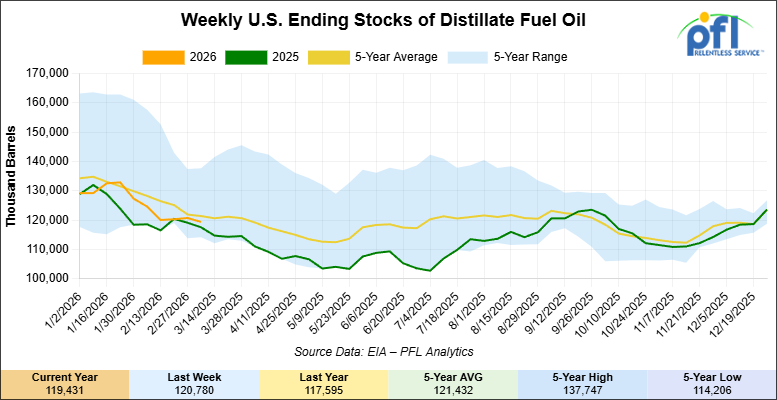
Distillate fuel inventories decreased by 1.3 million barrels week-over-week and are 2% below the five-year average for this time of year.
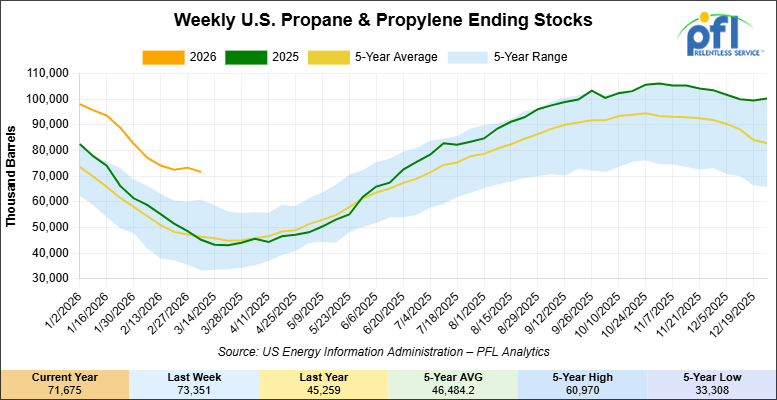
Propane/propylene inventories decreased by 1.7 million barrels week-over-week and are 53% above the five-year average for this time of year.
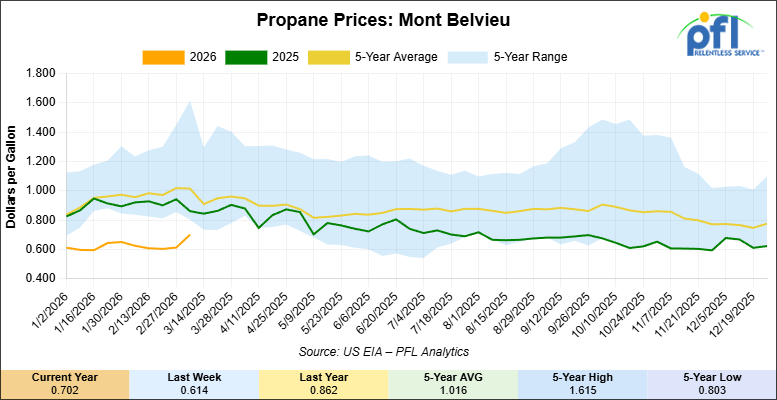
Propane prices closed at 70.2 cents per gallon on Friday of last week, up 8.8 cents per gallon week-over-week, but down 16 cents year-over-year.
Overall, total commercial petroleum inventories decreased by 2 million barrels week-over-week, during the week ending March 6, 2026.
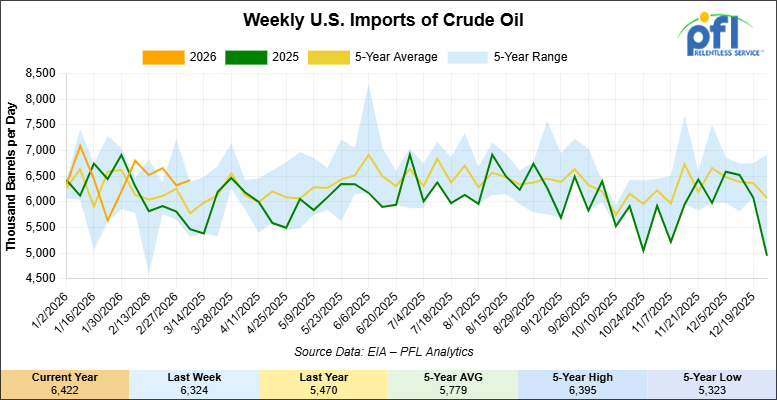
U.S. crude oil imports averaged 6.4 million barrels per day during the week ending March 6, 2026, an increase of 98,000 barrels per day week-over-week. Over the past four weeks, crude oil imports averaged 6.5 million barrels per day, 12.6% more than the same four-week period last year. Total motor gasoline imports (including both finished gasoline and gasoline blending components) averaged 542,000 barrels per day, and distillate fuel imports averaged 179,000 barrels per day during the week ending March 6, 2026.
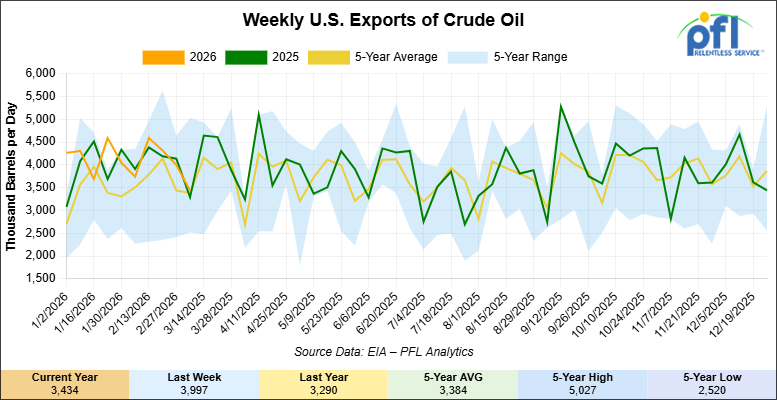
U.S. crude oil exports averaged 3.434 million barrels per day during the week ending March 6, 2026, a decrease of 563,000 barrels per day week-over-week. Over the past four weeks, crude oil exports averaged 4.084 million barrels per day.
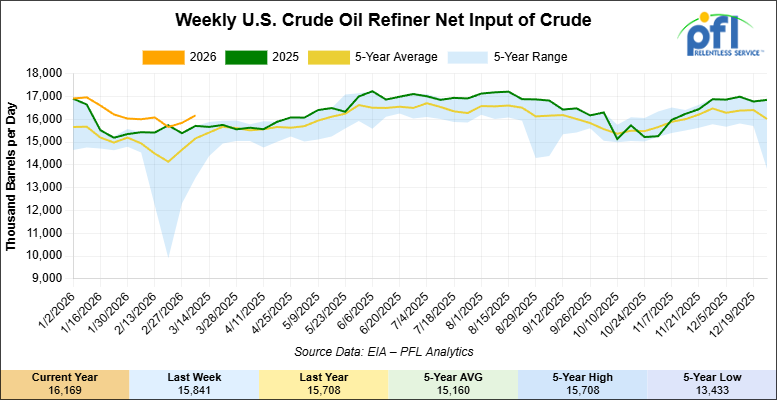
U.S. crude oil refinery inputs averaged 16.2 million barrels per day during the week ending March 6, 2026, which was 328,000 barrels per day more than the previous week’s average.
WTI is poised to open at $98.91, up 20 cents per barrel from Friday’s close.
North American Rail Traffic
Week Ending March 11, 2026:
Total North American weekly rail volumes were up (+0.58%) in week 11, compared with the same week last year. Total Carloads for the week ending March 11, 2026 were 337,284, up (+2.35%) compared with the same week in 2025, while weekly Intermodal volume was 341,752, down (-1.10%) year over year. 6 of the AAR’s 11 major traffic categories posted year-over-year increases. The largest decrease came from Forest Products (-17.08%). The largest increase was Coal (+14.16%).
In the East, CSX’s total volumes were up (+2.39%), with the largest decrease coming from Grain (-22.81%), while the largest increase came from Other (+10.76%). NS’s total volumes were down (-1.15%), with the largest increase coming from Petroleum & Petroleum Products (+17.45%), while the largest decrease came from Grain (-18.41%).
In the West, BNSF’s total volumes were up (+5.05%), with the largest increase coming from Grain (+17.27%), while the largest decrease came from Forest Products (-8.85%). UP’s total volumes were up (+2.37%), with the largest increase coming from Grain (+40.61%), while the largest decrease came from Intermodal Units (-4.73%).
In Canada, CN’s total volumes were down (-0.11%), with the largest increase coming from Grain (+30.21%), while the largest decrease came from Nonmetallic Minerals (-10.97%). CPKCS’s total volumes were down (-25.24%), with the largest increase coming from Other (+45.60%), while the largest decrease came from Forest Products (-69.85%).
Source Data: AAR – PFL Analytics
North American Rig Count Summary
Rig Count
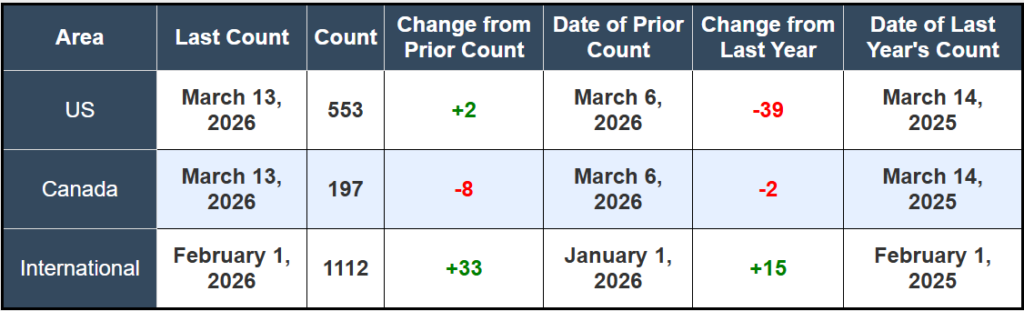
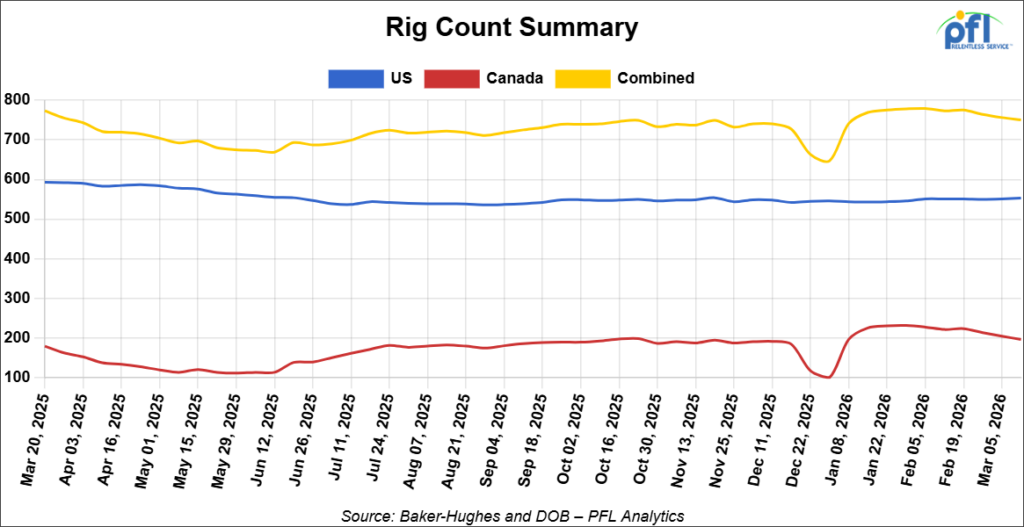
North American rig count was down by -6 rigs week-over-week. The US rig count was up by +2 rigs week-over-week, but down by -39 rigs year-over-year. The U.S. currently has 553 active rigs. Canada’s rig count was down by -8 rigs week-over-week and down by -2 rigs year-over-year. Canada currently has 197 active rigs. Overall, year-over-year we are down by -41 rigs collectively.
We are watching a few things out there for you:
We are Watching Petroleum Carloads
The four-week rolling average of petroleum carloads carried on the six largest North American railroads rose to 30,502 from 30,360 which was an increase of +142 rail cars week-over-week. Canadian volumes were mixed. CN’s shipments were flat week-over-week, CPKC’s volumes were lower by -4.0% week-over-week. U.S. shipments were down across the board. The NS had the largest percentage decrease and was down by -13.0%.
We are Watching the Hormuz Chokepoint
Joint US-Israeli strikes on Iran on February 28th killed Supreme Leader Khamenei and triggered an Iranian response that has effectively halted Western-aligned tanker traffic through the Strait of Hormuz. By early last week, over 150 vessels were anchored outside the strait, major insurers had pulled war-risk coverage, and Iran’s new Supreme Leader, who we have not seen publicly, declared the closure permanent. The IEA responded on Wednesday of last week with its largest-ever emergency reserve release, 400 million barrels, a figure that represents less than 20 days of the roughly 20 million barrels per day the strait normally carries. For rail car operators and their customers, the first question is whether any of this actually changes North American transportation economics. Right now, the honest answer is: not much, and not in the way the headlines suggest.
The price signal is real. One Exchange’s WCS at Hardisty closed on Friday of last week at US$79.96 per barrel, the highest closing in more than three years, while WTI at Houston settled at $98.71 per barrel. Retail diesel rose nearly a dollar per gallon on the week, and the EIA raised its full-year 2026 retail diesel forecast by 20 percent to $4.12 per gallon. But higher outright crude prices are not the same as higher crude rail volumes. The Alberta-to-Gulf Coast unit train rate sits at $15.19 per barrel and One ExchangeWCS-WTI differential has narrowed to roughly $13 per barrel on the war premium, still below the $15-20/bl range historically required to make long term movement competitive with pipeline. Enbridge Mainline apportionment peaked at 22 percent in February and has already eased to 11 percent for March nominations.
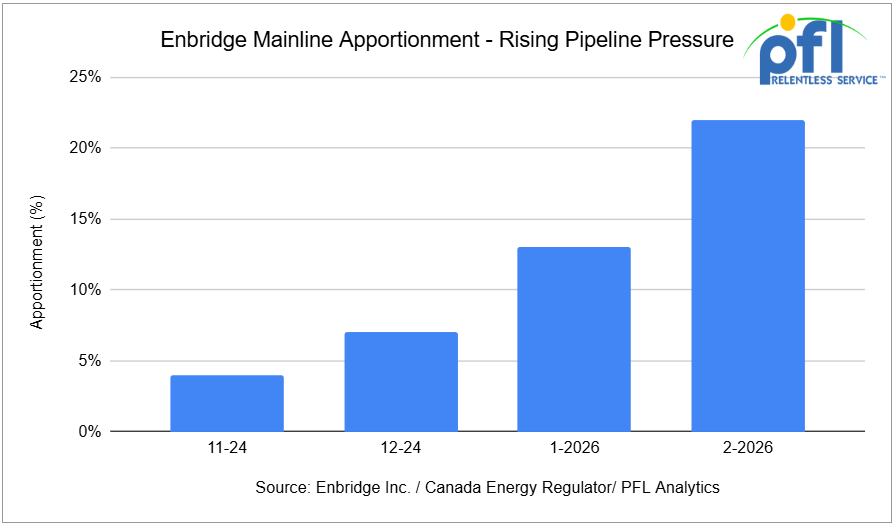
Enbridge presently seem to be loosening, not tightening, and the differential is moving in the wrong direction for rail economics. Additionally, it is not like there are fleets or rail cars out there sitting idle and ready to fill the gap that is a pipe dream in itself! It is going to take a long-term commitment by producers to have cars built for them and a long-term commitment with a class one to move the product by rail and that will not happen overnight.
Duration is the variable that changes the picture. Tanker operator D’Amico warned last week that infrastructure damage across Gulf refineries and export terminals, combined with the risk of mines lingering in the strait, means flows may not recover to pre-war levels quickly even after hostilities end. A disruption measured in months rather than weeks is the scenario where pipeline apportionment tightens again and the case for incremental crude rail movements out of Alberta becomes concrete rather than theoretical. That is not today’s market.
We are Watching Canada’s Pipeline Problem
Canada’s Energy Minister Tim Hodgson was on television everyday last week in Canada pledging that Canada will do its part for global energy stability. The world, for its part, appears to believe him – Hodgson confirmed his office has received calls from multiple countries seeking additional Canadian energy exports. The problem is the same one Alberta has been living with for years. The pipelines are nearly full, and there is no quick fix although Enbridge and Trasmountain are tweaking their systems as previously reported by PFL to get more barrels into existing pipe as quickly as possible. Trans Mountain is running at roughly 90 percent of its 890,000 barrel per day capacity. Alberta’s producers are entering spring maintenance season, a period that historically removes 150,000 barrels per day or more from provincial output through the second quarter, meaning the volume available to contribute to any emergency response is shrinking at exactly the moment demand is surging. The Canadian Association of Petroleum Producers said it plainly: “There is very minimal short-term ability for Canadian producers to further increase production.” Canadian Natural Resources underlined it by delaying a C$8.25 billion oil sands expansion, citing unresolved federal carbon pricing and methane rules.
Asian refiners are bidding aggressively for TMX heavy crude because Canadian barrels blend with light grades to replicate the medium and heavy sour yields normally flowing from the Gulf. May-loading TMX line space for heavy crude was heard trading at $9.30-9.70 per barrel, roughly $1.30 per barrel above where April space cleared, with Access to Western Blend at Edmonton hitting its highest level since June 2022. That demand is flowing west through TMX and onto Asian tankers, not south by rail. Every barrel Alberta produces above existing pipeline capacity still needs another way out, we have not hit that wall. Stay tuned to PFL – we watch this one daily.
We are Watching BP
USW Local 7-1 voted to reject BP’s “last, best and final” contract offer by 98.3 percent, with 94 percent of members participating. The vote came after more than six weeks of negotiations since the contract expired January 31. BP’s proposals included cutting roughly 100 to 200 union jobs through outsourcing, reducing wages across job classifications, requiring 150 days notice before a strike or lockout, and locking workers into a six-year contract that would remove Whiting from the national bargaining cycle. Strike and lockout preparations have been initiated, while workers continue to report under rolling 24-hour contract extensions. No strike date has been set, but the situation is deteriorating.
Whiting processes 440,000 b/d, making it the largest refinery in the US Midwest and the dominant processor of Canadian heavy crude in the region. It sits at the end of the Enbridge Mainline corridor and is one of the primary destinations for Alberta barrels moving through the Chicago-area hub. A work stoppage at Whiting would immediately reduce crude demand on the Enbridge system at a time when apportionment is already elevated, and would tighten distillate supply across Illinois, Indiana, and Michigan, pulling more refined product movement to rail and barge to fill the gap. The last time USW struck Whiting was 2015, and the walkout ran 99 days. That disruption caused rack allocations and wholesale price spikes across the Midwest. Our bet in talking to people in the know is there will be a deal cut before a lockout happens.
We are Watching ExxonMobil
ExxonMobil’s board voted unanimously last week to recommend reincorporating in Texas, and moving its legal domicile from New Jersey, where it has been registered since 1882 as Standard Oil. The company has had its physical headquarters in Spring, Texas, north of Houston, since 1989, so the legal change simply catches the address up with where the company already operates. Texas created a Business Court and specialized commercial appeals court in 2023 to improve legal predictability for large corporate defendants, and it has worked: Tesla, SpaceX, Coinbase, and Dillard’s have all made the same move in recent years. We are seeing companies constantly fleeing from blue States to red States, a trend that’s not letting up.
We are Watching the Fertilizer
The Strait of Hormuz closure has hit agriculture at the worst possible moment. Roughly one-third of global seaborne fertilizer trade, including nearly half the world’s urea exports and 30 percent of ammonia, transits the strait. With that supply effectively cut off, benchmark nitrogen fertilizer prices have surged 30 to 44 percent in less than two weeks. Urea has jumped from $475 per metric tonne to over $680. This is landing on Canadian and U.S. farm balance sheets as spring planting is weeks away.
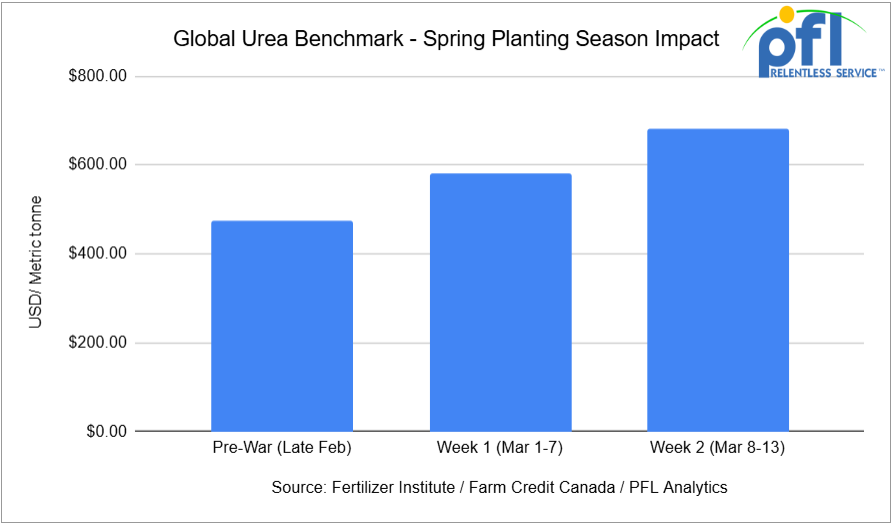
Farm Credit Canada estimates that a 40 percent increase in nitrogen costs would cut average Saskatchewan farm margins in half, from roughly $50 per acre to $25 per acre on a typical wheat and canola rotation. Farmers who pre-purchased fertilizer in the fall are protected; those who did not face a brutal choice. If enough farmers reduce nitrogen application or rotate away from corn toward less fertilizer-intensive crops like soybeans, the downstream effect is lower grain volumes moving to rail in the second half of 2026, precisely when the harvest season normally drives peak hopper car demand. Nutrien, the world’s largest fertilizer producer and a dominant North American rail shipper, received a major analyst upgrade last week, with Jefferies raising its price target by nearly 30%. North American producers with natural gas feedstock are the direct beneficiaries when Middle Eastern supply is disrupted.
We are Watching Ethanol
Retail gasoline rose 48.7 cents per gallon last week, the largest single-week increase in four years, pushing the national average above $3.50 per gallon. That move has done something years of lobbying and policy debate has struggled to accomplish: it has made E15 meaningfully cheaper than E10 at the pump by a margin wide enough that price-conscious consumers will notice. E15 typically prices 10 to 30 cents per gallon below conventional gasoline, and at current retail levels that discount is at the upper end of that range. Growth Energy reported that 2025 saw a 50 percent increase in E15 sales, a 42 percent increase in terminal supply, and 900 new retail locations. The war-driven gasoline spike is accelerating what was already a structural trend.
Ethanol moves almost exclusively by rail. U.S. ethanol production hit a record 16.4 billion gallons in 2025, and exports reached an all-time high of 2.18 billion gallons. The question now is whether domestic demand growth can match that production momentum. Congressional legislation that would establish year-round E15 nationwide is pending, and the price environment created by the Iran war has given it its most compelling economic argument in years: consumers are already choosing E15 where it is available, and the infrastructure to supply it moves by tank car. Only about 4,700 of the roughly 150,000 U.S. gasoline stations currently sell E15. Closing that gap requires blending terminal investment and the rail capacity to keep those terminals supplied. The demand signal is there. The infrastructure buildout is the constraint, but it can happen quickly.
We are Watching Captive Shippers
The Surface Transportation Board’s rewritten reciprocal switching proposal drew strong support from commodity shippers in filings last week. The revision follows a federal appeals court striking down the previous version last July. The key change is the elimination of the requirement that shippers prove “anti-competitive conduct” before requesting access to a competing carrier, replaced by a simpler standard based on demonstrated service failure. For energy shippers, this is a meaningful shift. Refineries, petrochemical plants, and terminals are geographically fixed, and when a single Class I railroad is the only carrier at a facility, shippers have historically had almost no leverage when service deteriorates.
The American Petroleum Institute, whose 600 members move crude, refined products, and petrochemical feedstocks by rail, noted many are captive to a single carrier and said the credible threat of switching would force railroads to compete on service quality. LyondellBasell, which operates 20,000 private rail cars across 19 facilities, told the STB that access to switching at eight of those locations has measurably reduced routing delays and congestion. The American Chemistry Council argued the rules are a necessary counterweight to the Union Pacific-Norfolk Southern merger currently before the STB, noting that consolidation makes competitive access remedies more critical, not less. Better service leverage and the real possibility of switching are a concrete improvement for every private tank car fleet operating in a captive corridor.
We are Watching Parsec
Parsec LLC is closing three intermodal terminals and cutting approximately 300 jobs after losing customer contracts at all three locations. The Columbus, Ohio, facility is eliminating 115 positions by May 1. The Jacksonville, Florida, closure will affect roughly 150. North Charleston, South Carolina, will affect 98 people. Parsec, founded in 1949, manages rail yards under contract on behalf of Class I, regional, and short-line railroads, and was acquired by Universal Logistics Holdings for $193.6 million in September 2024. In filings with state regulators, Parsec stated that all negotiations to continue operations at the Columbus terminal failed, leaving the company with no viable path forward at that location. Whether the contract losses are connected to the ownership change or reflect broader market conditions is not yet clear.
The closures are a symptom of a specific freight dynamic. Shippers pulled large import volumes forward in late 2025 ahead of potential tariff changes, effectively borrowing demand from early 2026 and leaving the first quarter thin. Truck capacity remains plentiful, keeping pressure on intermodal pricing. Three terminal closures from a single operator in a single quarter is a concrete measure of how soft the intermodal market actually is right now, underneath the noise of the energy price headlines.
We are watching Key Economic Indicators
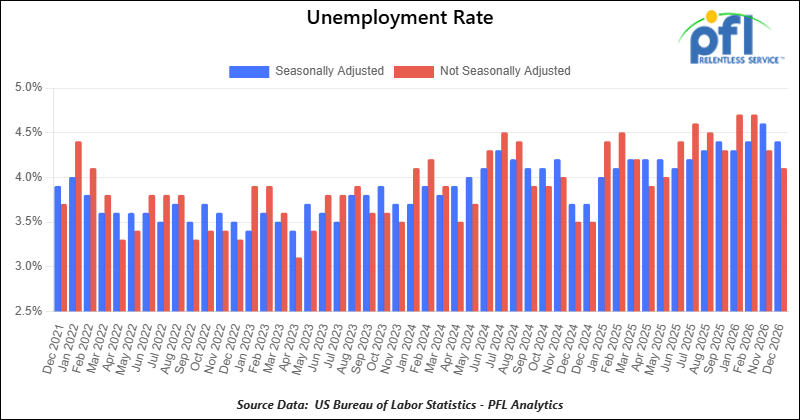
Unemployment Rate
On March 6, 2026, the BLS reported that a preliminary 92,000 net jobs were lost in February 2026, marking an unexpected decline in employment after modest gains earlier in the year. Figures for prior months continue to show limited momentum, with job growth remaining weak overall.
According to the BLS, 2025’s net new job gains were revised sharply lower to 181,000 following annual benchmark revisions, indicating significantly weaker hiring than previously estimated. The official unemployment rate rose to 4.4% in February, up slightly from 4.3% in January.
Lease Bids
- 100, 21.9K 117J Tanks located off of All Class 1s in Midwest. For use in CO2 service. Period: 6 months.
- 30-50, 30K 117J Tanks located off of NS or CSX in Northeast. For use in C5 service. Period: 1 year.
- 20-50, 4000-5000 Covered Hoppers located off of UP or BN in Houston. For use in Urea, Potash, Ammonium Sulfate service. Period: 6-12 Months.
- 200, 33K Pressure Tanks located off of CSX or NS in Ohio. For use in Propylene service. Period: 18 Months.
- 30-50, 25.5K DOT 111 Tanks located off of All Class 1s in Anywhere. For use in Asphalt service. Period: 1-3 Years.
- 40, 33K Pressure Tanks located off of UP in Eunice, LA. For use in Propane service. Period: 1 Year.
- 40, 29K DOT 111 Tanks located off of UP or BN in Midwest. For use in Veg Oil service. Period: 5 Year.
Sales Bids
- 28, 3400CF Covered Hoppers located off of UP BN in Texas. For use in Cement service. Cement Gates needed.
- 20, 17K DOT111 Tanks located off of various class 1s in various locations. For use in corn syrup service.
- 120, Various Open-Top Aluminum Rotary Gondolas located off of various class 1s in various locations. For use in Sulphur service. Built 2004 or later.
- 30, 29K DOT111 Tanks located off of various class 1s in Chicago. For use in Veg Oil service.
Lease Offers
- 100, 30K CPC1232 Tanks located off of UP or BN in Texas. Last used in Diesel.
- 100, 30K DOT117R Tanks located off of UP or BN in Texas. Last used in Gasoline.
- 100, 29K DOT117R Tanks located off of UP or BN in Texas. Last used in Gasoline. Coiled and Insulated.
- 21, 6351 Covered Hoppers located off of CN in Wisconsin. Last used in DDG. Available until February 2027.
- 29, 6500 Covered Hoppers located off of CN in Wisconsin. Last used in DDG. Available until February 2027.
- 50, 20K DOT117J Tanks located off of All Class 1s in Moving. Last used in Styrene.
- 29, 25.5K DOT117J Tanks located off of UP or BN in Texas. Cars are currently clean. Cars are currently clean.
- 90, 30K DOT117J Tanks located off of UP or BN in Corpus Christie. Last used in Diesel.
- 200, 340W DOT 112J Tanks located off of All Class 1s in Multiple Locations. Last used in Propane and Butane. Cars are currently clean.
- 15, 6200CF Covered Hoppers located off of All Class 1s in Wisconsin. Last used in Plastic. Cars are currently clean.
- 30, 6500CF Covered Hoppers located off of All Class 1s in Wisconsin. Last used in Plastic. Cars are currently clean.
- 50, 30K DOT117J Tanks located off of UP or BN in Corpus Christie. Last used in Gasoline.
- 24, 21K Stainless Steel Tanks located off of UP in Texas / Mexico Border. Last used in SULFACTANT. Cars are currently clean.
- 34, 30K DOT 111 Tanks located off of UP in Texas / Mexico Border. Last used in Veg Oil. Cars are currently clean.
Sales Offers
- 50, 31.8K CPC1232 Tanks located off of UP or BN in TX. Last used in Multiple. Requal Due in 2025.
- 35, 3400CF Covered Hoppers located off of UP or BN in Midwest. Last used in Sand.
- 25, 30K 117J Tanks located off of CSX in Jackson, TN. Last used in Fuels. Newly Requalified.
Call PFL today to discuss your needs and our availability and market reach. Whether you are looking to lease cars, lease out cars, buy cars, or sell cars call PFL today at 239-390-2885
Live Railcar Markets
| CAT | Type | Capacity | GRL | QTY | LOC | Class | Prev. Use | Offer | Note |
|---|
PFL will be at the Following Conferences

- Where: Loews Arlington Hotel
- Attending: Brian Baker (239.297.4519), David Cohen (954-729-4774), and Curtis Chandler (239-405-3365)
- Conference Website

- Where: The Westin Galleria Dallas
- Attending: David Cohen (954-729-4774), and Curtis Chandler (239-405-3365)
- Conference Website

- Where: The Westin Galleria Dallas
- Attending: Brian Baker (239.297.4519)
- Conference Website