
“One fails forward toward success.” – Charles Kettering
Jobs Update
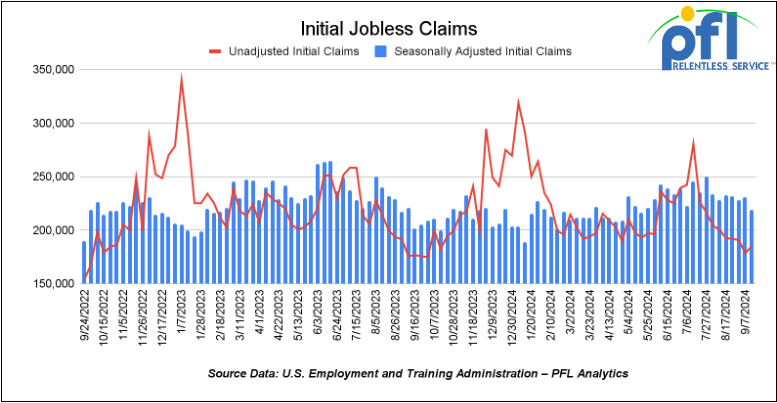
- Initial jobless claims seasonally adjusted for the week ending September 14th came in at 219,000, down -12,000 people week-over-week.
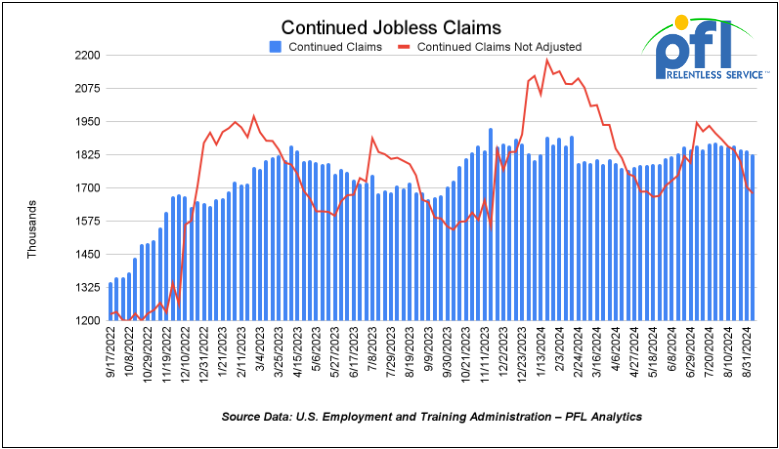
- Continuing jobless claims came in at 1.829 million people, versus the adjusted number of 1.843 million people from the week prior, down -14,000 people week-over-week.
Stocks closed mixed on Friday of last week, but higher week over week
The DOW closed higher, on Friday of last week up 38.17 points (0.09%), closing out the week at 42,063.36, up 669.59 points week-over-week. The S&P 500 closed lower on Friday of last week, down -11.09 points, and closed out the week at 5,702.55, up 76.53 points week-over-week. The NASDAQ closed lower on Friday of last week, down -65.66 points (-0.37%), and closed out the week at 17,948.32, up 264.34 points week over week.
In overnight trading, DOW futures traded higher and are expected to open at 42,450 this morning up 7 points.
Crude oil closed lower on Friday of last week, but higher week over week.
West Texas Intermediate (WTI) crude closed down -$0.30 per barrel (-0.4%) to close at $71.92 per barrel on Friday of last week, up $3.27 per barrel week over week. Brent traded down -$0.39 USD per barrel (-0.52%) on Friday of last week, to close at $74.49 per barrel, up $2.88 per barrel week-over-week.
One Exchange WCS (Western Canadian Select) for November delivery settled Friday on last week at US$13.50 below the WTI-CMA (West Texas Intermediate – Calendar Month Average). The implied value was US$ 56.56 per barrel.
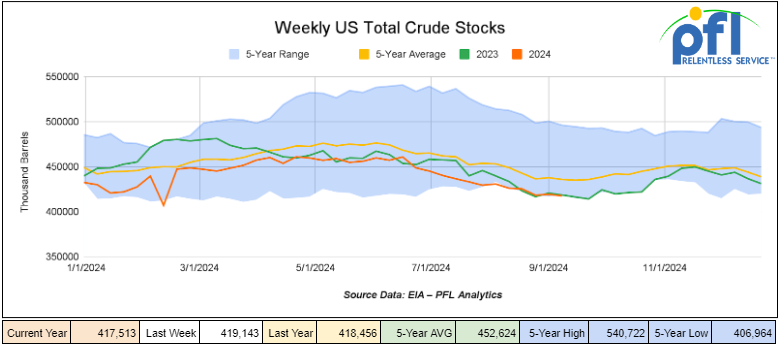
U.S. commercial crude oil inventories (excluding those in the Strategic Petroleum Reserve) decreased by 1.6 million barrels week-over-week. At 417.5 million barrels, U.S. crude oil inventories are 4% below the five-year average for this time of year.
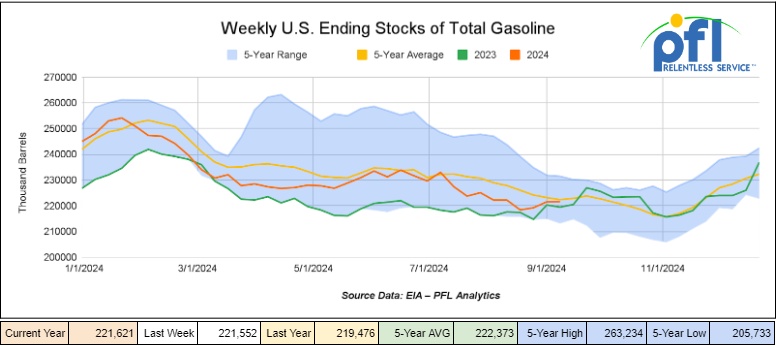
Total motor gasoline inventories increased by 100,000 barrels week-over-week and are slightly below the five-year average for this time of year.
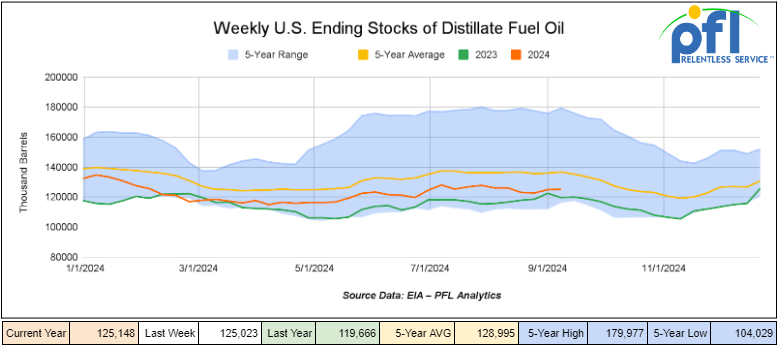
Distillate fuel inventories increased by 100,000 barrels week-over-week and are 9% below the five-year average for this time of year.
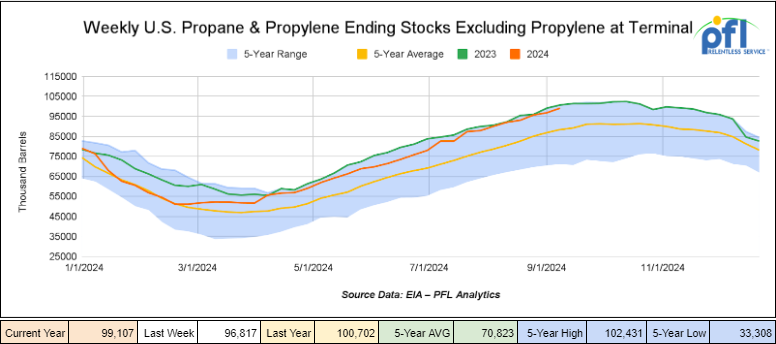
Propane/propylene inventories increased by 2.3 million barrels week-over-week and are 11% above the five-year average for this time of year.
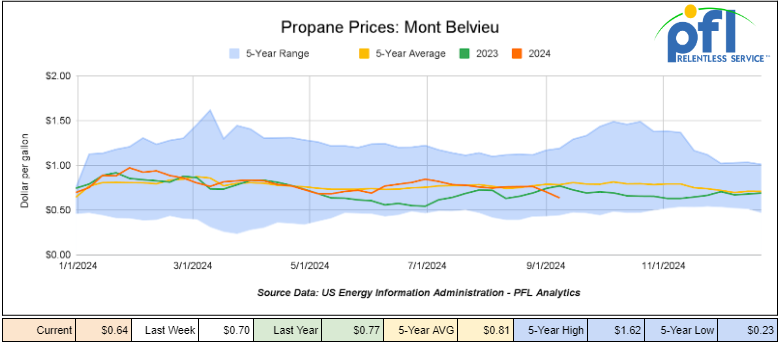
Propane prices closed at 64 cents per gallon on Friday of last week, down 6 cents per gallon week-over-week and down 13 cents per gallon year-over-year.
Overall, total commercial petroleum inventories increased by 3.4 million barrels week-over-week during the week ending September 13, 2024.
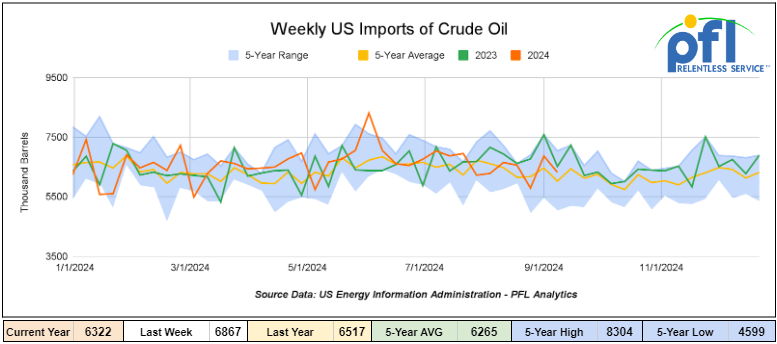
U.S. crude oil imports averaged 6.3 million barrels per day during the week ending September 13, 2024, a decrease of 545,000 barrels per day week-over-week. Over the past four weeks, crude oil imports averaged 6.4 million barrels per day, 7.1% less than the same four-week period last year. Total motor gasoline imports (including both finished gasoline and gasoline blending components) 467,000 barrels per day, and distillate fuel imports averaged 138,000 barrels per day during the week ending September 13, 2024.
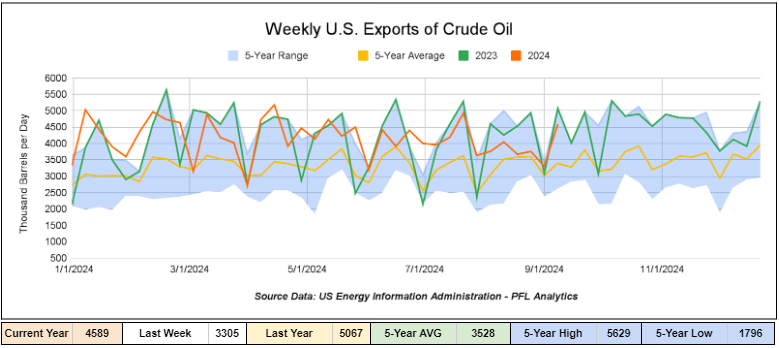
U.S. crude oil exports averaged 4.589 million barrels per day for the week ending September 13th, 2024, an increase of 1.284 million barrels per day week-over-week. Over the past four weeks, crude oil exports averaged 3.83 million barrels per day.
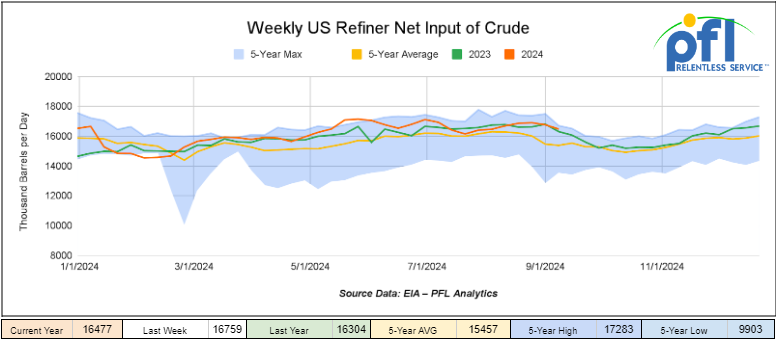
U.S. crude oil refinery inputs averaged 16.5 million barrels per day during the week ending September 13, 2024, which was 283,000 barrels per day less week-over-week.
WTI is poised to open at $71.10, up 10 cents per barrel from Friday’s close.
North American Rail Traffic
Week Ending September 18th, 2024.
Total North American weekly rail volumes were up (+4.4%) in week 38, compared with the same week last year. Total carloads for the week ending on September 18th were 347,598, down (-2.05%) compared with the same week in 2023, while weekly intermodal volume was 58,213, up (+11.53%) compared to the same week in 2023. 7 of the AAR’s 11 major traffic categories posted year-over-year decreases. The most significant decrease came from Metallic Ores and Metals, which was down (-8.05%). The most significant increase came from Grain which was up (+16.98%).
In the East, CSX’s total volumes were up (+4.04%), with the largest decrease coming from Metallic ores and Metals (-9.91%) while the largest increase came from Grain (+25.32%). NS’s volumes were up (+6.55%), with the largest increase coming from Grain (+66.24%), while the largest decrease came from Petroleum and Petroleum Products (-9.71%).
In the West, BN’s total volumes were up (+8.89%), with the largest increase coming from Intermodal (+16.94%) while the largest decrease came from Motor Vehicles and Parts down (-10.27%). UP’s total rail volumes were up (+4.4%) with the largest decrease coming from Metallic Ores and Metals, down (-19.3%), while the largest increase came from Other which was up (+25.04%).
In Canada, CN’s total rail volumes were down (-5.39%) with the largest decrease coming from Metallic Ores and Metals, down (-15.15%) while the largest increase came from Other, up (+137.32%). CP’s total rail volumes were down (-7.81%) with the largest increase coming from Other (+50%), while the largest decrease came from Petroleum and Petroleum Products (-35.34%).
KCS’s total rail volumes were down (-13.35%) with the largest decrease coming from Intermodal (-28.76%) and the largest increase coming from Motor Vehicles and Parts (+68.99%).
Source Data: AAR – PFL Analytics
Rig Count
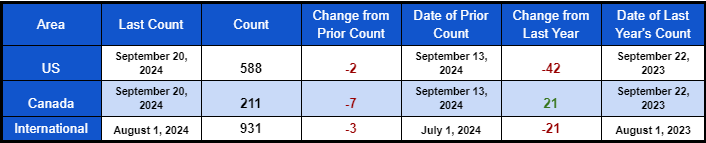
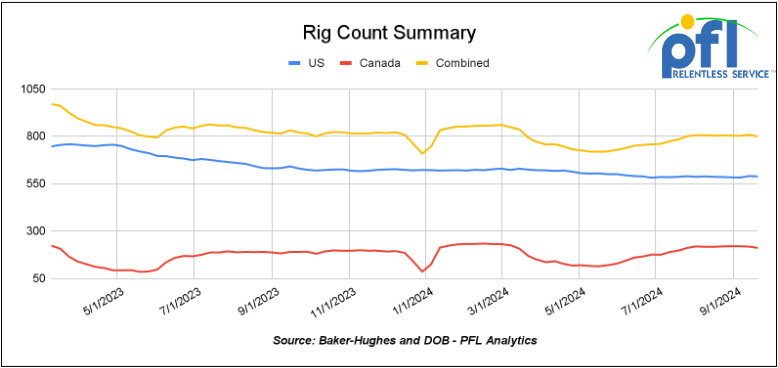
North American rig count was down by 9 rigs week-over-week. The U.S. rig count was down by -2 rigs week-over-week, and down by -42 rigs year-over-year. The U.S. currently has 588 active rigs. Canada’s rig count was down -7 rigs week-over-week, but up by 21 rigs year-over-year. Canada’s overall rig count is 211 active rigs. Overall, year over year we are down -21 rigs collectively.
North American Rig Count Summary
A few things we are watching:
We are watching Petroleum Carloads
The four-week rolling average of petroleum carloads carried on the six largest North American railroads fell to 27,768 from 28,122, which was a loss of 354 rail cars week-over-week. Canadian volumes were mixed. CN’s shipments fell by 1.0% week over week, CPKC’s volumes were higher by 1.2% week-over-week. U.S. shipments were mixed. The CSX had the largest percentage decrease and was down by -2.0%. The NS had the largest percentage increase and was up by +13.7%.
We are watching untapped energy north of the border which remains idle
Remember when Keystone was axed on day 1 of Biden’s presidency? Folks, one thing we don’t understand and talk about every day here at PFL is why are we buying any crude oil from Venezuela, the Saudis or the Europeans buying crude and natural gas from Russia for that matter. We must just look North of Montana to Calgary, Alberta, and Canada. That province much to the chagrin of their Federal Government would love to produce and sell any U.S. energy shortfall the U.S. has (not to leave out Saskatchewan right next door who would love to join the party too), and you don’t need the U.S. Navy to patrol the Great Lakes either like we are currently doing in the middle east.
In 2022 there was an energy crisis with the invasion of Ukraine – global markets have calmed since, however, geopolitical tensions have worsened, there is war in Europe and the Middle East, and things in the U.S. are seemingly out of control. Forming a North American energy alliance with Alberta/Saskatchewan as a tag-along is more important than ever. However, a sector-by-sector cap-and-trade system designed to meet Canada’s Federal government’s 2030 ambitious greenhouse gas goals is threatening this increasingly important partnership.
Even though the U.S. is the world’s largest oil and gas producer, it increasingly relies on Canada to supply refineries with much-needed heavy crude oil and keep power flowing to households and industry. In fact, growth in Canadian imports is an important factor driving America’s reduced reliance on OPEC countries, as it stands now Canada now accounts for 52% of U.S. petroleum imports. Meanwhile, virtually all natural gas coming into the U.S. comes from Canada, and it is also America’s primary supplier of electricity and important minerals such as uranium. In total, the two-way energy trade of oil, natural gas, electricity, and uranium reached a record total in 2023 of $156 billion USD. In total during 2023, the United States imported 8.51 million barrels per day (b/d) of petroleum from 86 countries. Petroleum includes crude oil, hydrocarbon gas liquids (HGLs), refined petroleum products such as gasoline and diesel fuel, and biofuels. Crude oil imports of about 6.48 million b/d accounted for about 76% of U.S. total gross petroleum imports. The canceled Keystone pipeline at 1 million (b/d) would have reduced reliance on other countries by 15% overnight. Let’s’ bring Keystone back, it is almost ready to go – it wouldn’t take much time!
Together, Canada and the U.S. have dominated global oil production growth in the past decade, creating an energy-secure North America while driving billions into innovation and technologies designed to lower emissions. Policy actions that limit production (something Justin may be contemplating) and export capacity could reverse this progress, leaving us and our allies more vulnerable. We must instead leverage our deeply interconnected energy systems and rock-solid commercial relationships in support of a North American Energy Security framework that will deliver benefits for decades to come.
It is easier said than done, unfortunately, Canada’s Prime Minister Justin is at war with Energy Companies in Canada and Canada has their own version of the Green New Deal – the underlying fundamentals of Canada’s Green New Deal is more or less the same – solar, wind electric cars… If it was truly green, it would be one thing except wind and solar are not as once thought a great source of green energy. Producing solar cells requires significant energy and the solar panels break down, and so do the inverters that run them, not to mention end-of-life disposal costs. Windmills don’t make it to their full predicted life and come with many problems and affect wildlife. The path moving forward seems to be key innovation at the pump, increasing efficiency in our automobiles through technology. Electricity generation via cogeneration utilizing cheap clean-burning natural gas makes the most sense if you ask us. We should continue with the deployment of emissions-reducing technologies to power oil and gas operations (such as carbon capture and storage (CCS) – injecting carbon in depleted oil reservoirs for enhanced oil recovery, waste heat recovery systems, and small modular reactors). We just need a few tweaks to the system, not one that is going to create our own self-destruction.
We are Watching Microsoft and Constellation
In case you missed it – on Friday of last week Constellation issued in a press release that it signed its largest power purchase agreement ever, bringing back 3-mile island a deal that will restore TMI Unit 1 to service and keep it online for decades; add approximately 835 megawatts of carbon-free energy to the grid; create 3,400 direct and indirect jobs and deliver more than $3 billion in state and federal taxes. They say “the signing of a 20-year power purchase agreement with Microsoft that will pave the way for the launch of the Crane Clean Energy Center (CCEC) and restart of Three Mile Island Unit 1, which operated at industry-leading levels of safety and reliability for decades before being shut down for economic reasons exactly five years ago today. Under the agreement, Microsoft will purchase energy from the renewed plant as part of its goal to help match the power its data centers in PJM use with carbon-free energy.”
“This agreement is a major milestone in Microsoft’s efforts to help decarbonize the grid in support of our commitment to become carbon-negative. Microsoft continues to collaborate with energy providers to develop carbon-free energy sources to help meet the grids’ capacity and reliability needs,” said Bobby Hollis, VP of Energy, Microsoft.
A recent economic impact study commissioned by the Pennsylvania Building & Construction Trades Council found that the new CCEC will create 3,400 direct and indirect jobs and add more than 800 megawatts of carbon-free electricity to the grid. The report, produced by The Brattle Group, also found that restarting the plant will add $16 billion to the state’s GDP and generate more than $3 billion in state and federal taxes.
To ensure that the local community fully participates in the economic benefits of restarting the facility, Constellation has committed an additional $1 million in philanthropic giving to the region over the next five years to support workforce development and other community needs. The company had a strong relationship with Middletown and the surrounding communities over the 20 years that it operated the plant, with public safety as its No. 1 priority. Constellation is committed to making community outreach, engagement and dialogue cornerstones of its restart plan.
“Pennsylvania’s nuclear energy industry plays a critical role in providing safe, reliable, carbon-free electricity that helps reduce emissions and grow Pennsylvania’s economy,” said Governor Josh Shapiro. “Under the careful watch of state and federal authorities, the Crane Clean Energy Center will safely utilize existing infrastructure to sustain and expand nuclear power in the Commonwealth while creating thousands of energy jobs and strengthening Pennsylvania’s legacy as a national energy leader. My Administration will continue to work to cut energy costs and ensure the reliability of our energy grid so that Pennsylvanians can have access to affordable power made right here in Pennsylvania for years to come – and the Crane Clean Energy Center will help us achieve those goals.”
Whether or not Nuclear Energy is green and good for the environment is debatable – we still have a problem with spent nuclear waste, and end-of-life decommissioning creates an astronomical cost for the consumer. But, at least we are adding back some power to the grid. It worries us all the coal plants that are set to come offline. We don’t want to be in a situation like Germany and hopefully, we can learn from their mistakes, which were many on every front.– Stay tuned to PFL
We are watching Some Key Economic Indicators
Consumer Confidence
The Index of Consumer Sentiment from the University of Michigan increased from 68.7 in August to 69 in September.

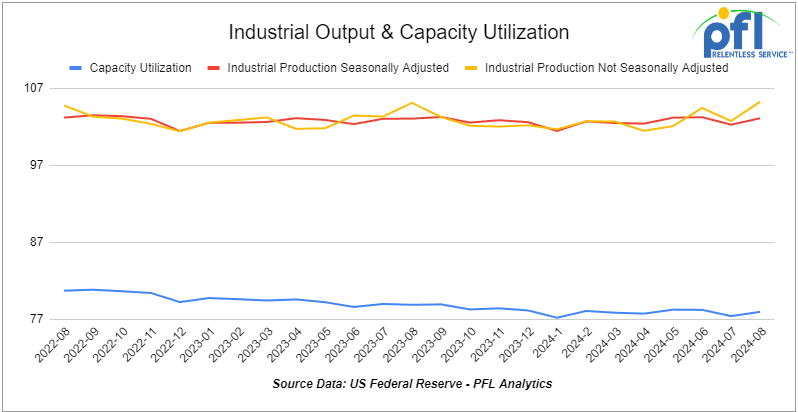
Industrial Output & Capacity Utilization
In August 2024, U.S. industrial production rebounded with a 0.8% increase following a 0.9% decline in July. This was largely driven by a recovery in motor vehicle production, which surged by 9.8%, recovering from a sharp drop the previous month. Manufacturing output also rose by 0.9%, marking a notable improvement over earlier months. Despite these gains, nondurable manufacturing saw a slight decline of 0.2%.
Capacity utilization in the industrial sector improved to 78%, up from 77.4% in July. For the manufacturing sector specifically, capacity utilization increased to 77.2%, recovering from July’s 76.6%. While these are positive signs, capacity utilization remains slightly below its long-term average.
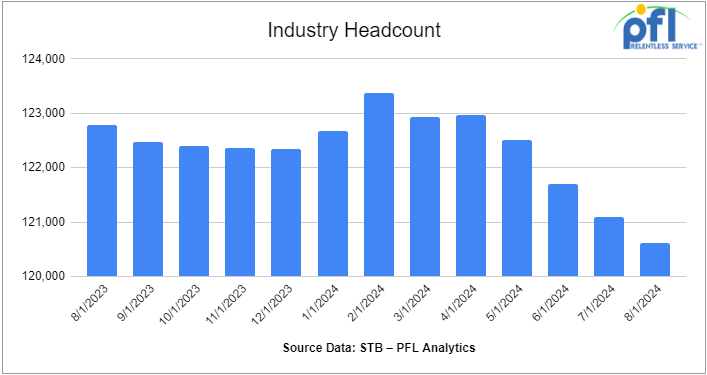
We are watching Class 1 Industry Headcount
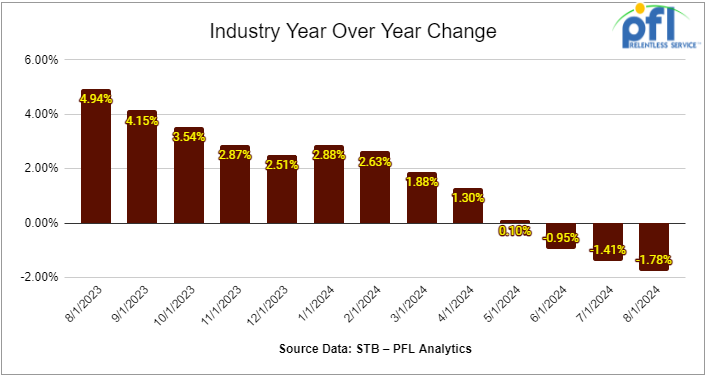
Class I railroads employed 120,611 workers in the United States in August 2024, a -0.39% decrease from July 2024’s count of 121,085 and a -1.78% year-over-year decrease, according to Surface Transportation Board data.

Three of the six employment categories posted month-over-month increases between July and August. They were – executives, officials, and staff assistants, up +0.33% to 7,902 workers; transportation (other than train and engine), up -0.28% to 5,029; and maintenance of way and structures, down -0.43% to 28,985.
Categories that posted month-over-month decreases were transportation (train and engine), -0.31% to 51,845 employees; maintenance of equipment and stores, -0.54% to 17,082; and professional and administrative, -1.11% to 9,768.
Year over year, only one category posted an employment gain, which was transportation (other than train and engine) at +3.07%.
Categories that registered year-over-year decreases in August were maintenance of equipment and stores, -6.44%; professional and administrative, -5.41%; executives, officials, and staff assistants, -4.01%; maintenance of way and structures, -0.03%; and transportation (train and engine), -0.49%.
Lease Bids
- 10, 2500CF Open Top Hoppers needed off of UP or BN in Texas for 5 years. Cars are needed for use in aggregate service. Need Rapid Discharge Doors
- 50, 23.5-25.5 DOT111 Tank s needed off of Any Class 1 in USA for 5 years. Cars are needed for use in Asphalt service.
- 25, 3230 PD Hoppers needed off of NS or CSX in Ohio for 5 years. Cars are needed for use in Flyash service.
- 50, 28.3K DOT 111 Tanks needed off of Any Class 1 in any location for 3-7 Years. Cars are needed for use in Base Oils service.
- 20, 25.5k CPC 1232 Tanks needed off of UP or BN in OK, TX for 3 Year. Cars are needed for use in Asphalt service.
- 10, 30K 117R or 117J Tanks needed off of Any Class 1 in USA for 1 year. Cars are needed for use in Glycerin service.
- 15-20, 29K 117R Tanks needed off of NS or CSX in Ohio for 6-12 Months. Cars are needed for use in Ply Oil service.
- 100, 5200 Covered Hoppers needed off of UP or BN in Northwest for 6 month. Cars are needed for use in Pet Coke service. Roud Hatch, Bottom Outlet Doors
- 10, 5250 Covered Hoppers needed off of UP or BN in Midwest for up to 5 years. Cars are needed for use in Dry Edible Beans service.
- 30-50, 23.5K Any Type Tanks needed off of any class 1 in any location for 1-5Years. Cars are needed for use in Glycols service.
- 30, 4750-5200 Covered Hoppers needed off of BN or UP in Lake Charles, LA for 5 Years. Cars are needed for use in Pet Coke service.
Sales Bids
- 100-150, 3400CF Covered Hoppers needed off of UP BN in Texas. Cars are needed for use in Cement service. Cement Gates needed.
- 20, 17K DOT111 Tanks needed off of various class 1s in various locations. Cars are needed for use in corn syrup service.
- 4, 25.5K DOT 111 Tanks needed off of any class 1 in Texas.
- 10, 30K DOT 111 Tanks needed off of any class 1 in Texas. Cars are needed for use in UCO service.
- 10, 5600CF PD Hoppers needed off of any class 1 in Texas.
- 50, 4750CF Covered Hoppers needed off of any class 1 in Texas. Cars are needed for use in Grain service.
Lease Offers
- 50, 5400, Covered Hoppers located off of NS, IORY in MI. Cars were last used in bean meal. 1 year+
- 45, 33K, 340W Pressure Tanks located off of All Class Ones in North America. Cars were last used in Propane/Butane. Free move on CN or CP
- 50, 30K, DOT 117J Tanks located off of BN in Texas. Cars were last used in Ethanol. 1-2 Year Term.
- 90, 25.5K, DOT 111 Tanks located off of UP in Texas. Cars were last used in Fuel OIl. 2-3 Year Term
Sales Offers
- 24, 5300CF, Plate C Boxcars located off of NS or CSX in Southeast.
- 100-300, 3400, Covered Hoppers located off of various class 1s in multiple locations. Sand Cars
- 150, 28.3K, DOT117J Tanks located off of various class 1s in multiple locations. Will take 90K
- 300, 31.8K, CPC 1232 Tanks located off of BN in Texas.
- 7, 30K, DOT-111 Tanks located off of UP in CA and TX.
Call PFL today to discuss your needs and our availability and market reach. Whether you are looking to lease cars, lease out cars, buy cars, or sell cars call PFL today at 239-390-2885
Live Railcar Markets
| CAT | Type | Capacity | GRL | QTY | LOC | Class | Prev. Use | Offer | Note |
|---|
PFL will be at the Following Conferences

- Where: La Quinta, CA
- Attending: David Cohen (954-729-4774)
- Conference Website

- Where: Hyatt Regency Dallas in Dallas, TX
- Attending:Curtis Chandler (239.405.3365), David Cohen (954-729-4774), Brian Baker (239.297.4519), Cyndi Popov(403) 402-5043
- Conference Website