
“Nothing is a waste of time if you use the experience wisely.” – Auguste Rodin
Jobs Update
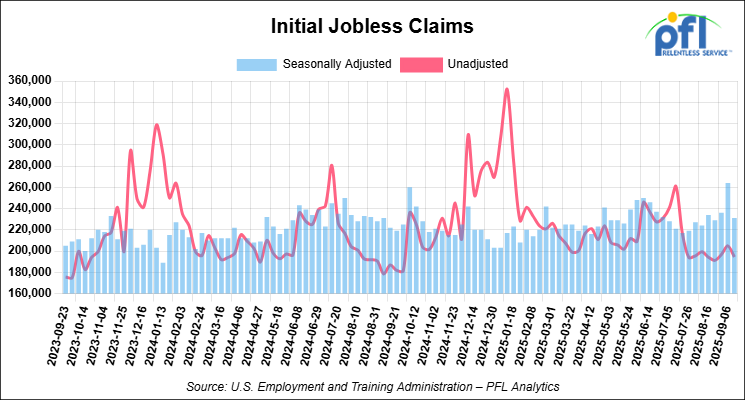
• Initial jobless claims seasonally adjusted for the week ending September 13, 2025 came in at 231,000, versus the adjusted number of 264,000 people from the week prior, down 33,000 people week over week.
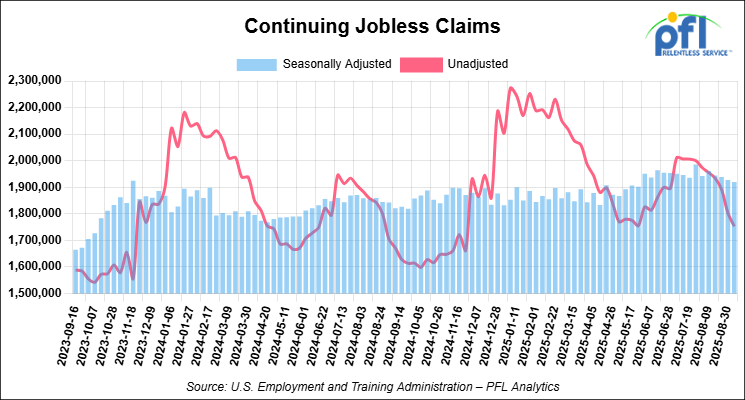
• Continuing jobless claims came in at 1,920,000, versus the adjusted number of 1,927,000 people from the week prior, down 7,000 week-over-week.
Stocks closed higher on Friday of last week and higher week-over-week
The DOW closed higher on Friday of last week, up 172.15 points (0.37%), closing out the week at 46,314.57, up 480.35 points week-over-week. The S&P 500 closed higher on Friday of last week, up 32.4 points (0.49%), and closed out the week at 6,664.36, up 80.07 points week-over-week. The NASDAQ closed higher on Friday of last week, up 160.75 points (0.72%), and closed out the week at 22,631.48, up 490.38 points week-over-week.
In overnight trading, DOW futures traded lower and are expected to open at 46,507 this morning, down -144 points from Friday’s close.
Crude oil closed lower on Friday of last week and lower week-over-week
West Texas Intermediate (WTI) crude closed down -0.89 per barrel (-1.4%), to close at $62.68 on Friday of last week, down 1 cent week-over-week. Brent crude closed down -0.76 per barrel (-1.1%), to close at $66.68, down $0.31 week-over-week.
One Exchange WCS (Western Canadian Select) for September delivery settled on Friday of last week at US$11.20 below the WTI-CMA (West Texas Intermediate – Calendar Month Average). The implied value was US$51.48 per barrel.
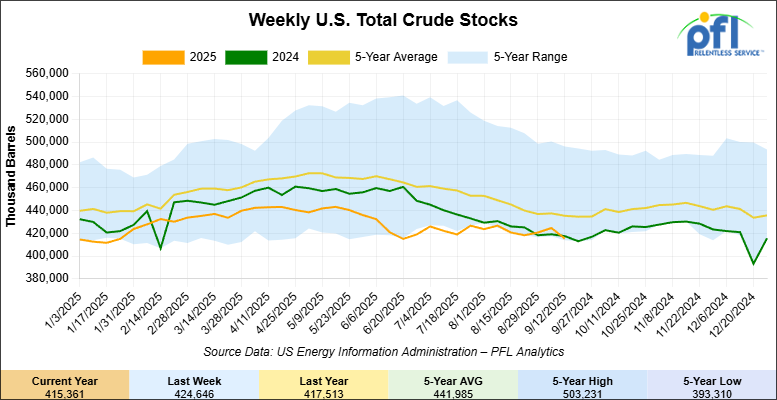
U.S. commercial crude oil inventories (excluding those in the Strategic Petroleum Reserve) decreased by 9.3 million barrels week-over-week. At 415.4 million barrels, U.S. crude oil inventories are 5% below the five-year average for this time of year.
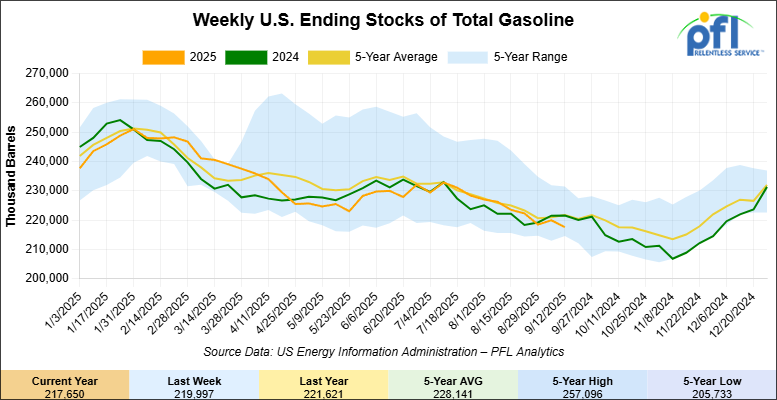
Total motor gasoline inventories decreased by 2.3 million barrels week-over-week and are 1% below the five year average for this time of year.
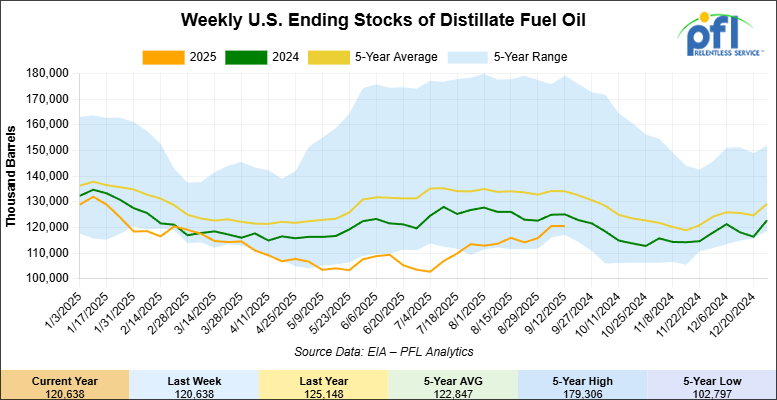
Distillate fuel inventories increased by 4 million barrels week-over-week and are 8% below the five year average for this time of year.
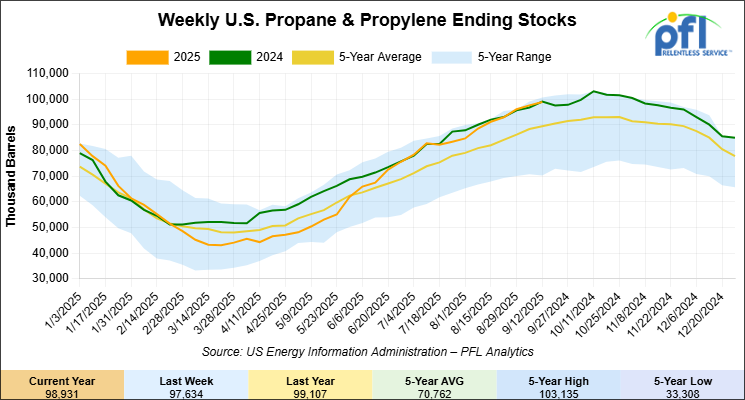
Propane/propylene inventories increased by 1.3 million barrels week-over-week and are 12% above the five year average for this time of year.
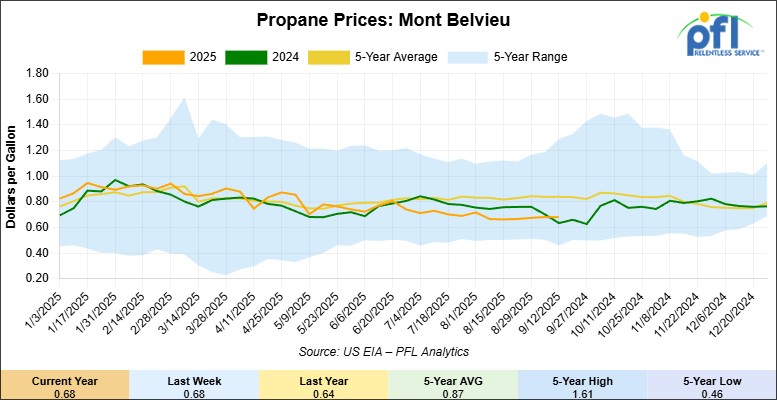
Propane prices closed at 68 cents per gallon on Friday of last week, flat week-over-week, but up 4 cents year-over-year.
Overall, total commercial petroleum inventories increased by 1.2 million barrels during the week ending September 12, 2025.
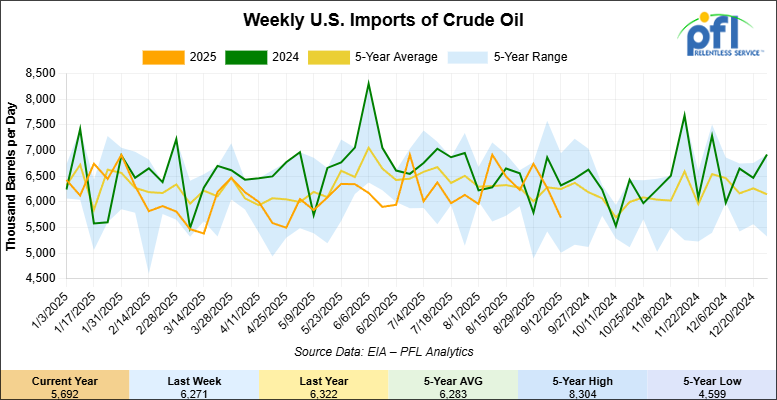
U.S. crude oil imports averaged 5.7 million barrels per day during the week ending September 12, 2025, a decrease of 579,000 barrels per day week-over-week. Over the past four weeks, crude oil imports averaged 6.2 million barrels per day, 2.4% less than the same four-week period last year. Total motor gasoline imports (including both finished gasoline and gasoline blending components) averaged 569,000 barrels per day, and distillate fuel imports averaged 95,000 barrels per day during the week ending September 12, 2025.
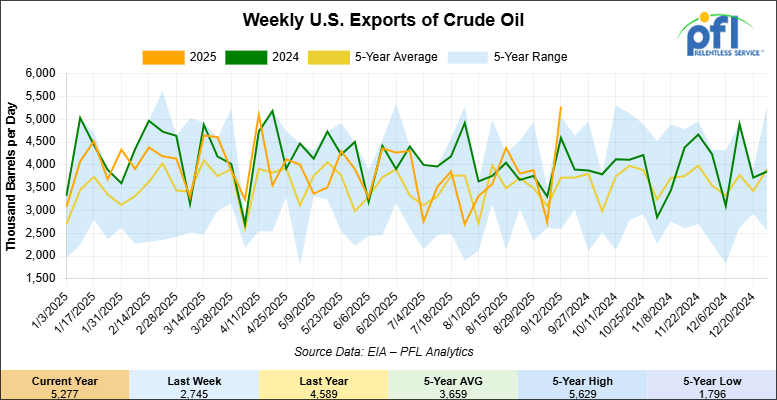
U.S. crude oil exports averaged 5.277 million barrels per day during the week ending September 12, 2025, an increase of 2.532 million barrels per day week-over-week. Over the past four weeks, crude oil exports averaged 3.929 million barrels per day
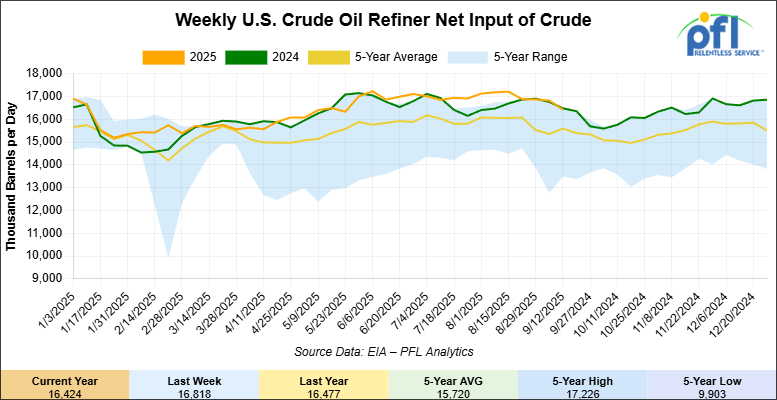
U.S. crude oil refinery inputs averaged 16.4 million barrels per day during the week ending September 12, 2025, which was 394,000 barrels per day less week-over-week.
WTI futures are poised to open at $62.22, down 18 cents from Friday’s close.
North American Rail Traffic
Week Ending September 17, 2025:
Total North American weekly rail volumes were down (-1.97%) in week 38, compared with the same week last year. Total Carloads for the week ending September 17, 2025 were 327,739, up (+0.75%) compared with the same week in 2024, while weekly Intermodal volume was 342,273, down (-4.45%) year over year. 7 of the AAR’s 11 major traffic categories posted year-over-year decreases. The largest decrease came from Forest Products (-14.27%), while the largest increase was Chemicals (+7.02%).
In the East, CSX’s total volumes were down (-0.98%), with the largest decrease coming from Petroleum & Petroleum Products (-17.65%), while the largest increase came from Nonmetallic Minerals (+8.55%). NS’s total volumes were down (-0.17%), with the largest increase coming from Petroleum & Petroleum Products (+30.33%), while the largest decrease came from Grain (-31.90%).
In the West, BNSF’s total volumes were down (-1.21%), with the largest increase coming from Motor Vehicles and Parts (+9.04%), while the largest decrease came from Metallic Ores and Metals (-11.31%). UP’s total volumes were down (-2.32%), with the largest increase coming from Metallic Ores and Metals (+21.80%), while the largest decrease came from Intermodal Units (-11.14%).
In Canada, CN’s total volumes were up (+0.83%), with the largest increase coming from Grain (+14.42%), while the largest decrease came from Other (-31.05%). CPKCS’s total volumes were down (-18.23%), with the largest increase coming from Grain (+9.53%), while the largest decrease came from Forest Products (-64.79%).
Source Data: AAR – PFL Analytics
Rig Count
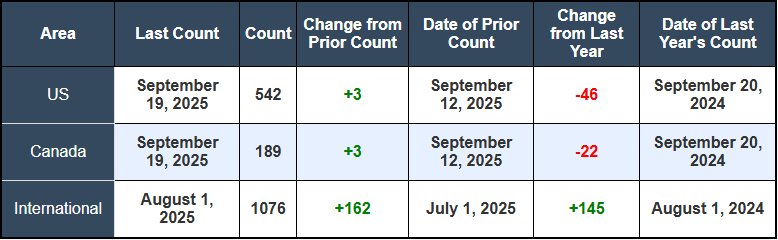
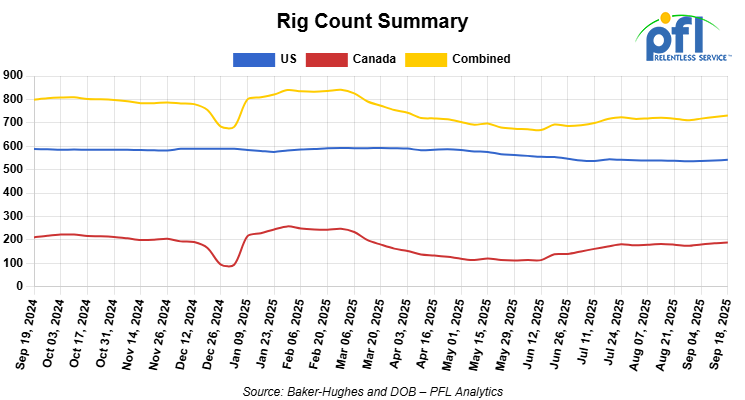
North American rig count was up by +6 rigs week-over-week. The US rig count was up by +3 rigs week-over-week, bug down by -46 rigs year-over-year. The US currently has 542 active rigs. Canada’s rig count was up by +3 rigs week-over-week, but down by -22 rigs year-over-year. Canada currently has 189 active rigs. Overall, year-over-year we are down by -68 rigs collectively.
North American Rig Count Summary
We are watching a few things out there for you:
We are Watching U.S. Grain Production – New Crop
The USDA’s 2025-26 outlook, released last week, is calling for one of the biggest harvests America has ever seen. Corn production is expected at about 16.8 billion bushels, up nearly 2% from last year and the highest on record. Harvested corn acreage is projected at 94 million acres, the most since 1933. Soybeans are pegged at 4.5 billion bushels, up 6%, and wheat at 2.0 billion bushels, up 10% year-over-year. Combined, U.S. grain production is set to rise roughly 8%.
Exports will be a big part of the story. USDA projects U.S. wheat exports at 875 million bushels, the strongest in five years. Corn exports are forecast to climb to 2.7 billion bushels; an increase of more than 300 million bushels compared with last year. Those kind of numbers translate directly into rail demand, with tens of thousands of extra railcars in unit-train loads heading to the Gulf, the Pacific Northwest, and the Great Lakes for export. This harvest timing coincides with the Union Pacific-Norfolk Southern merger review, potentially straining rail networks already operating near capacity during peak shipping season.
A typical 110-car unit grain train hauls about 400,000 bushels. At today’s forecast levels, that means roughly 42,000 grain trains will need to move during the crop year, not counting smaller shuttle and manifest moves. Keeping cycle times tight will be critical so cars don’t back up at elevators. Crews, locomotives, and terminal space are all being stretched, and this year’s bumper crop raises the stakes.
BNSF has already issued a harvest notice laying out its plans: more locomotives in grain service, more crews called to duty, and priority track time dedicated to shuttle loading. Other carriers will follow. Grain is not just another commodity—it is one of the few bulk sectors where the U.S. still dominates global trade. Moving it efficiently supports rural communities, keeps elevators open for the next loads, and shows that freight rail can still deliver under pressure.
Record grain volumes also intensify competition for rail capacity with crude oil shippers, potentially pushing energy transportation toward higher-cost alternatives or pipeline alternatives when available. The harvest peaks in October-November as farmers rush to move grain before winter weather limits transportation options, creating seasonal bottlenecks that affect all rail freight.
With record corn acreage and the strongest wheat exports in years, this fall will be a proving ground for the network. The combines are rolling, and the spotlight is on rail to move America’s harvest while managing competing demands from energy and other industrial sectors.
We are watching Petroleum Carloads
The four-week rolling average of petroleum carloads carried on the six largest North American railroads rose to 28,688 from 28,570 which was an increase of +118 rail cars week-over-week. Canadian volumes were mixed. CPKC’s shipments were higher by 13.0% week over week, CN’s volumes were lower by +5.0% week-over-week. U.S. shipments were also mixed. The NS had the largest percentage increase and was up by +19.0%. The CSX had the largest percentage decrease and was down by -14%.
We are Watching Enbridge Line 5
Folks, we have been watching this one for years believe it or not, they still want it shut down. Enbridge’s critical Line 5 pipeline is confronting significant long-term operational uncertainty, not from a scheduled maintenance outage, but from two escalating legal battles in Wisconsin and Michigan that threaten its future.
Enbridge Line 5
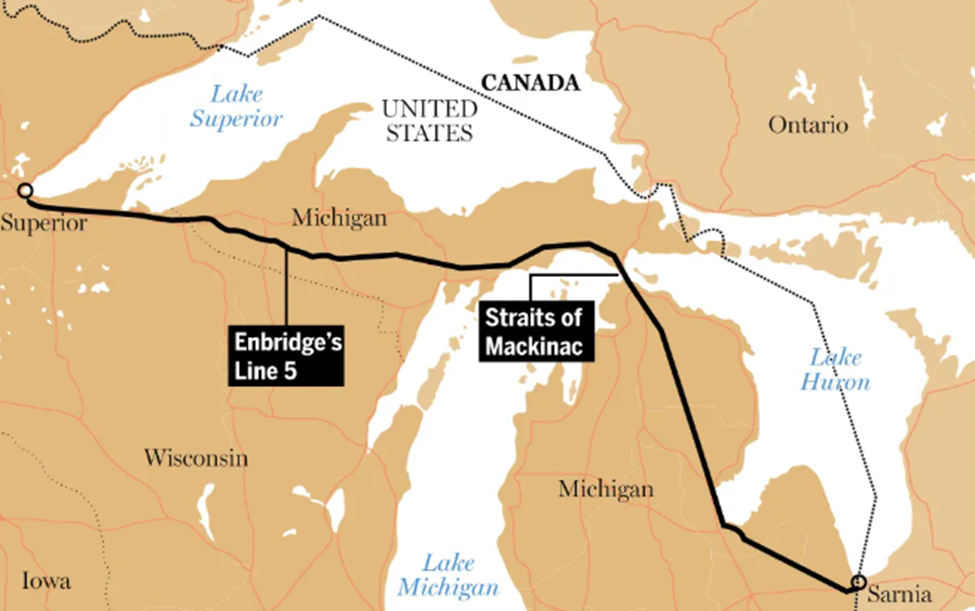
Source Data: Enbridge – PFL Analytics
The most immediate development came last week in Michigan. On September 19, the state’s Supreme Court agreed to hear a legal challenge from several Tribal Nations and environmental groups against the state permits for Enbridge’s proposed Great Lakes Tunnel project. This tunnel is designed to house a replacement segment of the pipeline beneath the Straits of Mackinac. Opponents have long argued that the existing 72-year-old dual pipelines resting on the lakebed are a “ticking time bomb” and that the proposed tunnel still carries an unacceptable risk of explosion and environmental harm to the Great Lakes. The court’s decision to take up the case, adds a new layer of uncertainty to the long-term viability of this multi-billion-dollar project.
Simultaneously, the pipeline faces a more pressing deadline in Wisconsin. A U.S. district court judge previously ruled that Enbridge has been trespassing on the Bad River Band’s tribal lands and ordered the company to cease operations on that segment by June 16, 2026—now just nine months away. Enbridge is appealing that ruling while racing to secure permits for a 41-mile reroute around the reservation. However, the company estimates the reroute would take 12-14 months to construct, putting the potential in-service date well past the court-ordered shutdown deadline.
These parallel legal and regulatory challenges in both states have created a two-front war for Enbridge. The outcome of these cases will have major implications for the 540,000-barrel-per-day pipeline, a crucial artery that supplies crude oil and natural gas liquids to refineries across Michigan, Ohio, Pennsylvania, Ontario, and Quebec. The mounting legal pressures cast significant doubt on the long-term operational certainty of this critical piece of North American energy infrastructure.
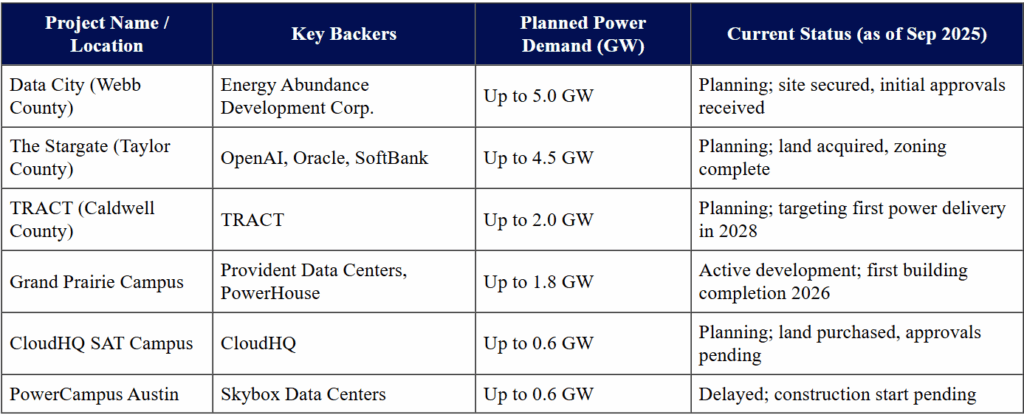
We are Watching AI, Data Centers
The structural challenges facing renewable energy are being magnified by the emergence of a massive new source of electricity demand that is fundamentally incompatible with the intermittent nature of wind and solar. The explosive growth of artificial intelligence is fueling a boom in the construction of hyperscale data centers, creating a demand shock that the current grid infrastructure is unprepared to handle.
The scale of this new demand is staggering. In Texas alone, proposals for new data centers, if all were built, would create nearly 9 gigawatts (GW) of additional electricity demand—enough to power the entire country of Switzerland. Data centers have zero tolerance for power interruptions and require perfectly stable, 24/7 electricity, a requirement that the inherent intermittency of renewables cannot meet on its own. The plan for the massive “Data City” project, for example, explicitly includes a combination of wind, solar, batteries, and natural gas turbines to ensure uninterrupted operation.
This boom exposes a critical flaw in the energy transition narrative: a focus on adding renewable generation without a commensurate investment in the grid infrastructure required to support it. Global investment in power grids has remained static at around $300 billion per year for the last decade, yet it needs to nearly double to over $600 billion annually by 2030 to accommodate a high-renewables future.
We are Watching M&A Activity in the Oil Patch
The fight for MEG Energy has intensified dramatically. On September 15th, MEG’s Board of Directors unanimously recommended that shareholders reject the revised hostile offer from Strathcona Resources. The board blasted Strathcona’s all-share offer, citing concerns over its “inferior assets,” the “overvalued” and illiquid nature of its shares, higher financial risk, and a significant “overhang risk” from the large, concentrated ownership position of Waterous Energy Fund.
Instead, the board reaffirmed its strong support for the friendly transaction with Cenovus Energy, which it valued at $28.18 per share as of September 12th. The board highlighted the Cenovus deal’s superior value, the certainty of its significant cash component (approximately 73%), and clear synergies. Cenovus followed up on September 18th with its own presentation, reinforcing the value of its offer and labeling Strathcona’s bid as “inferior” and “high risk”. With Strathcona vowing to use its 14.2% stake in MEG to vote against the Cenovus deal, the upcoming shareholder vote on October 9 remains a critical inflection point for consolidation in the oil sands.
On Monday of last week, Chord Energy announced an agreement to acquire assets in the Williston Basin from ExxonMobil subsidiary XTO Energy for $550 million in cash. This deal is a strategic consolidation of a high-quality, production-heavy asset base, expected to add approximately 9,000 barrels of oil equivalent per day. Critically, these are low-cost assets with an average NYMEX WTI breakeven price in the $40s per barrel, making them highly profitable at current prices and resilient to market downturns. The transaction is emblematic of the modern North American E&P strategy, which has pivoted to a rigorous focus on capital discipline, operational efficiency, and maximizing free cash flow from core basins. This creates a more predictable and reliable supply of barrels for the midstream and logistics sector.
As these disciplined operators continue to develop their assets, crude by rail operators can expect a more consistent stream of business from these core producing regions.
The dominant narrative of a rapid displacement of crude oil by alternative energies is proving to be fundamentally flawed. A confluence of factors—including policy-driven failures in the U.S. renewable sector, slowing EV adoption, and a massive new electricity demand shock from the technology industry—is cementing the indispensable role of fossil fuels in the continental energy mix for decades to come.
We continue to watch Canadian Left Wing Prime Minister Carney
The political landscape surrounding Canadian energy infrastructure remains the most important variable for the long-term outlook of the CBR industry. This week, a series of public statements and private communications have highlighted a federal energy policy under left wing Mark Carney that is fraught with contradictions, creating a climate of profound uncertainty that inhibits investment in permanent infrastructure and solidifies the role of rail.
Publicly, there are signs of constructive dialogue. Alberta Premier Danielle Smith expressed encouragement following recent discussions with Prime Minister Carney about a new pipeline to Canada’s West Coast, calling it her “top priority”. However, this public optimism is met with deep industry skepticism, as key market players privately express distrust in the federal government’s commitment to new fossil fuel infrastructure. This is a formidable barrier to the multi-billion-dollar investment required for a new pipeline.
The government’s dual-track approach is further exemplified by its promotion of the Pathways Alliance CCUS project. On September 11, Prime Minister Carney highlighted the project as one that could be “truly transformative,” framing it as “Pathways Plus”—a concept pairing the massive CCUS infrastructure with “a new pipeline to a variety of markets” and facilitating “new growth in the oilsands.” Despite this high-level endorsement, the project’s path forward remains mired in unresolved questions regarding the level of federal financial support, the stringency of the federal oil and gas emissions cap, and jurisdictional authority. This policy environment, attempting to appease both environmental advocates and the energy industry, results in a state of perpetual gridlock that is not conducive to long-term, capital-intensive infrastructure. For producers in Western Canada, this lack of a clear path for new pipeline capacity makes crude by rail an indispensable outlet.
The disconnect between government rhetoric and policy reality is widening, prompting another public appeal from industry leaders. Last week, major Canadian energy CEOs, including those from Enbridge, Suncor, and Canadian Natural Resources Limited, sent another open letter to Prime Minister Carney demanding urgent and sweeping regulatory changes. The campaign, under the banner “Build Canada Now,” argues the economy is “moving in the wrong direction” and calls on the federal government to eliminate the emissions cap, repeal the West Coast tanker ban, and dramatically reduce regulatory timelines for project approvals from years to months. This sustained pressure from virtually every major western Canadian oil and gas CEO, highlights the deep-seated regulatory uncertainty that continues to influence rail vs. pipeline investment decisions and long-term capacity planning.
We are Watching the Green Old Deal
While Canadian politics create uncertainty for new pipeline supply, developments in the United States are challenging the demand-side narrative of a rapid transition away from liquid fuels. Across the U.S. renewable energy sector, a combination of policy reversals, project cancellations, and slowing consumer adoption is creating significant headwinds, reinforcing the continued dominance of fossil fuels.
The U.S. offshore wind industry has faced a massive setback. In August 2025, the Trump administration issued a stop-work order for the Revolution Wind project off the coast of Rhode Island, citing unspecified “national security interests”. The project was 80% complete and set to power roughly 350,000 homes. The regional grid operator, ISO New England, has warned the delay will “increase risks to reliability” for the region’s power grid. The move has also sent a chilling effect through the investment community, jeopardizing the future of the entire U.S. offshore wind sector.
The headwinds are not confined to wind. The residential solar tax credit is being eliminated after December 31, 2025, and new legislation has dramatically shortened timelines for utility-scale projects to qualify for remaining credits. In the transportation sector, the federal EV tax credit of up to $7,500 per vehicle is set to expire on September 30, 2025. The loss of these subsidies is having a measurable impact. The growth rate of EV sales in the U.S. plummeted from 40% in 2023 to just 10% in 2024, prompting major automakers like Stellantis, Volvo, General Motors, and Mercedes-Benz to revise their ambitious EV production targets. These concurrent failures of green energy policy in both the power and transport sectors translate directly into a more robust and durable long-term demand profile for crude oil.
We are Watching the Class 1 Railroads
In the wake of the proposed Union Pacific and Norfolk Southern merger, other Class I railroads are signaling a clear preference for collaboration over consolidation. Both BNSF and CPKC have publicly stated that they are not interested in pursuing a major merger with CSX at this time. CPKC’s CEO, Keith Creel, explicitly warned that another transcontinental merger would likely trigger an “unnecessary wave of railway mergers” that would not be in the public interest.
Instead, the railroads are emphasizing partnerships and alliances as a more effective path to improving service. Recent examples include new intermodal service agreements between CSX and BNSF, and CSX and CPKC. This strategic pivot comes as activist investor Ancora Holdings continues to pressure CSX to seek a merger or replace its CEO. Even as their own mega-merger awaits a lengthy regulatory review, Union Pacific and Norfolk Southern announced a new joint intermodal service on September 15, creating a new gateway between Louisville and key markets in the West and South, demonstrating their intent to collaborate more deeply.
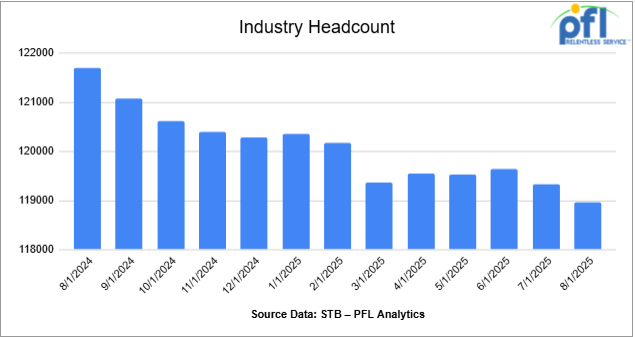
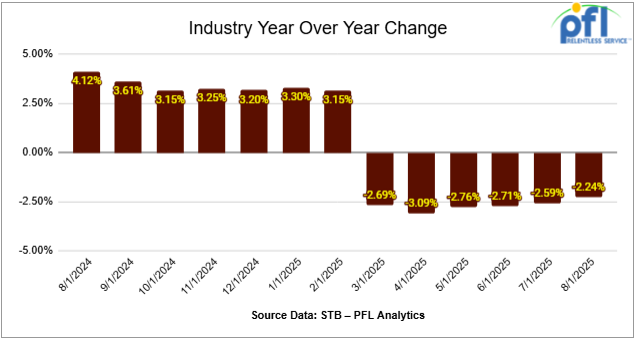
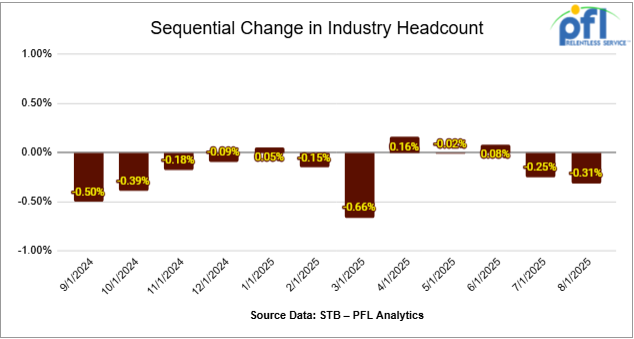
We are Watching Class 1 Head Count
Class I railroads employed 118,965 workers in the United States in August 2025, a -0.31% decrease from July 2025’s count of 119,339 and a -2.24% year-over-year decrease from August 2024’s total of 121,697, according to Surface Transportation Board data.
Two of the six employment categories posted month-over-month increases between July and August. These were Executives, officials, and staff assistants, which rose +0.46% to 8,001 workers, and Professional and administrative, which increased +0.88% to 9,302 workers.
The categories that posted month-over-month decreases were Maintenance of way and structures, down -0.04% to 29,077 workers; Maintenance of equipment and stores, down -0.29% to 17,014 workers; Transportation (other than train and engine), down -0.40% to 4,959 workers; and Transportation (train and engine), down -0.81% to 50,612 workers.
Year over year, two categories posted an employment gain, which were Executives, officials, and staff assistants up +0.93%, and Maintenance of way and structures up +0.26%.
Categories that registered year-over-year decreases in August were Professional and administrative down -6.15%; Maintenance of equipment and stores down -2.69%; Transportation (other than train and engine) down -1.41%; and Transportation (train and engine) down -3.31%.
We are watching Key Economic Indicators
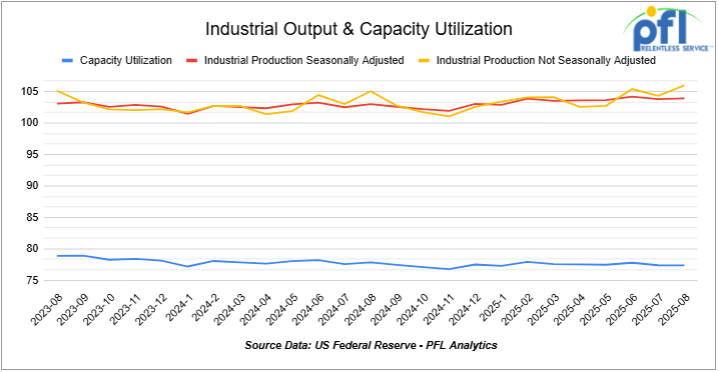
Industrial Output & Capacity Utilization
Manufacturing accounts for roughly 75% of total industrial output. In August 2025, manufacturing output increased by 0.2% m/m, following a decline in July, and is +0.9% y/y. Total capacity utilization was 77.4%, down slightly from 77.5% (still about 2.2 pp below its long-run average). Manufacturing capacity utilization edged up to 76.8%, still pointing to persistent slack even as headline output shows modest improvement.
Lease Bids
- 30-50, 6000cf Steel Hopper located off of CSX or NS in East. For use in petcoke service. Period: 5 Years.
- 50, 5000CF Covered Hopper located off of UP or BN in Houston. For use in Fertilizer service. Period: 6 Months. Bid: Negotiable.Needed ASAP.
- 10, 2500CF Open Top Hopper located off of UP or BN in Texas. For use in aggregate service. Period: 5 years. Bid: Negotiable.Need Rapid Discharge Doors.
- 10, 25.5K Any Type Tank located off of CSX in Florida. For use in UCO service. Period: 2 Years. Bid: Negotiable.
- 15-20, 29K 117R Tank located off of NS or CSX in Ohio. For use in Ply Oil service. Period: 6-12 Months. Bid: Negotiable.
- 10, 30K 117R or 117J Tank located off of Any Class 1 in USA. For use in Glycerin service. Period: 1 year. Bid: Negotiable.
- 50, 23.5-25.5 DOT111 Tank located off of Any Class 1 in USA. For use in Asphalt service. Period: 5 years. Bid: Negotiable.
- 50-100, 33K 117J Tank located off of BN or UP in Bellview. For use in Butane/ service. Period: Sept-March. Bid: Negotiable.
- 4, 30K 117J Tank located off of Any Class 1 in Michigan. For use in Food Grade Ethanol service. Period: Multi year. Bid: Negotiable.
- 50, 33K 117J Tank located off of CP or CN in Canada. For use in Propane service. Period: Summer. Bid: Negotiable.
- 100, 21.9K 117J Tank located off of All Class 1s in Midwest. For use in CO2 service. Period: 6 months. Bid: Negotiable.
- 20, 25.5K Any Type Tank located off of UP in Point Comfort, TX. For use in Diethylene Glycol service. Period: 3-5 Years. Bid: Negotiable.No Lining Required.
- 100, 33K Tank Pressure located off of CN or CP in Canada. For use in Propane service. Period: Winter. Bid: Negotiable.
Sales Bids
- 28, 3400CF Covered Hopper located off of UP BN in Texas. For use in Cement service. Bid: Negotiable.Cement Gates needed..
- 20, 17K Tank DOT111 located off of various class 1s in various locations. For use in corn syrup service. Bid: Negotiable.
- 120, Various Gondola Open-Top Aluminum Rotary located off of various class 1s in various locations. For use in Sulphur service. Bid: Negotiable.Built 2004 or later.
Lease Offers
- 60, 4750 Covered Hoppers located off of UP or BN in Eads, CO. Last used in Grain. Offer: Negotiable. UP to 5 Years, 3 Hopper, Gravity Gate, Trough Hatches.
- 100, 6250 Covered Hoppers located off of UP in US. Last used in DDG. Offer: Negotiable. 1 Year term. Dirty to Dirty. Free move on UP..
- 24, 25.5K-30K DOT111 Tanks located off of UP or BN in Texas. Last used in Base Oils. Offer: Negotiable. 1-2 Year.
- 25, 19.6K DOT111 Tanks located off of UP in US. Last used in Molases. Offer: Negotiable.
- 50, 20K DOT111 Tanks located off of UP or BN in Wichita Falls, TX. Last used in HCL. Offer: Negotiable.
- 50, 30K 117R Tanks located off of CSX, NS, or CN in Detroit. Last used in Diesel. Offer: Negotiable. Multiyear.
- 50, 20K 117J Tanks located off of All Class 1s in Multiple Locations. Last used in Styrene. Offer: Negotiable. Cars are currently moving.
- 22, 25.5K DOT111 Tanks located off of UP in Texas. Last used in Asphalt. Offer: Negotiable.
- 40, 33K 340W Tanks located off of CPKC or UP in Texas. Last used in Propane or Butane. Offer: Negotiable. Available for winter or 1 year.
- 29, 25.5K Tanks 117J located off of BN or UP in Texas. Last used in Clean. Offer: Negotiable.
Sales Offers
- 21, 50′ Boxcar Plate Cs located off of various class 1s in NM. Offer: Negotiable. End of Life.
- 3, 50′ Boxcar Plate Cs located off of various class 1s in multiple locations. Offer: Negotiable. End of Life.
- 27, 50′ Boxcar Plate Cs located off of various class 1s in PQ. Offer: Negotiable. End of Life.
- 100, 3250 Covered Hoppers located off of various class 1s in multiple locations. Offer: Negotiable. Sand Cars.
- 5, 2740 Mill Gondolas located off of various class 1s in NC. Offer: Negotiable. End of Life.
- 1, 2260 Mill Gondolas located off of various class 1s in AL. Offer: Negotiable. End of Life.
- 30, 2740 Mill Gondolas located off of various class 1s in multiple locations. Offer: Negotiable. End of Life.
- 21, 2740 Mill Gondolas located off of various class 1s in WA. Offer: Negotiable. End of Life.
- 9, 4750 Covered Hoppers located off of various class 1s in multiple locations. Offer: Negotiable. End of Life.
- 5, 4750 Covered Hoppers located off of various class 1s in multiple locations. Offer: Negotiable. End of Life.
- 50, 31.8K Tank CPC 1232s located off of UP or BN in TX. Offer: Negotiable. Requal Due in 2025.
- 100, 4600CF Open Top Hoppers located off of BN or CSX in Southeast. Offer: Negotiable. N/A.
Call PFL today to discuss your needs and our availability and market reach. Whether you are looking to lease cars, lease out cars, buy cars, or sell cars call PFL today at 239-390-2885
Live Railcar Markets
| CAT | Type | Capacity | GRL | QTY | LOC | Class | Prev. Use | Offer | Note |
|---|
PFL will be at the Following Conferences

- Where: La Quinta, CA
- Attending: David Cohen (954-729-4774)
- Conference Website

- Where: Hyatt Regency Dallas in Dallas, TX
- Attending:Curtis Chandler (239.405.3365), David Cohen (954-729-4774), Brian Baker (239.297.4519), Cyndi Popov(403) 402-5043
- Conference Website