
“By three methods we may learn wisdom: First, by reflection, which is noblest; Second, by imitation, which is easiest; and third by experience, which is the bitterest.”
– Confucius
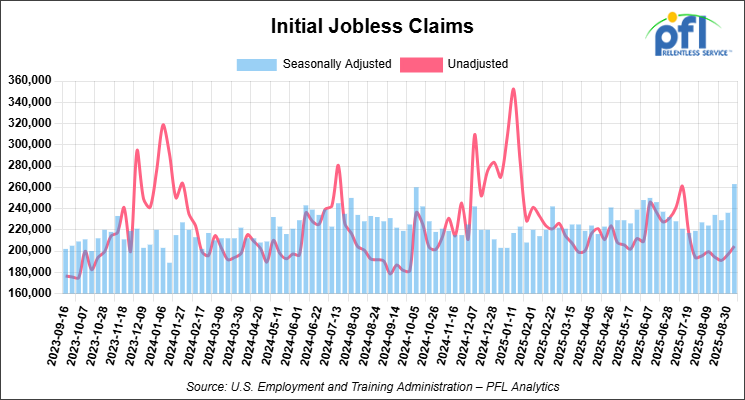
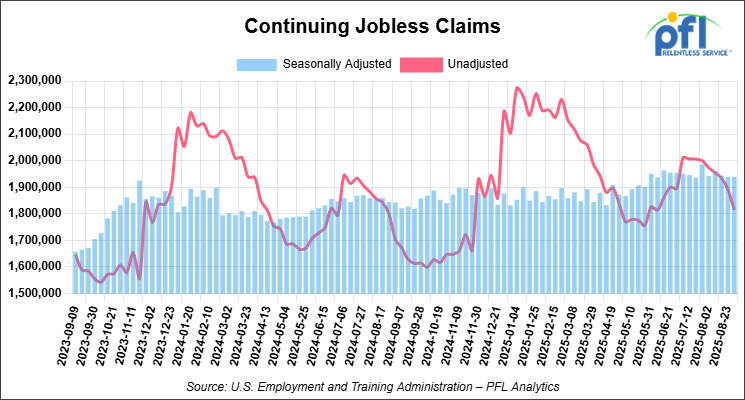
Jobs Update
• Initial jobless claims seasonally adjusted for the week ending September 6, 2025, came in at 263,000, versus the adjusted number of 236,000 people from the week prior, up 27,000 people week over week.
• Continuing jobless claims came in at 1,939,000, versus the adjusted number of 1,939,000 people from the week prior, flat week over week.
Stocks closed mixed on Friday of last week, but higher week-over-week
The DOW closed lower on Friday of last week, down -273.78 points (-0.59%), closing out the week at 45,834.22, but up 433.36 points week-over-week. The S&P 500 closed lower on Friday of last week, down -3.18 points (-0.05%), and closed out the week at 6,584.29, up 102.79 points week-over-week. The NASDAQ closed higher on Friday of last week, up 98.03 points (0.44%), and closed out the week at 22,141.10, up 440.71 points week-over-week.
In overnight trading, DOW futures traded higher and are expected to open at 45,949 this morning, up 95 points from Friday’s close.
Crude oil closed higher on Friday of last week and higher week-over-week
West Texas Intermediate (WTI) crude closed up 32 cents per barrel (0.51%), to close at $62.69 on Friday of last week, and up 82 cents week-over-week. Brent crude closed up 62 cents per barrel (0.93%), to close at $66.99, and up $1.49 week-over-week.
One Exchange WCS (Western Canadian Select) for September delivery settled on Friday of last week at US$11.10 below the WTI-CMA (West Texas Intermediate – Calendar Month Average). The implied value was US$52.99 per barrel.
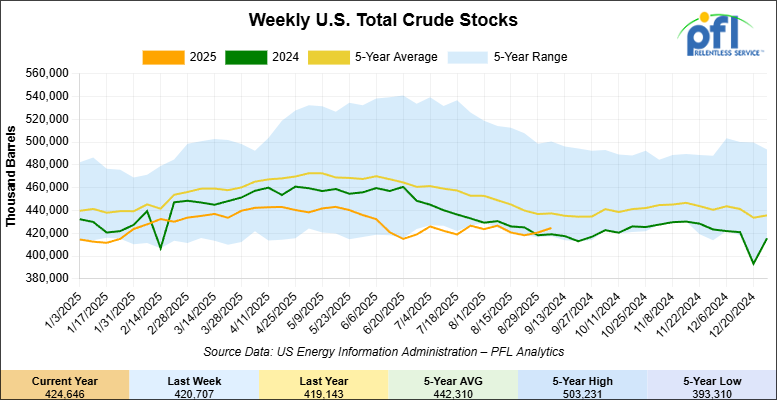
U.S. commercial crude oil inventories (excluding those in the Strategic Petroleum Reserve) increased by 3.9 million barrels week-over-week. At 424.6 million barrels, U.S. crude oil inventories are 3% below the five-year average for this time of year
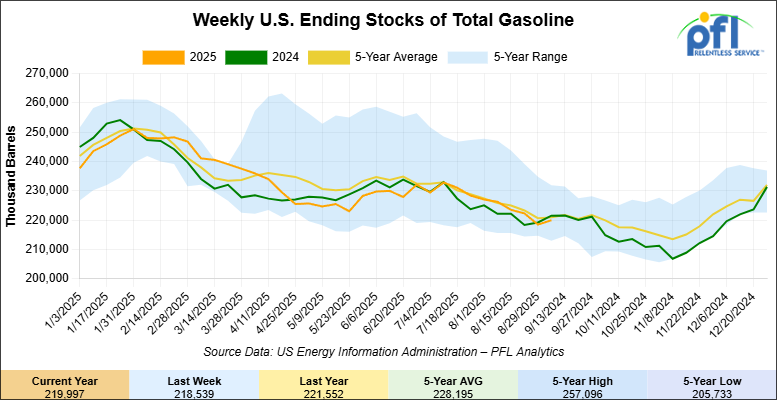
Total motor gasoline inventories increased by 1.5 million barrels week-over-week and are at the five-year average for this time of year.
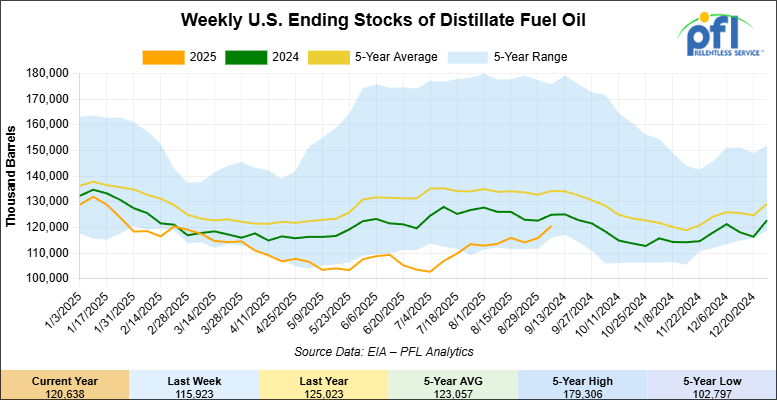
Distillate fuel inventories increased by 4.7 million barrels week-over-week and are 9% below the five-year average for this time of year.
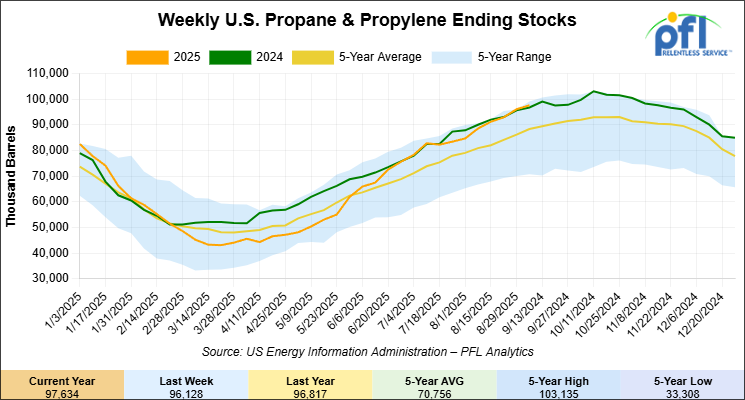
Propane/propylene inventories increased by 1.5 million barrels week-over-week and are 12% above the five-year average for this time of year.
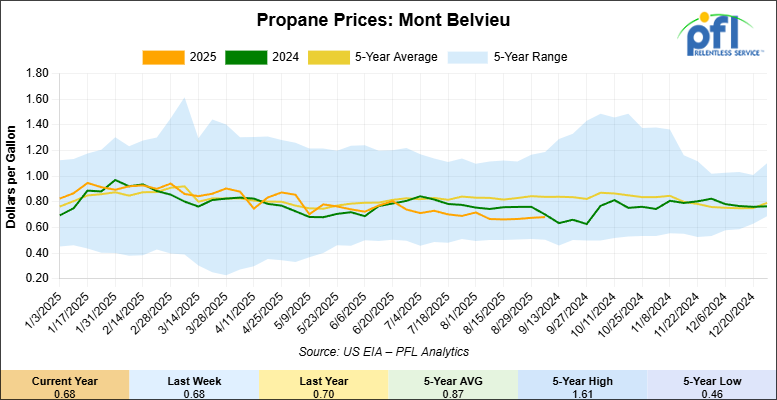
Propane prices closed at 68 cents per gallon on Friday of last week, up 1 cent per gallon week-over-week, and down 8 cents per gallon year-over-year.
Overall, total commercial petroleum inventories increased by 15.4 million barrels during the week ending September 5, 2025.
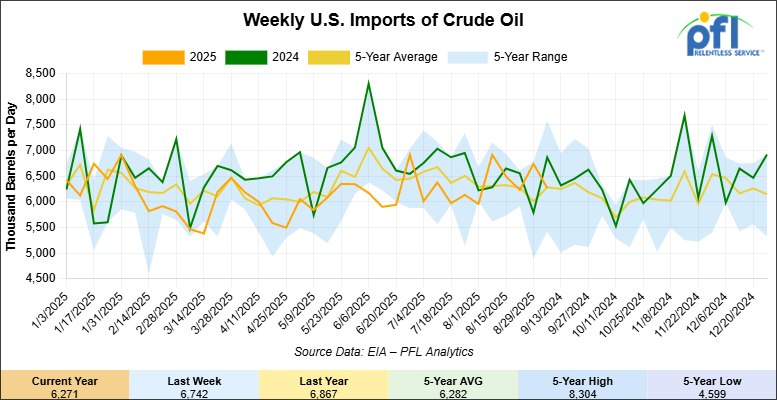
U.S. crude oil imports averaged 6.3 million barrels per day during the week ending September 5, 2025, a decrease of 471,000 barrels per day week-over-week. Over the past four weeks, crude oil imports averaged 6.4 million barrels per day, 0.5% less than the same four-week period last year. Total motor gasoline imports (including both finished gasoline and gasoline blending components) averaged 681,000 barrels per day, and distillate fuel imports averaged 217,000 barrels per day during the week ending September 5, 2025.
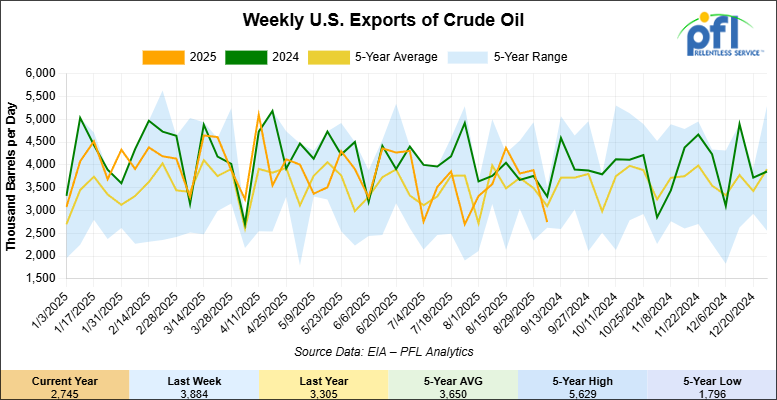
U.S. crude oil exports averaged 2.745 million barrels per day during the week ending September 5, 2025, a decrease of 1.139 million barrels per day week-over-week. Over the past four weeks, crude oil exports averaged 3.703 million barrels per day.
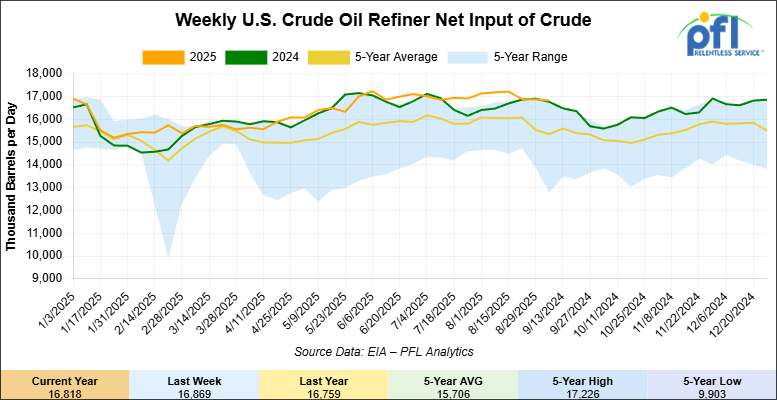
U.S. crude oil refinery inputs averaged 16.8 million barrels per day during the week ending September 5, 2025, which was 51,000 barrels per day less than the previous week’s average.
WTI futures are poised to open at $63.04, up 35 cents from Friday’s close.
North American Rail Traffic
Week Ending September 10, 2025:
Total North American weekly rail volumes were down (-2.91%) in week 37, compared with the same week last year. Total Carloads for the week ending September 10, 2025 were 310,289, down (-3.50%) compared with the same week in 2024, while weekly Intermodal volume was 312,037, down (-2.31%) year over year. 10 of the AAR’s 11 major traffic categories posted year-over-year decreases. The largest decrease came from Forest Products (-14.26%), while the largest increase was Motor Vehicles and Parts (+8.73%).
In the East, CSX’s total volumes were up (+0.54%), with the largest decrease coming from Metallic Ores and Metals (-23.24%), while the largest increase came from Nonmetallic Minerals (+12.14%). NS’s total volumes were up (+1.84%), with the largest increase coming from Petroleum & Petroleum Products (+24.51%), while the largest decrease came from Farm Products (-6.35%).
In the West, BNSF’s total volumes were down (-1.61%), with the largest increase coming from Motor Vehicles and Parts (+10.44%), while the largest decrease came from Coal (-27.74%). UP’s total volumes were down (-6.75%), with the largest increase coming from Motor Vehicles and Parts (+21.88%), while the largest decrease came from Coal (-10.45%).
In Canada, CN’s total volumes were down (-5.93%), with the largest increase coming from Grain (+45.71%), while the largest decrease came from Nonmetallic Minerals (-28.30%). CPKCS’s total volumes were down (-16.75%), with the largest increase coming from Nonmetallic Minerals (+28.20%), while the largest decrease came from Forest Products (-67.07%).
Source Data: AAR – PFL Analytics
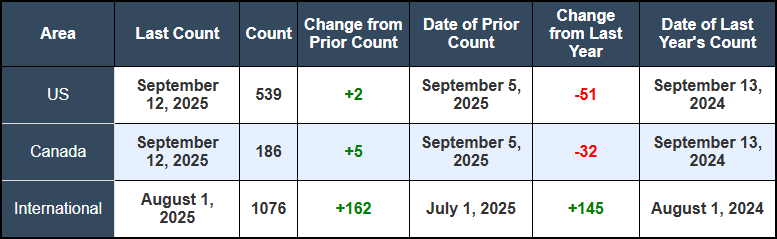
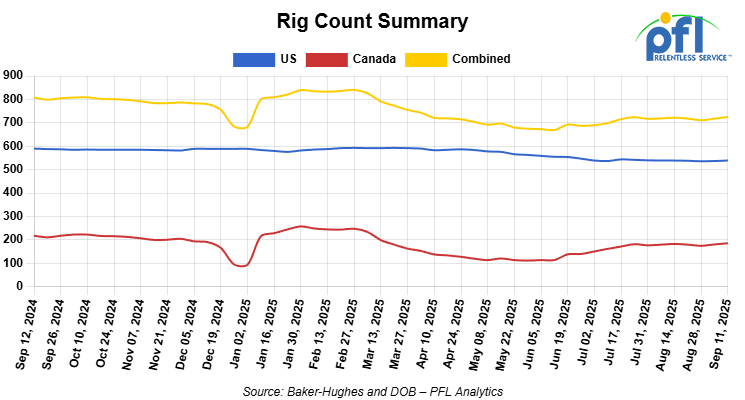
Rig Count
North American rig count was up by +7 rigs week-over-week. US rig count was up by +2 rigs week-over-week, but down by -51 rigs year-over-year. The US currently has 539 active rigs. Canada’s rig count was up by +5 rigs week-over-week, but down by -32 rigs year-over-year. Canada currently has 186 active rigs. Overall, year-over-year we are down by -83 rigs collectively.
North American Rig Count Summary
We are watching a few things out there for you:
PFL Attended AIHA Conference in Edmonton, Alberta, Canada Last Week
Last week in Edmonton, the Alberta Industrial Heartland Association (AIHA) conference drew a packed house, over 1000 attendees, of industry leaders, government officials, and community members. The outlook was positive, but the message was clear: the Heartland is growing faster than its infrastructure, and rail will decide whether projects move ahead or get left waiting.
Premier Danielle Smith spoke at the conference and underlined Alberta’s push to cut red tape and speed up approvals for major projects. Fort Saskatchewan Mayor, Gale Katchur, was also named the new Chair of AIHA, showing strong local support for continued industrial growth.
On the rail side, two major capacity projects grabbed attention. One expansion already underway will nearly double existing storage and staging space, adding thousands of new car spots and unit-train tracks, with completion expected in 2026. Another terminal planned for Strathcona County will include loop tracks, transloading facilities, and space for more than 1,000 cars. Its standout feature is dual service by both CN and CPKC, a rare setup in Western Canada that gives shippers more choice and leverage. That project is scheduled to begin phased construction in 2025, pending approvals.
The impact will be felt across the board. More storage and staging means less congestion, more reliable scheduling, and better market access. Many attendees noted that rail and terminals dominated the conversation, with infrastructure seen as the key to unlocking the Heartland’s next wave of growth.
Jobs and economics were another theme. Between construction and permanent roles, these projects are expected to create dozens of jobs and deliver tens of millions of dollars a year into the local economy once operational. For Alberta, this reinforces the Heartland’s role as the province’s industrial engine. For Canada, it strengthens the country’s ability to compete with U.S. hubs like the Gulf Coast and Midwest.
Cyndi Popov from PFL’s Calgary office and our company President, Curtis Chandler,were there representing PFL.
The takeaway from Edmonton was straightforward: rail isn’t just part of the Heartland’s story anymore, it’s driving it. How quickly new capacity comes online will decide how fast Alberta grows, and how well Canada holds its ground in global markets. For more information on what’s going on In Alberta call PFL today.
We are watching a few things out there for you:
We are watching Petroleum Carloads
The four-week rolling average of petroleum carloads carried on the six largest North American railroads rose to 28,570 from 28,262 which was an increase of +308 rail cars week-over-week. Canadian volumes were lower. CPKC’s shipments were lower by -11.0% week over week, CN’s volumes were lower by -4.0% week-over-week. U.S. shipments were mixed. The CSX had the largest percentage increase and was up by +18.0%. The UP had the largest percentage decrease and was down by -12%.
We are Watching Left Wing Canadian Prime Minister Carney
The Carney government has been especially vocal about promoting the Port of Churchill as Canada’s answer to diversifying energy exports away from the U.S., but industry experts are calling out the scheme as economically nonsensical. Federal Energy Minister Tim Hodgson continues pushing the fantasy that new Polar Class 2 icebreakers will transform Churchill from a four-month seasonal port into a year-round energy export hub, ignoring basic Arctic shipping realities.
“It will never be possible for a Churchill to compete with Vancouver or Montreal,” bluntly stated MLI’s Heather Exner-Pirot, noting that “a seasonal port is a far worse investment than a year-round port”. Even the Russian Arctic model costs $300 million with ice-capable tankers versus standard $200 million vessels, and Yamal LNG can only ship eastbound during summer months, despite the expensive fleet. Building a pipeline to Churchill has been a topic that Alberta Premier Daniel Smith suggested that if Alberta and the Province of Saskatchewan ever separated would be a good thing to build – seems to us the Liberal government of Canada are running with it, however, the costs and getting operational particularly as a Country are years away. For our readers who don’t know where Churchill Manitoba is in relation to Alberta, see below:
Pipeline to Churchill , Manitoba
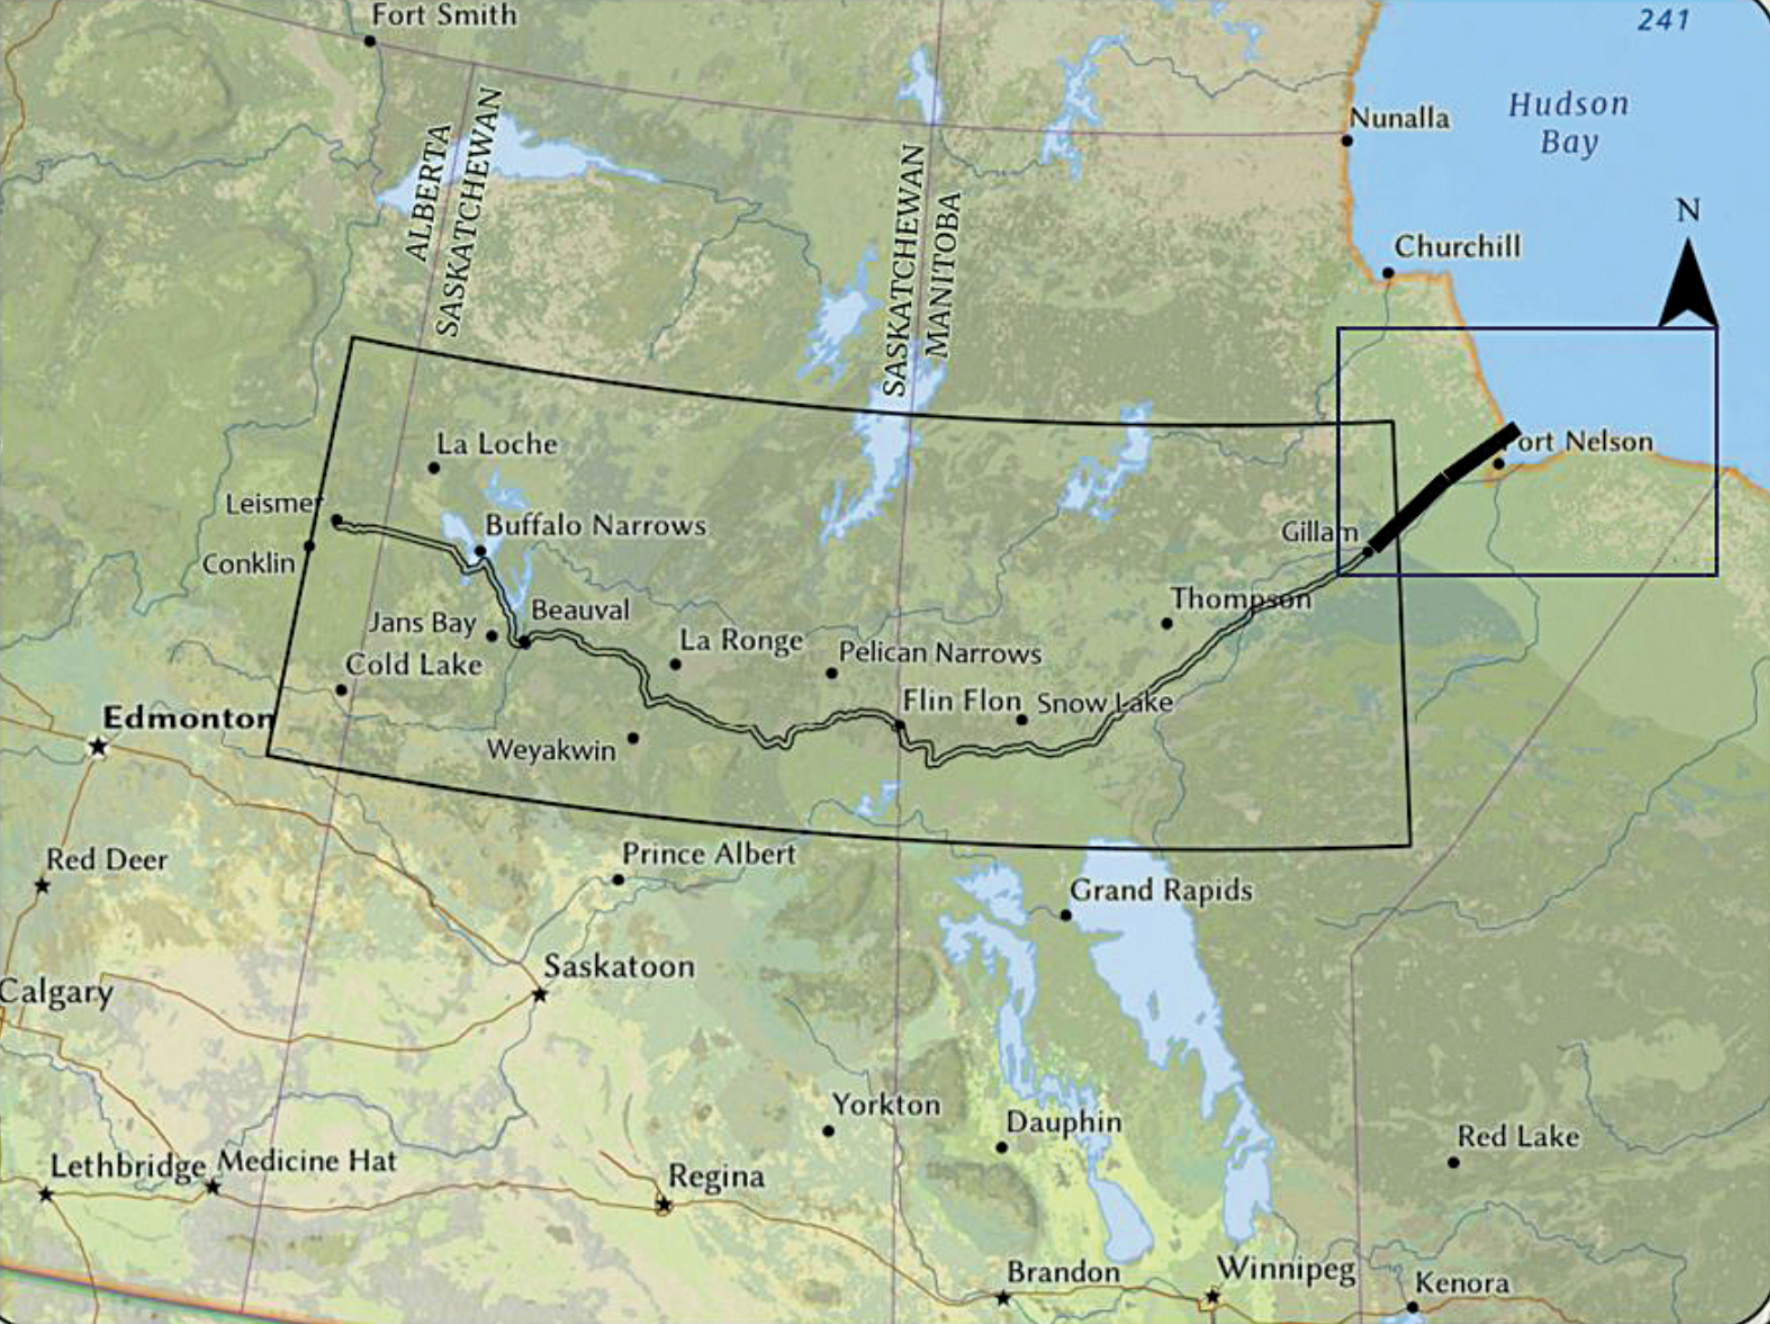
Source: First Nations of Manitoba PFL Analytics
We are watching MEG Energy
The $7.9 billion Cenovus-MEG Energy merger faced a fierce challenge from Strathcona Resources last week, which upped its bid to $30.86 per share – a 10% premium to the Cenovus offer. With Strathcona owning 14.2% of MEG shares and vowing to vote against the Cenovus deal, the October 9 shareholder vote is far from certain.
The stakes are enormous for crude-by-rail operators. The merger would create a 556,000 barrel-per-day bitumen producer, cementing Cenovus as the dominant oil sands player. MEG’s Christina Lake operation alone produces 83,000 b/d, with approved capacity to expand to 210,000 b/d. A combined entity would have significant leverage over Western Canadian crude pricing and rail transport decisions, potentially squeezing smaller shippers out of premium rail slots.
Alberta’s oil sands hold 166 billion barrels of recoverable reserves – the world’s fourth-largest oil reserves. With July bitumen output hitting a record 2.3 million b/d, consolidation is accelerating as producers seek scale advantages. We are watching this on closely for more information call PFL today
We are Watching West Coast Refinery Closures
California’s refining map is about to change dramatically. Phillips 66’s Los Angeles refinery and Valero’s Benicia plant—together almost 300,000 barrels per day—are both slated to close or pivot to alternate uses by the middle of 2026. Independent analysis and recent infrastructure coverage puts the figure at 15–17% of West Coast capacity vanishing in the next year, with major knock-on effects for local supply, product imports, and heavy crude demand.
The EIA note that these changes will tighten the gasoline and diesel markets, boost import demand, and, critically, reduce direct demand for Canadian heavy barrels just as TMX and marine exports had dramatically expanded market share on the coast. Canadian crude deliveries into California and Washington had jumped by as much as 75% year-on-year since TMX opened, but the substantial loss of local processing means westbound Canadian flows are likely to peak in 2025 and then flatten or drop. Public refinery closure plans and product supply forecasts show consensus: less local cracking capacity means more imported finished fuels.
We are Watching Biofuels
The EIA cut renewable diesel forecasts for the third straight month, dropping 2025 demand by 10,000 b/d to 170,000 b/d and 2026 from 230,000 to 220,000 b/d. Biodiesel demand also plummeted by 10,000 b/d to 80,000 b/d for 2025, with 2026 cut to 90,000 b/d.
RIN prices collapsed below $1 last week, but slightly rebounded on Friday of last week on the back of profit taking and swelling inventory. Markets reacted to a Senate bill preventing EPA reallocation of renewable fuel obligations. D6 RINs dropped to 96 and ½ of a cent per RIN on Wednesday of last week – the lowest since June 12 while the BOHO spread fell to $1.4249, making biofuel blending uneconomic. Refiners are retreating from expensive renewable mandates to traditional crude oil we may see increased rail demand.
We are Watching North American Energy Integration Deepen
U.S. crude production has grown from less than 6 million b/d in 2011 to over 13 million b/d, while Canadian production rose from 3 million b/d to 5.5 million b/d. Most Canadian growth has been in heavy-sour crude well-suited for complex U.S. refineries, with cross-border flows doubling over 14 years.
Cross-border crude flows total over 4 million b/d, making the U.S. and Canada function as one massive, interdependent energy system. Changes in pipeline capacity, rail availability, or regulatory policy in either country directly impact the other, creating both opportunities and risks for crude by rail operators.
We are Watching a Shipping Collapse
The Premier Alliance suspended its Pacific South 5 (PS5) service in early September, with the last sailing departing Ningbo on September 8, 2025. The service, launched just three months earlier in June 2025, connected major Asian and West Coast ports using three ships of 4,600-4,900 TEU capacity.
Multiple carriers are now announcing blanked sailings across the trans-Pacific as container demand softens dramatically. Maersk suspended its seasonal TP9 service, while other carriers implement “strategic sailing cuts” to prop up collapsing spot rates.
For crude-by-rail operators, this creates significant opportunities through reduced competition for shared rail infrastructure. Intermodal containers and crude oil unit trains compete for the same BNSF and Union Pacific track capacity, terminal slots, and priority scheduling. When container volumes decline, Class I railroads have excess capacity they need to fill at competitive rates.
North America is the only global region experiencing negative container volume growth during 2025. The National Retail Federation expects import volumes to “steadily decline for the rest of the year”, which directly benefits crude-by-rail shippers through; (1) better rail rates as railroads compete for remaining freight volume, (2) premium scheduling slots previously reserved for high-priority intermodal services (3) reduced congestion on critical bottleneck routes through the Rockies, and (4) access to underutilized staging yards for rail car storage and switching operations.
The collapse also impacts refineries that typically balance imported crude via tanker with domestic crude via rail. Reduced marine activity creates opportunities for rail-delivered crude to capture larger market share as supply chain reliability becomes more valuable than ever.
We Are Watching Key Economic Indicators
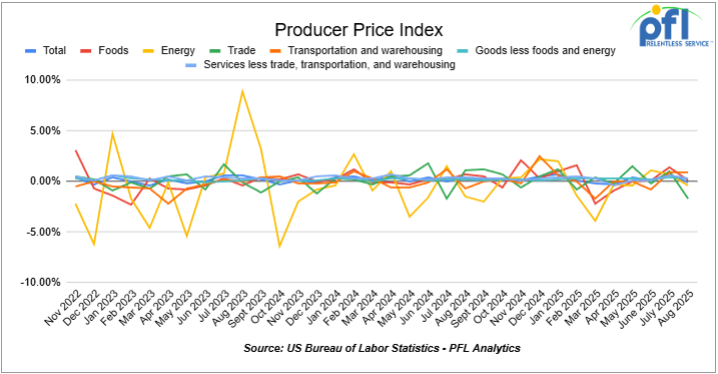
Producer Price Index
In August, the PPI for final demand declined 0.1% m/m after rising 0.7% in July, and increased 2.2% y/y. Core PPI (final demand less foods, energy, and trade services) rose 0.3% m/m and 2.6% y/y. The monthly decline was driven by services (−0.2%), including a 1.7% drop in trade margins; transportation and warehousing rose 0.9%, and services excluding trade, transportation, and warehousing were up 0.3%. Goods prices edged up 0.1%, including +0.1% for foods, −0.4% for energy, and +0.3% for goods excluding food and energy.
In August 2025, the CPI rose 0.4% m/m, after increasing 0.2% in July, and was up 2.9% y/y, up from 2.7% the prior year. Core CPI (all items less food and energy) rose 0.3% m/m, matching July’s gain, and was up 3.1% y/y. The monthly increase was led by shelter (+0.4%), which was the largest contributor; food rose 0.5% (food at home +0.6%, food away from home +0.3%); energy increased 0.7%, including gasoline up 1.9%.
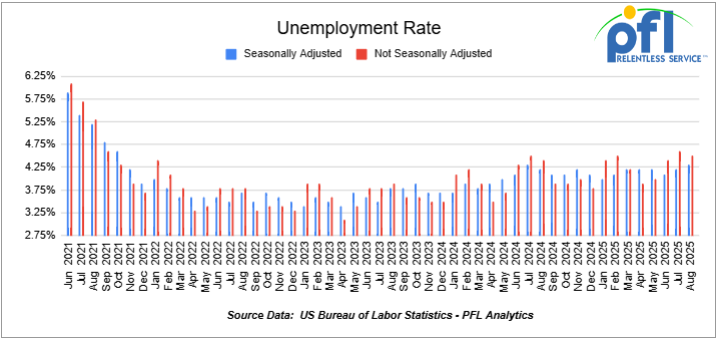
U.S Unemployment
On September 6th, the BLS reported that a preliminary 142,000 net new jobs were created in August 2024. Figures for prior months were revised downward. July was revised down to 89,000 new jobs and June to 179,000.
According to the BLS, so far this year, net new job gains have totaled 1.47 million. The official unemployment rate was 4.2% in August, down 0.1% month over month.
Lease Bids
- 30-50, 6000cf Steel Hopper located off of CSX or NS in East. For use in petcoke service. Period: 5 Years.
- 50, 5000CF Covered Hopper located off of UP or BN in Houston. For use in Fertilizer service. Period: 6 Months. Bid: Negotiable.Needed ASAP.
- 10, 2500CF Open Top Hopper located off of UP or BN in Texas. For use in aggregate service. Period: 5 years. Bid: Negotiable.Need Rapid Discharge Doors.
- 10, 25.5K Any Type Tank located off of CSX in Florida. For use in UCO service. Period: 2 Years. Bid: Negotiable.
- 15-20, 29K 117R Tank located off of NS or CSX in Ohio. For use in Ply Oil service. Period: 6-12 Months. Bid: Negotiable.
- 10, 30K 117R or 117J Tank located off of Any Class 1 in USA. For use in Glycerin service. Period: 1 year. Bid: Negotiable.
- 50, 23.5-25.5 DOT111 Tank located off of Any Class 1 in USA. For use in Asphalt service. Period: 5 years. Bid: Negotiable.
- 50-100, 33K 117J Tank located off of BN or UP in Bellview. For use in Butane/ service. Period: Sept-March. Bid: Negotiable.
- 4, 30K 117J Tank located off of in Michigan. For use in Food Grade Ethanol service. Period: Multi year. Bid: Negotiable.
- 50, 33K 117J Tank located off of CP or CN in Canada. For use in Propane service. Period: Summer. Bid: Negotiable.
- 100, 21.9K 117J Tank located off of All Class 1s in Midwest. For use in CO2 service. Period: 6 months. Bid: Negotiable.
- 20, 25.5K Tank Any Type located off of UP in Point Comfort, TX. For use in Diethylene Glycol service. Period: 3-5 Years. Bid: Negotiable. No Lining Required.
Sales Bids
- 28, 3400CF Covered Hopper located off of UP BN in Texas. For use in Cement service. Bid: Negotiable.Cement Gates needed..
- 20, 17K Tank DOT111 located off of various class 1s in various locations. For use in corn syrup service. Bid: Negotiable.
- 120, Various Gondola Open-Top Aluminum Rotary located off of various class 1s in various locations. For use in Sulphur service. Bid: Negotiable.Built 2004 or later.
Lease Offers
- 60, 4750 Covered Hoppers located off of UP or BN in Eads, CO. Last used in Grain. Offer: Negotiable. UP to 5 Years, 3 Hopper, Gravity Gate, Trough Hatches.
- 100, 6250 Covered Hoppers located off of UP in US. Last used in DDG. Offer: Negotiable. 1 Year term. Dirty to Dirty. Free move on UP..
- 24, 25.5K-30K DOT111 Tanks located off of UP or BN in Texas. Last used in Base Oils. Offer: Negotiable. 1-2 Year.
- 25, 19.6K DOT111 Tanks located off of UP in US. Last used in Molases. Offer: Negotiable.
- 50, 20K DOT111 Tanks located off of UP or BN in Wichita Falls, TX. Last used in HCL. Offer: Negotiable.
- 50, 30K 117R Tanks located off of CSX, NS, or CN in Detroit. Last used in Diesel. Offer: Negotiable. Multiyear.
- 50, 20K 117J Tanks located off of All Class 1s in Multiple Locations. Last used in Styrene. Offer: Negotiable. Cars are currently moving.
- 22, 25.5K DOT111 Tanks located off of UP in Texas. Last used in Asphalt. Offer: Negotiable.
- 40, 33K Tanks 340W located off of CPKC or UP in Texas. Last used in Propane or Butane. Offer: Negotiable. Available for winter or 1 year.
Sales Offers
- 21, 50′ Boxcar Plate Cs located off of various class 1s in NM. Offer: Negotiable. End of Life.
- 3, 50′ Boxcar Plate Cs located off of various class 1s in multiple locations. Offer: Negotiable. End of Life.
- 27, 50′ Boxcar Plate Cs located off of various class 1s in PQ. Offer: Negotiable. End of Life.
- 100, 3250 Covered Hoppers located off of various class 1s in multiple locations. Offer: Negotiable. Sand Cars.
- 5, 2740 Mill Gondolas located off of various class 1s in NC. Offer: Negotiable. End of Life.
- 1, 2260 Mill Gondolas located off of various class 1s in AL. Offer: Negotiable. End of Life.
- 30, 2740 Mill Gondolas located off of various class 1s in multiple locations. Offer: Negotiable. End of Life.
- 21, 2740 Mill Gondolas located off of various class 1s in WA. Offer: Negotiable. End of Life.
- 9, 4750 Covered Hoppers located off of various class 1s in multiple locations. Offer: Negotiable. End of Life.
- 5, 4750 Covered Hoppers located off of various class 1s in multiple locations. Offer: Negotiable. End of Life.
- 50, 31.8K Tank CPC 1232s located off of UP or BN in TX. Offer: Negotiable. Requal Due in 2025.
Call PFL today to discuss your needs and our availability and market reach. Whether you are looking to lease cars, lease out cars, buy cars, or sell cars call PFL today at 239-390-2885
Live Railcar Markets
| CAT | Type | Capacity | GRL | QTY | LOC | Class | Prev. Use | Offer | Note |
|---|
PFL will be at the Following Conferences

- Where: La Quinta, CA
- Attending: David Cohen (954-729-4774)
- Conference Website

- Where: Hyatt Regency Dallas in Dallas, TX
- Attending:Curtis Chandler (239.405.3365), David Cohen (954-729-4774), Brian Baker (239.297.4519), Cyndi Popov(403) 402-5043
- Conference Website