
The key is to keep company only with people who uplift you, whose presence calls forth your best.
– Epictetus
Jobs Update
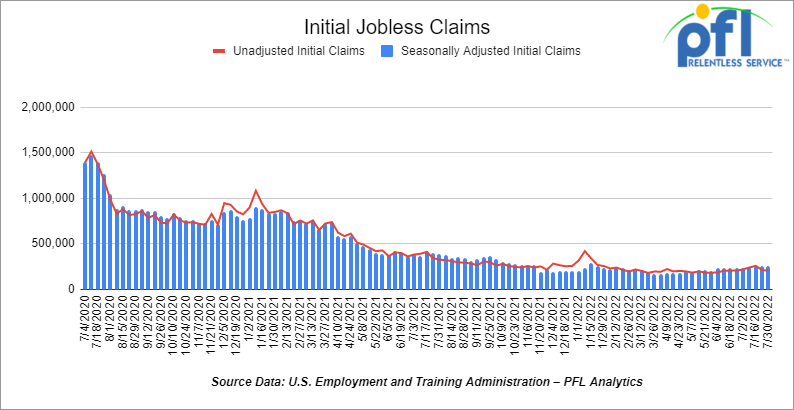
- Initial jobless claims for the week ending July 30th, 2022 came in at 260,000, up 6,000 people week-over-week.
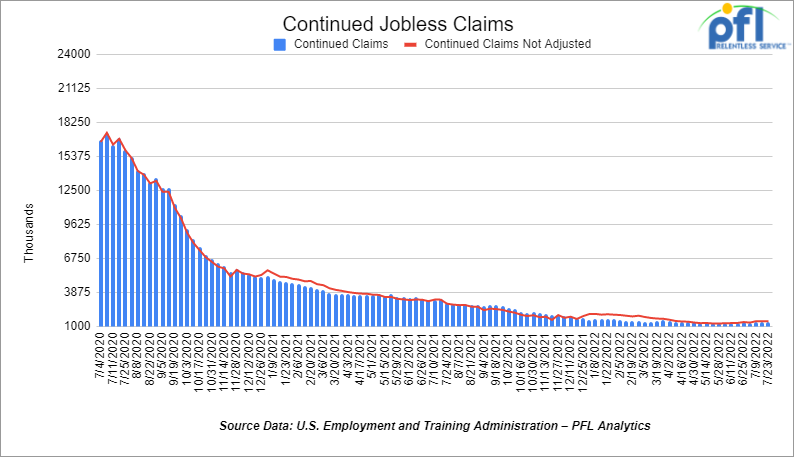
- Continuing claims came in at 1.416 million people, versus the adjusted number of 1.368 million people from the week prior, up 48,000 people week over week.
Stocks closed mixed on Friday of last week and mixed week over week
The DOW closed higher on Friday of last week, up 76.65 points (0.23%), closing out the week at 32,803.47, down -41.66 points week over week. The S&P 500 closed lower on Friday of last week, down -6.75 (-0.16%), and closed out the week at 4,145.19, up 14.9 points week over week. The NASDAQ closed lower on Friday of last week, down -63.03 points (-0.51%), and closed the week at 12,657.56 points, up 266.87 points week over week.
In overnight trading, DOW futures traded higher and are expected to open at 32,880 this morning up 123 points.
Oil closed higher on Friday of last week, but down week over week
Oil posted the biggest weekly decline since early April last week on growing signs that a global economic slowdown is curbing demand. Prices are near the lowest level in six months. WTI ended the week nearly 10% lower. U.S. gasoline consumption has dropped. Supplies from Libya also picked up, helping to shrink oil futures time-spreads and ease the tightness in the market. Gasoline futures were down 18% last week. Meanwhile, physical oil differentials have narrowed and Brent’s prompt spread — the difference between its two nearest contracts and a gauge of supply — shrunk to $1.73/bbl in backwardation, down from more than $6 from a week ago. On Friday of last week, WTI for September delivery rose 47 cents to settle at $89.01/bbl. Brent for October settlement gained 80 cents to settle at $94.92/bbl.
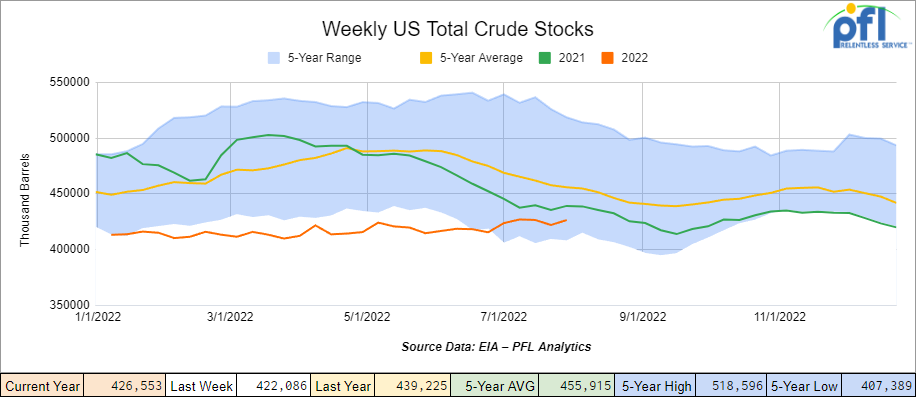
U.S. commercial crude oil inventories (excluding those in the Strategic Petroleum Reserve) increased by 4.5 million barrels week over week. At 426.6 million barrels, U.S. crude oil inventories are 7% below the five-year average for this time of year.
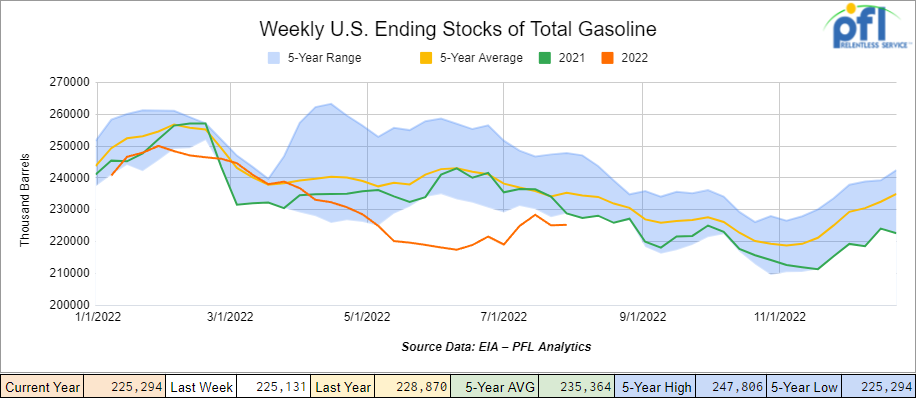
Total motor gasoline inventories increased by 200,000 barrels week over week and are 3% below the five-year average for this time of year.
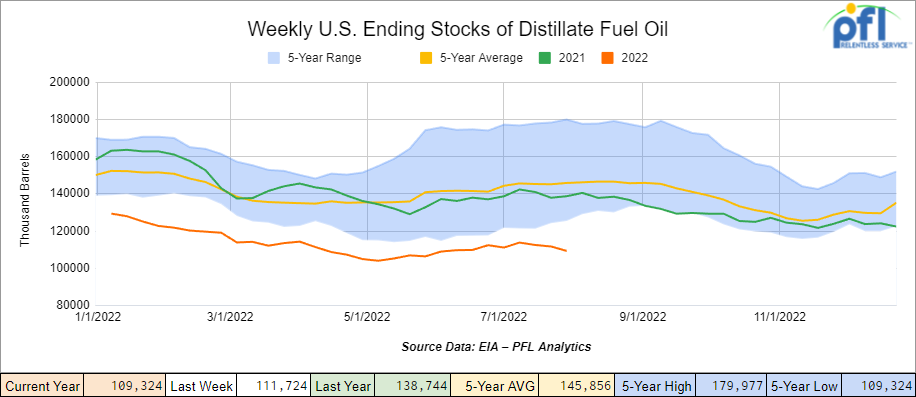
Distillate fuel inventories decreased by 2.4 million barrels week over week and are 25% below the five-year average for this time of year.
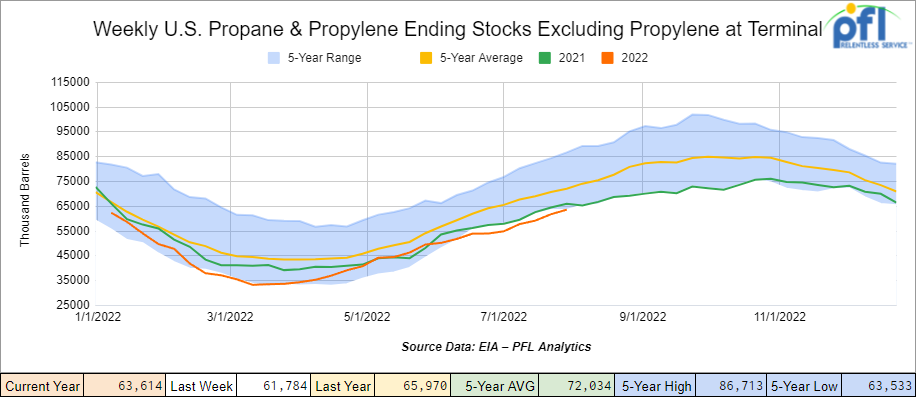
Propane/propylene inventories increased by 1.8 million barrels week over week and are 11% below the five-year average for this time of year and only 2.3 million gallons behind last year’s levels.
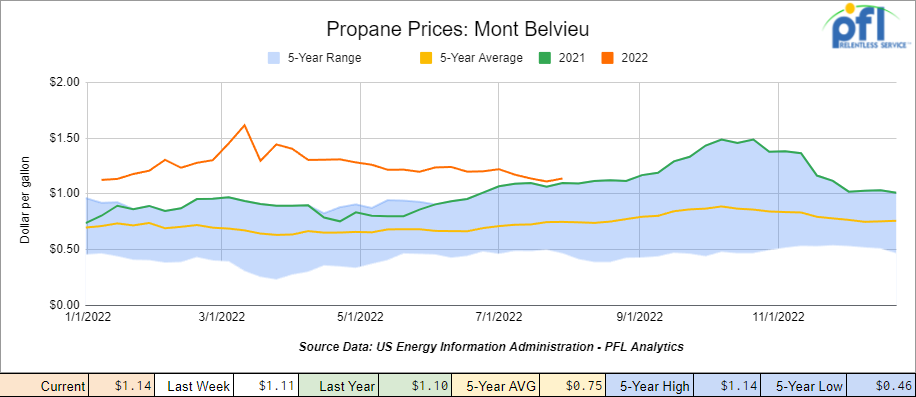
Propane prices closed higher 3 cents per gallon week over week at $1.14 per gallon, which was up 4 cents per gallon year over year.
Overall, total commercial petroleum inventories increased by 3.5 million barrels last week.
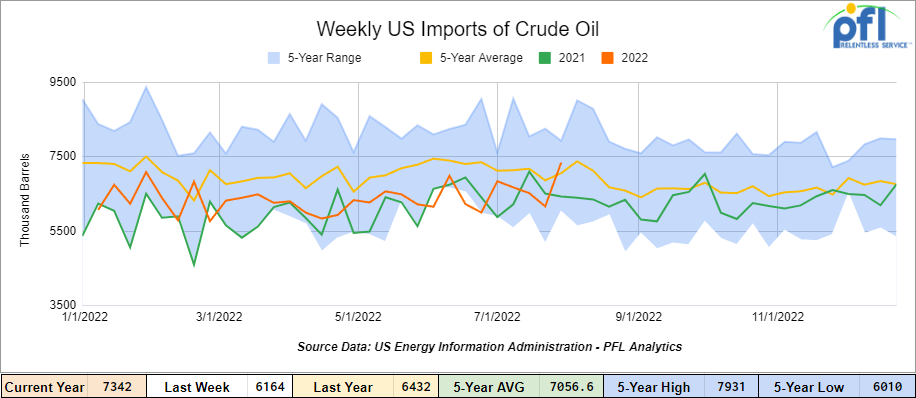
U.S. crude oil imports averaged 7.3 million barrels per day during the week ending July 29th, 2022, an increase of 1.2 million barrels per day from the previous week. Over the past four weeks, crude oil imports averaged 6.7 million barrels per day, 1.7% more than the same four-week period last year. Total motor gasoline imports (including both finished gasoline and gasoline blending components) averaged 609,000 barrels per day, and distillate fuel imports averaged 234,000 barrels per day for the week ending July 29, 2022.
U.S. crude oil refinery inputs averaged 15.9 million barrels per day during the week ending July 29, 2022 which was 174,000 barrels per day less than the previous week’s average.
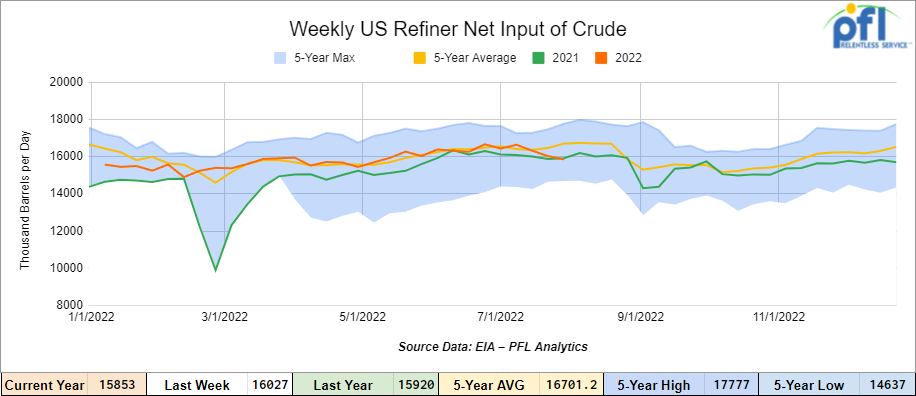
As of the writing of this report, WTI is poised to open at $88.42, down -$0.59 per barrel from Friday’s close.
North American Rail Traffic
Week Ending July 30th, 2022.
Total North American weekly rail volumes were down -3.1% in week 31 compared with the same week last year. Total carloads for the week ending July 30th were 333,060, down -0.9% compared with the same week in 2021, while Weekly intermodal volume was 358,418, down -5.2% compared to 2021. 7 of the AAR’s 11 major traffic categories posted year-over-year declines with the most significant decrease coming from Grain (-12.8%). The largest increase was from Coal (4.7%) and Nonmetallic Minerals (4.2%).
In the east, CSX’s total volumes were up 0.18%, with the largest decrease coming from Nonmetallic Minerals and Products (-5.89%) and the largest increase from Grain (+14.40%). Norfolk Southern’s total volumes were up 1.76%, with the largest decrease stemming from Intermodal (-14.84%) and the largest increase from Petroleum and Petroleum Products (+16.98%).
In the west, BN’s total volumes were up 1.24%, with the largest decrease stemming from Other (-19.17%), the largest increase from Metallic Ores and Metals (+14.19%) UP’s total rail volumes were up 5.57% with the largest decrease stemming from Intermodal (-8.7%) and the largest increase from Nonmetallic MInerals and Products (+17.83%) and Motor Vehicles and Parts (12.84%).
In Canada CN’s total rail volumes were up 6.78% with the largest decrease stemming from Grain (-27.79%) and the largest increase from Coal (+65.99%). CP’s total rail volumes were down -0.1% with the largest decrease stemming from Farm and Food Products (-28.18%) as well as Motor Vehicles and Parts (-22.19%) and the largest increase from Chemicals (+32.61%).
KCS’s total rail volumes were down -1.86% with the largest decrease from Petroleum and Petroleum Products (-48.30%) and the largest increase from Grain (+28.62%).
Source Data: AAR – PFL Analytics
Rig Count
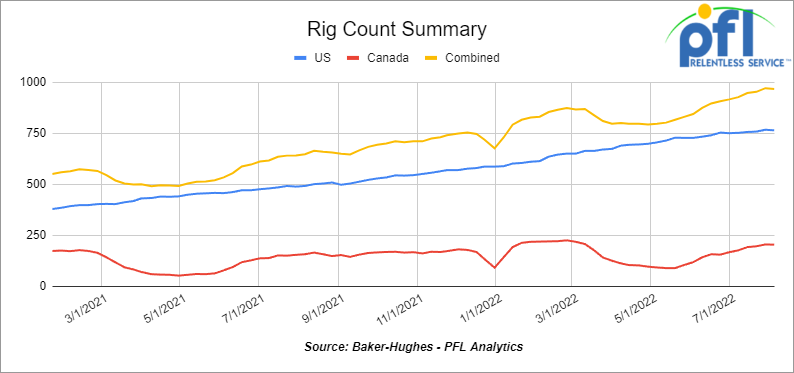
North American rig count was down by -4 rigs week over week. U.S. rig count was down -3 rigs week-over-week and up by 273 rigs year over year. The U.S. currently has 764 active rigs. Canada’s rig count was down by -1 rigs week-over-week, and up by 47 rigs year-over-year. Canada’s overall rig count is 203 active rigs. Overall, year over year, we are up 320 rigs collectively.
International rig count which is published monthly is up by 9 rigs month over month and up by 82 rigs year over year. Internationally there are 833 active rigs.
North American Rig Count Summary

A few things we are keeping an eye on:
We are eying Petroleum Carloads
The four-week rolling average of petroleum carloads carried on the six largest North American railroads fell to 24,521 from 24,722, which was a loss of 201 railcars week-over-week. This ended the fifth week of consecutive gains. Canadian volumes were lower. CP’s shipments were down by 6.7% and CN’s volumes were down by 2.9%. U.S. shipments were mostly lower. The CSX had the largest percentage decrease, down by 16.4% and CSX was the only gainer up by 2.6%.
We are eying Alberta Crude Inventories
Despite appropriation hitting the system from Enbridge, crude oil inventories fell in June as offsets of local refinery sales and exports offset the rise in production. According to the Alberta Energy Regulator, crude supplies ended at 63.8 million barrels at the end of June, down from 66.4 million barrels’ month over month. There are still a number of turnarounds going on or yet to start so we will have to see where we stand after the third quarter.
We are eying Natural Gas
Natural gas is an interesting one folks. As you know, the more natural gas we produce the more LPG’s we produce and therefore the more rail traffic increases. Natural gas is in high demand pretty much everywhere as the world transitions from coal electricity generation to natural gas fired electricity generation. Europe is struggling – in the latest Spain is advising people not to turn their air-conditioning below 80 degrees and will revert to 66 degrees for the heating season this winter to preserve natural gas usage. Here in the U.S. we are still behind on storage fills despite a 2 bdf/day LNG facility (Freeport LNG) being down in the gulf since June. However, on Wednesday of last week Freeport said it has entered into an agreement with the Pipeline and Hazardous Materials Safety Administration to resume operations in early October at almost full capacity taking another 2 bcf/day off the market that could have otherwise been used here in the U.S. to fill domestic storage.
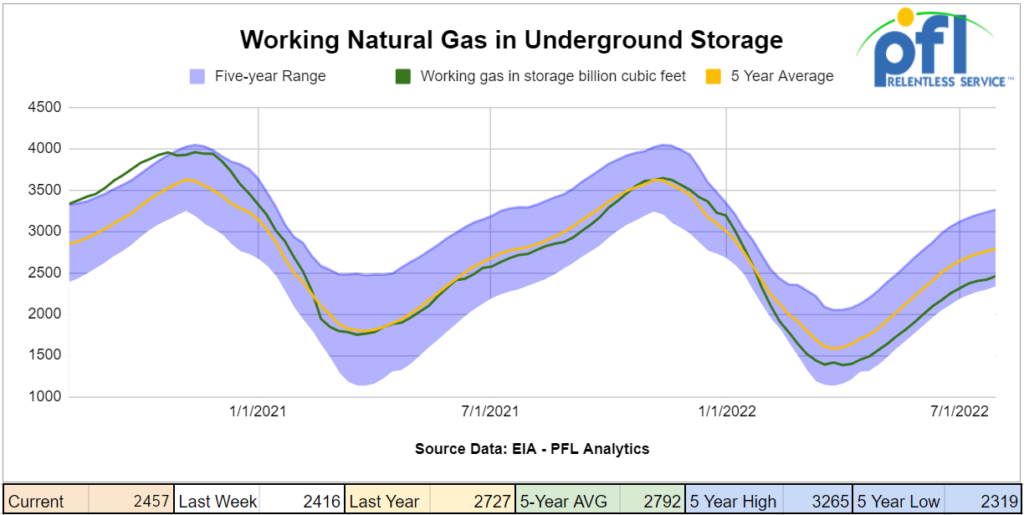
Now, Australia wants to keep their natural gas! Australia is facing a domestic gas shortage because of excessive exports, and the Australian Competition and Consumer Commission is warning that the government must impose limits on LNG exports to secure local supply.
According to the Australian Competition and Consumer Commission, if LNG producers are allowed to sell all their uncontracted LNG abroad, the east coast of Australia could suffer a shortfall of about a tenth of the forecast gas demand for 2023, the Australian Financial Review reported who want to limit exports that Asia so heavily relies on.
The report noted that demand for natural gas is surging in Australia because of a shift away from coal and not fast enough growth in renewable power generation.
Some Key Economic Indicators
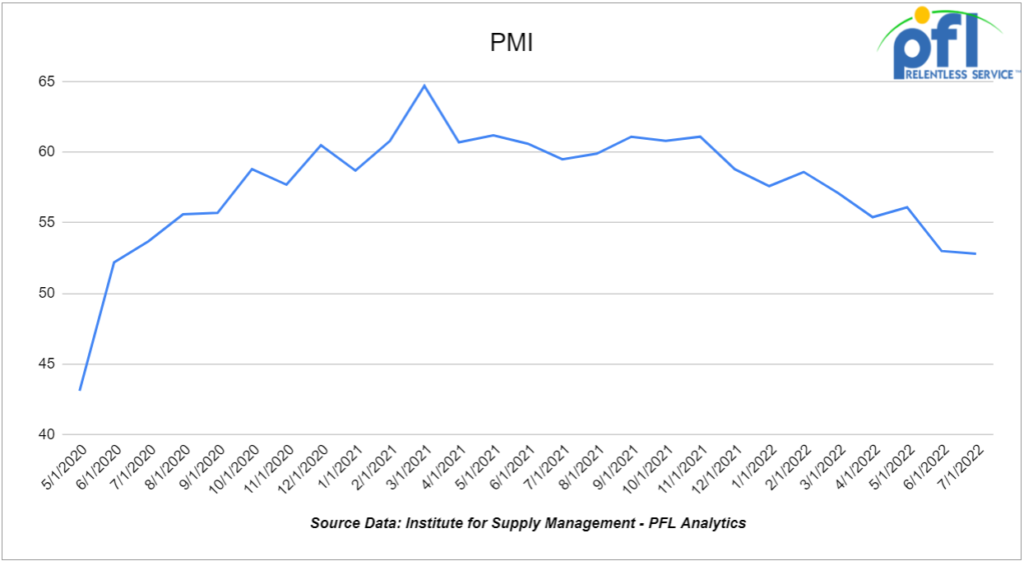
Purchasing Managers Index (“PMI”) – The PMI (which covers manufacturing) and the Services PMI (covering services) are both from the Institute for Supply Management. They are based on surveys of supply managers around the country. The surveys track the direction of changes in business activity. An index reading above 50% indicates expansion; below 50% means contraction. The more above or below 50, the faster the pace of change.
The PMI fell to 52.8% in July 2022 from 53.0% in June 2022. July marks the 26th consecutive month of expansion, however it is the lowest reading since June 2020. The new orders component of the PMI® fell even further below 50%, coming in at 48% in July compared to 49.2% in June.
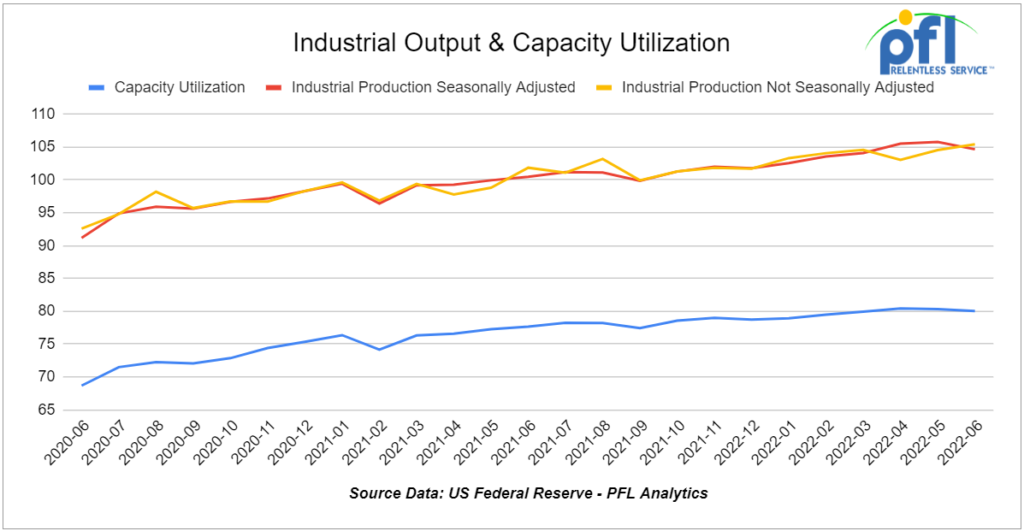
Industrial Output and Capacity Utilization – According to the Federal Reserve, preliminary seasonally adjusted total U.S. industrial output fell 0.2% in June 2022 from May 2022 — its first month over month decline in 2022 — after barely rising in May over April. In February, March, and April this year, month-to-month growth was 0.7% to 0.8%, which means the slowdown in May and June was substantial.
In June, manufacturing output (about 75% of total output), fell 0.5% from May, matching the drop in May from April. The three-month average change in manufacturing output in June was negative for the first time in 14 months. This slowdown in output is consistent with a slowdown in new orders at manufacturing firms, slowdowns in some other economic indicators, and reports of too-high inventories at some firms.
Overall capacity utilization was a preliminary 80.0% in June, down from 80.3% in May and 80.4% in April. April’s reading was the highest since March 2008. For manufacturing, capacity utilization in June was a preliminary 79.3%, the lowest it’s been in four months.
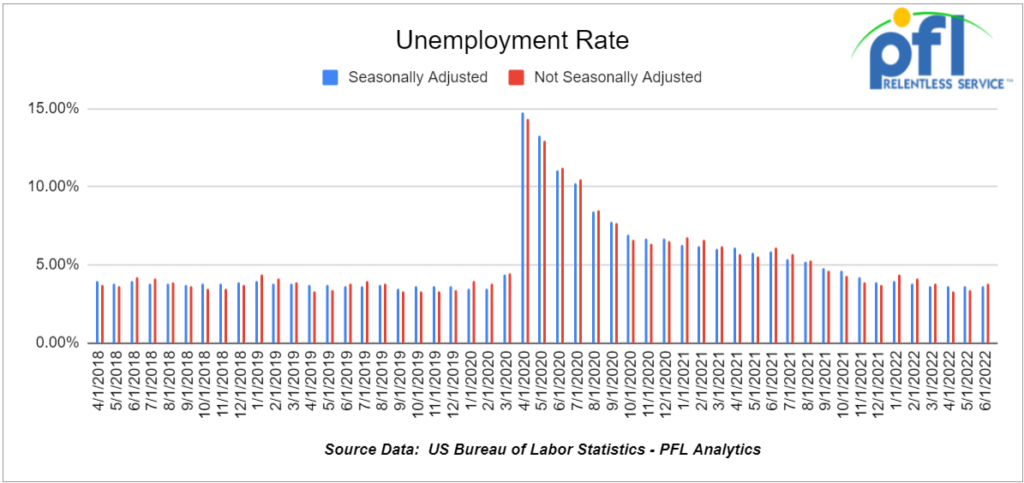
U.S. job growth unexpectedly accelerated in July, lifting the level of employment above its pre-pandemic level.
The Labor Department’s closely watched employment report on Friday of last week showed employers continuing to raise wages at a strong clip and generally maintaining longer hours for workers. The sustained labor market strength could give the Federal Reserve the latitude to keep aggressively hiking interest rates. Highlights:
- Nonfarm payrolls increase 528,000 in July
- Unemployment rate falls to 3.5% from 3.6% in June
- Average hourly earnings rise 0.5%; up 5.2% year-on-year
- Participation rate falls to 62.1% from 62.2% in June
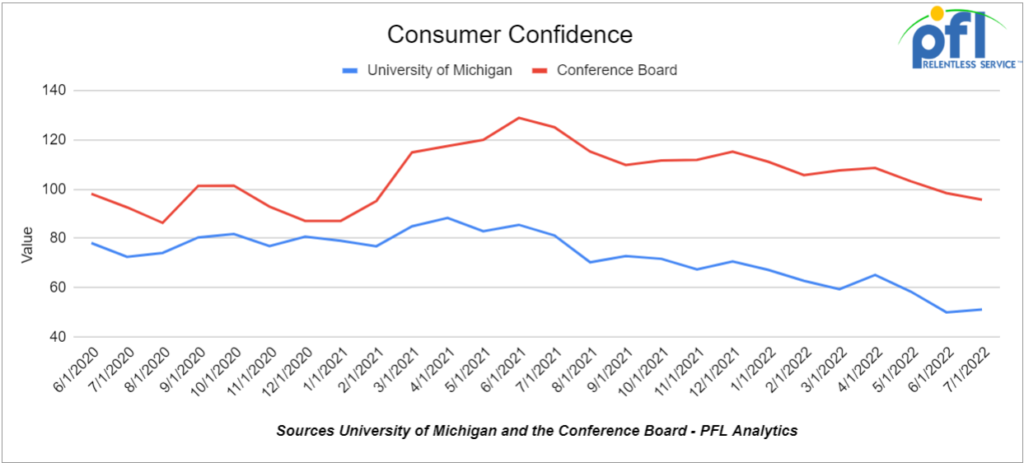
To no one’s surprise, consumer confidence fell in June. The Conference Board’s Consumer Confidence Index fell to 95.7 in July — down from 96.3 in June, down from a recent peak of 128.9 in June 2020, and the lowest it’s been since February 2021 – a far cry from the Trump years where consumer confidence reached nearly 140.
The overall Conference Board index is comprised of several components, including “Present Situation” and “Expectations.” While the Present Situation Index was relatively unchanged [in June], the Expectations Index [fell] to its lowest point in nearly a decade. Consumers’ grimmer outlook was driven by increasing concerns about inflation and expectations have now fallen well below a reading of 80, suggesting weaker growth in the second half of 2022.
Meanwhile, the University of Michigan’s index of consumer sentiment rose to 51.1 in July from 50 in June, the second lowest it’s been since it was created in 1952. Roughly 79% of consumers expect bad times in the year ahead for business conditions, the highest since 2009. Inflation continued to be of paramount concern to consumers. Consumers also expressed the highest level of uncertainty over long-run inflation since 1991, continuing a sharp increase that began in 2021.”
We have been extremely busy at PFL with return on lease programs involving rail car storage instead of returning cars to a shop. A quick turnaround is what we all want and need. Railcar storage in general has been extremely active. Please call PFL now at 239-390-2885 if you are looking for rail car storage, want to troubleshoot a return on lease scenario, or have storage availability. Whether you are a car owner, lessor or lessee, or even a class 1 that wants to help out a customer we are here to “help you help your customer!”
Leasing and Subleasing has been brisk as economic activity picks up. Inquiries have continued to be brisk and strong Call PFL Today for all your rail car needs 239-390-2885
PFL is seeking:
- 100, 340W Pressure cars for a 6-month term for propane. Can take in various locations, needed ASAP
- 100 Coiled and insulated cars for Crude. Needed in Canada for 6 months. Dirty to Dirty
- 50 117Js with magrods in the east – 10 for immediate trip lease – 40 for longer term
- 50 6350 covered hoppers in the midwest with most class ones for up to 5 years for DDG
- Up to 40 5500 Covered Gons 286 unlined CSX/NS preferred but will consider other
- 4 Lined tanks for glycerin to run from Arkansas to Georgia 1-3 years
- 30 boxcars on UP or CP for 3 years to run from TX to Edmonton – negotiable
- 6-10 Open top 4200 gons for hauling scrap NS in Ohio for 1-3 years
- 100, 2480 CU-FT Ag Gons needed in Texas off of the UP for 1-3 Years.
- 50, 117J 30K+ Tank cars are needed in several locations. Can take in various locations off various Class 1’s. Can have prior Ethanol heel or Gasoline heel
- Various Hoppers 286 GRL 4200-7000 CU FT in several locations negotiable
- 300 5800 Covered hoppers needed for plastic – 5-year lease – negotiable
- 50, 5800cuft or larger Covered Hopper for use in DDG needed in the Midwest for 3-4 years. Immediate need.
- 10-20 Covered hopper grain cars in the midwest 5200-5500 2-3 years
- 100 Moulton Sulfur cars for purchase – any location – negotiable
- 50 Ag Gons 2500-2800cuft 286k GRL in the east for 5 years negotiable
- 100 15K Tanks 286 for Molten Sulfur in the Northeast CSX/NS for 6 months negotiable
- 100, 5800 Covered Hoppers 286 can be West or East for Plastic 3-5 years
- 70, 117R or J needed for Ethanol for 3 years. Can take in the South.
- 50, 6500+ cu-ft Mill Gon or Open Top Hopper for wood chips in the Southeast for 5 Years.
- 20, 19,000 Gal Stainless cars in Louisiana UP for nitric acid 1-3 years – Oct negotiable
- 10, 6,300CF or greater covered hoppers are needed in the Midwest.
PFL is offering:
- 25, 31.8K CPC 1232 last in Crude in New Mexico. Dirty to Dirty.
- 200 Clean C/I 25.5K 117J in Texas. Brand New Cars!
- 150 DOT 111s last in ethanol in the Midwest with free move. Available in September.
- Up to 500 sand cars for sale or lease at various locations and class ones – Great Price!
- 150 117R’s 31.8 clean for lease in Texas KCS – negotiable
- 31.8K Tank Cars last in Diesel. Dirty to dirty in Texas
- 200 117Js 29K in the Midwest. Lined and brand new- lease negotiable
- 100 117Rs dirty last in Gasoline in Texas for lease Negotiable
- 100 117Rs 29K clean last used in crude Washington State – price negotiable sale or lease.
- Various Hoppers for lease 3000-6250 CF 263 and 268 multiple locations negotiable
- 61, 117Js in the Midwest. Last in Bakken. Dirty to Dirty service.
- 340W pressure cars located in various locations.
- 200 117Js 29K OK and TX Clean and brand new – Lined- lease negotiable
- Various tank cars for lease with dirty to dirty service including, nitric acid, gasoline, diesel, crude oil, Lease terms negotiable, clean service also available in various tanks and locations including Rs 111s, and Js.
Call PFL today to discuss your needs and our availability and market reach. Whether you are looking to lease cars, lease out cars, buy cars or sell cars call PFL today at 239-390-2885
PFL offers turn-key solutions to maximize your profitability. Our goal is to provide a win/win scenario for all and we can handle virtually all of your railcar needs. Whether it’s loaded storage, empty storage, subleasing or leasing excess cars, filling orders for cars wanted, mobile railcar cleaning, blasting, mobile railcar repair, or scrapping at strategic partner sites, PFL will do its best to assist you. PFL also assists fleets and lessors with leases and sales and offers Total Fleet Evaluation Services. We will analyze your current leases, storage, and company objectives to draw up a plan of action. We will save Lessor and Lessee the headache and aggravation of navigating through this rapidly changing landscape.
PFL IS READY TO CLEAN CARS TODAY ON A MOBILE BASIS WE ARE CURRENTLY IN EAST TEXAS
Live Railcar Markets
| CAT | Type | Capacity | GRL | QTY | LOC | Class | Prev. Use | Clean | Offer | Note |
|---|
