
“This is the precept by which I have lived: Prepare for the worst; expect the best; and take what comes.”
Hannah Arendt
Jobs Update
• Initial jobless claims seasonally adjusted for the week ending July 26, 2025, came in at 218,000, up 1,000 people week over week.
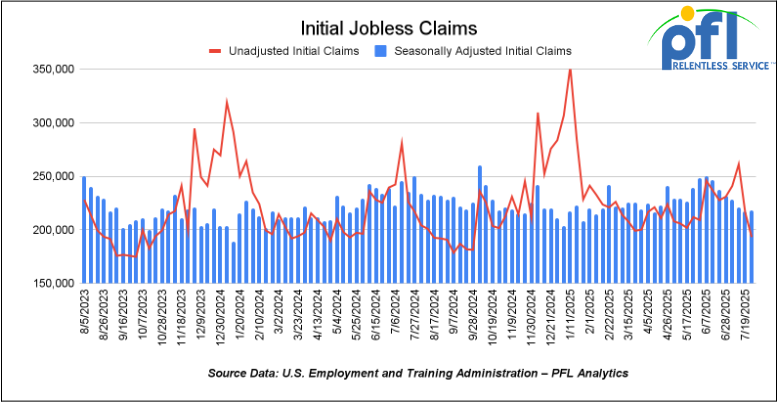
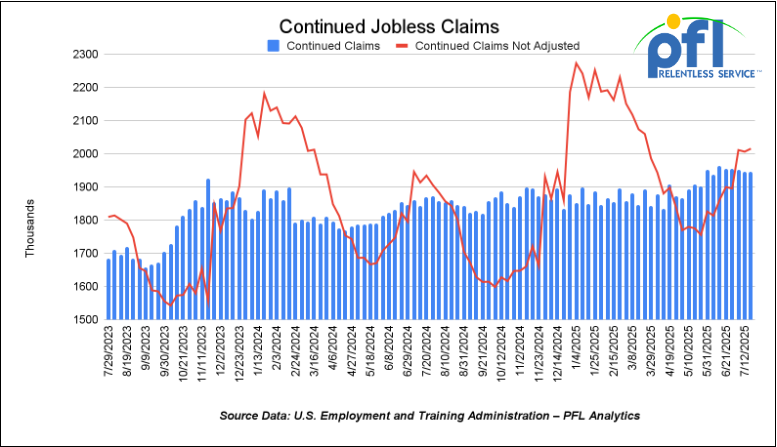
• Continuing jobless claims came in at 1,946,000, versus the adjusted number of 1,946,000 people from the week prior, flat week over week.
Stocks closed lower on Friday of last week and lower week-over-week
The DOW closed lower on Friday of last week, down -542.40 points (-1.23%), closing out the week at 43,588.58, down -1,313.34 points week-over-week. The S&P 500 closed lower on Friday of last week, down -101.38 points (-1.60%), and closed out the week at 6,238.01, down -150.63 points week-over-week. The NASDAQ closed lower on Friday of last week, down -472.32 points (-2.24%), and closed out the week at 20,650.13, down -458.19 points week-over-week.
In overnight trading, DOW futures traded higher and are expected to open at 44,001 this morning, up 291 points from Friday’s close.
Crude oil closed lower on Friday of last week, but higher week-over-week
West Texas Intermediate (WTI) crude closed down -1.93 per barrel (-2.79%), to close at $67.33 on Friday of last week, and up $2.17 week-over-week. Brent crude closed down -2.03 per barrel (2.83%), to close at $69.67, and up $1.23 week-over-week.
One Exchange WCS (Western Canadian Select) for September delivery settled on Friday of last week at US$11.70 below the WTI-CMA (West Texas Intermediate – Calendar Month Average). The implied value was US$55.63 per barrel.
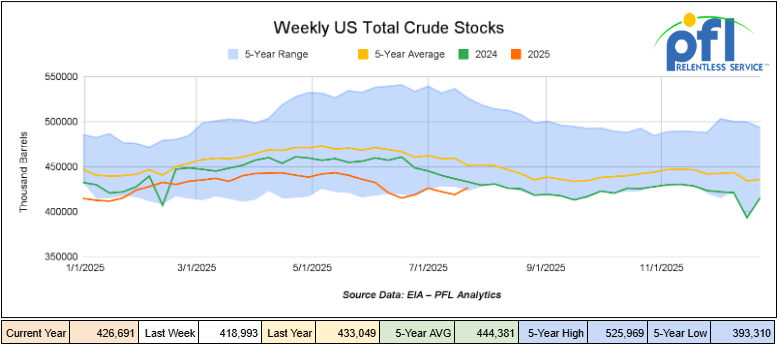
U.S. commercial crude oil inventories (excluding those in the Strategic Petroleum Reserve) increased 7.7 million barrels week-over-week. At 426.7 million barrels, U.S. crude oil inventories are 6% below the five-year average for this time of year.
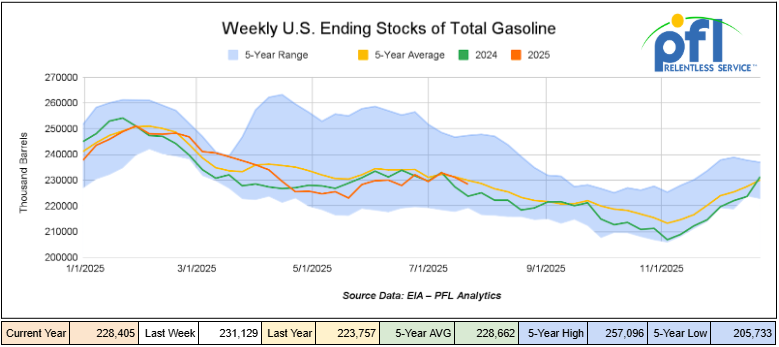
Total motor gasoline inventories decreased by 2.7 million barrels week-over-week and are 1% below the five year average for this time of year.
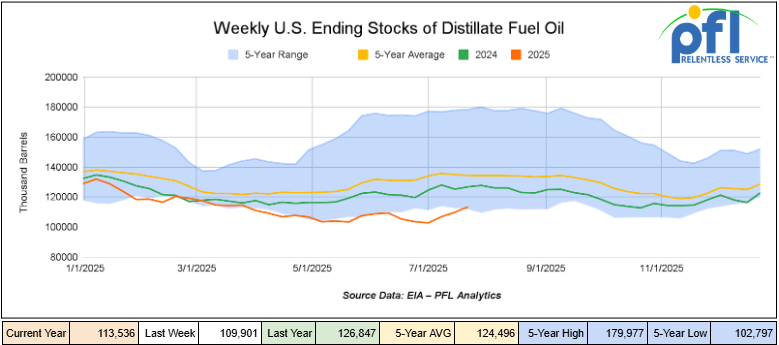
Distillate fuel inventories increased by 3.6 million barrels week-over-week and are 16% below the five year average for this time of year.
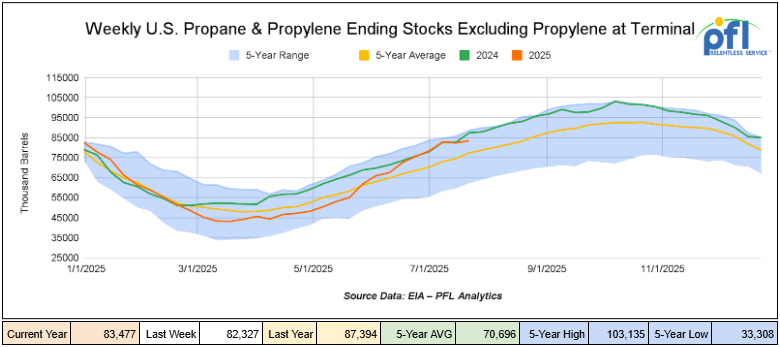
Propane/propylene inventories increased by 1.1 million barrels from week-over-week and are 9% above the five year average for this time of year.
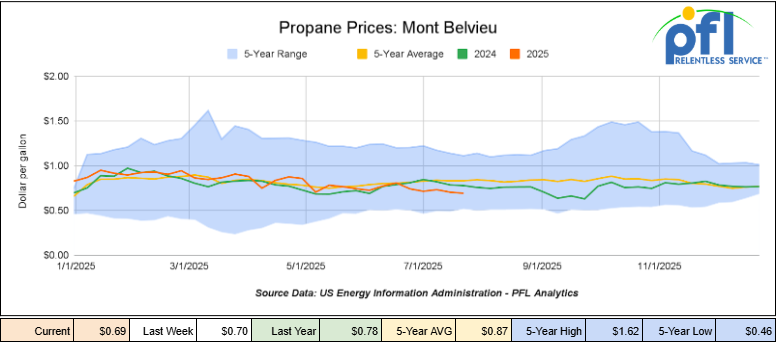
Propane prices closed at 69 cents per gallon on Friday of last week, down 1 cent per gallon week-over-week, and down 9 cents year-over-year.
Overall, total commercial petroleum inventories increased by 7.1 million barrels during the week ending July 25, 2025.
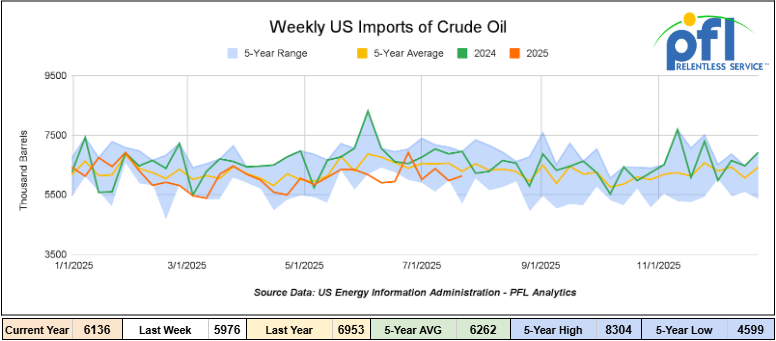
U.S. crude oil imports averaged 6.1 million barrels per day during the week ending July 25, 2025, an increase of 159,000 barrels per day week-over-week. Over the past four weeks, crude oil imports averaged 6.1 million barrels per day, 11.3% less than the same four-week period last year. Total motor gasoline imports (including both finished gasoline and gasoline blending components) averaged 691,000 barrels per day, and distillate fuel imports averaged 229,000 barrels per day during the week ending July 25, 2025.
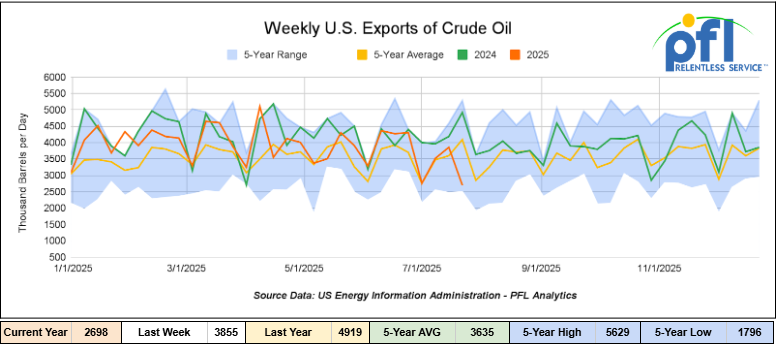
U.S. crude oil exports averaged 2.698 million barrels per day during the week ending July 25, 2025, a decrease of -1.157 million barrels per day week-over-week. Over the past four weeks, crude oil exports averaged 3,207 million barrels per day.
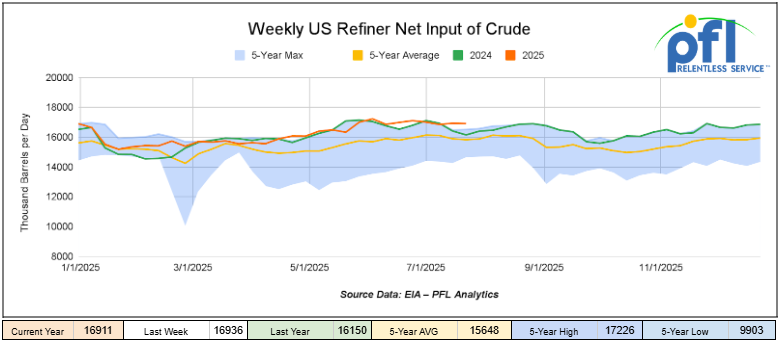
U.S. crude oil refinery inputs averaged 16.9 million barrels per day during the week ending July 25, 2025, which was 25,000 barrels per day less week-over-week.
WTI is poised to open at $66.45, down 88 cents per barrel from Friday’s close.
North American Rail Traffic
Week Ending July 30 2025:
Total North American weekly rail volumes were down (0.58%) in week 31, compared with the same week last year. Total carloads for the week ending on July 30 were 323,990 down (0.85%) compared with the same week in 2024, while weekly intermodal volume was 344,083, down (0.34%) compared to the same week in 2024.
7 of the AAR’s 11 major traffic categories posted year-over-year decreases. The largest decrease came from Forest Products, which was down (-15.12%), while the largest increase was from Motor Vehicles and Parts, which was up (+6.47%).
In the East, CSX’s total volumes were down (-2.37%), with the largest decrease coming from Petroleum and Petroleum Products (-10.59%), while the largest increase came from Grain (+22.99%). NS’s volumes were down (-1.98%), with the largest increase coming from Petroleum and Petroleum Products (25.19%), while the largest decrease came from Nonmetallic Minerals (-9.57%).
In the West, BN’s total volumes were up (4.05%), with the largest increase coming from Motor Vehicles and Parts (+22.45%), while the largest decrease came from Forest Products (-7.13%). UP’s total rail volumes were up (+1.13%), with the largest increase coming from Coal (+17.77%), while the largest decrease came from Farm Products (-13.73%).
In Canada, CN’s total rail volumes were up (3.13%) with the largest increase coming from Intermodal (+27.54%) while the largest decrease came from Other (-19.81%). CPKCS’s rail volumes were down (-21.89%), with the largest increase coming from Motor Vehicles and Parts (+28.52%), while the largest decrease came from Forest Products (-69.65%).
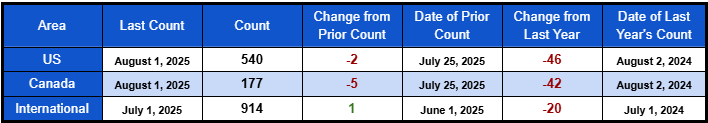
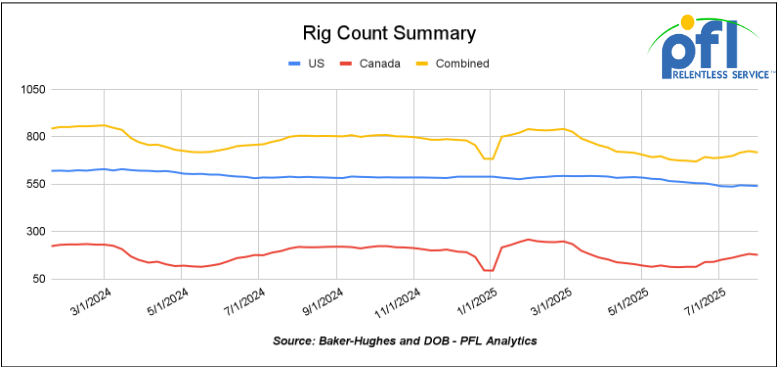
Rig Count
North American rig count was down by -7 rigs week-over-week. The US rig count was down by -2 rigs week-over-week, and down by -46 rigs year-over-year. The US currently has 540 active rigs. Canada’s rig count was down -5 rigs week-over-week, and down by -42 rigs year-over-year. Canada currently has 177 active rigs. Overall, year-over-year, we are down by -88 rigs collectively.
International rig count, which is reported monthly, was up by 1 rig month-over-month, but down by -20 rigs year-over-year. Internationally, there are 914 active rigs.
North American Rig Count Summary
We are watching a few things out there for you:
We are Watching Petroleum Carloads
The four-week rolling average of petroleum carloads carried on the six largest North American railroads fell to 27,782 from 27,854 which was a decrease of -72 rail cars week-over-week. Canadian volumes fell. CPCK’s shipments were lower by -5.0% week over week, CN’s volumes were down by -0.4% week-over-week. U.S. shipments were mostly lower. The CSX had the largest percentage decrease and was down by -11.0%. The UP was the sole gainer and was up by 6%.
We Continue to Watch All Talk, No Action, Socialist Carney
Enbridge Inc. is keeping its options open to build new oil and gas export pipelines to Canada’s West Coast, but it still hasn’t seen much progress from governments on moving new projects forward, said president and chief executive officer Greg Ebel at its second quarter earnings call.
Enbridge spent hundreds of millions of dollars planning the Northern Gateway oil pipeline before it was rejected by the federal government in 2016, Ebel said.
Northern Gateway would have sent 525,000 bbls/d of diluted bitumen from Alberta to Kitimat, with a second pipeline returning 193,0000 bbls/d of diluent back to oilsands operators for reuse. A marine terminal with two berths for tankers and 19 storage tanks was also planned.
Ebel said the company would consider revisiting Northern Gateway or building a similar oil export pipeline to the West Coast in the future.
But right now, it is focused on expanding its Mainline system in the U.S., with a final investment decision of the first phase of the project expected to add 150,000 bbls/d of incremental capacity set for later this year.
“Our customers at this point in time really want to go south. That’s the premium market, which we’re able to deliver to both PADD 2 and PADD 3, the Gulf Coast,” he said.
“That’s the first move. It’s the most valuable market. It’s the smartest way to do this. And then when that’s done and as our customer production grows, that’s when an opportunity could be created to go to the West Coast. And there’s lots of discussion with governments on that.”
Ebel disputed B.C. Premier David Eby’s claims there is no proponent for a West Coast pipeline, so there is little his government can do to move a project forward.
“We have been a proponent of such a project in the past,” he added. “The issue isn’t one there being a proponent.
“The issue is one of government policy setting the conditions for that investment to occur. Let’s be honest. The government has not done that yet, and it’s not clear they intend to, at least from our perspective.”
Ebel pointed to the emissions cap, which stifles oilsands operators ability to grow production, as one issue.
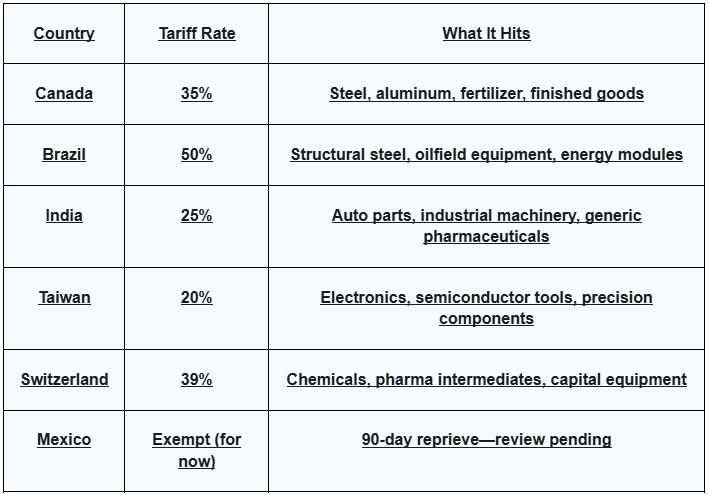
We are Watching Tariffs – Rail Shippers Brace for Impact
On Thursday of last week, a sweeping executive order imposed new import tariffs on over 65 countries. Tariff rates range from 10% to 50%, with Canada hit hardest at 35% on non-USMCA goods. This follows the June decision to double tariffs on Canadian steel and aluminum to 50%—a direct hit to two of the most rail-dependent sectors. For rail shippers, the impact is swift. From Hamilton to Houston, cross-border supply chains are under pressure. Shippers are seeing slower customs clearance, shifting volumes, and greater exposure across key industrial sectors.
Who’s Affected:
- U.S. Shippers:
- Metals: Importers face price spikes and customs friction.
- Machinery & Auto Parts: Delays expected at key assembly hubs.
- Ag Exports: Pork, dairy, and sugar products could face retaliation.
- Canadian Shippers:
- Steel and aluminum shipments—about 6% of Canada’s total export value—are down an estimated 15%.
- Fertilizer, plastics, and chemicals are being re-routed or deferred.
- Industrial regions like Hamilton and Windsor are seeing reduced rail carloadings and layoffs.
Key Rail Corridors to Watch:
- Toronto ↔ Chicago – Mixed industrial freight, intermodal, parts
- Hamilton ↔ Detroit/Windsor – Steel and automotive materials
- Alberta ↔ Texas/Gulf Coast – Fertilizer, propane, plastics
Broader Market Impacts:
- Trucking and Intermodal Volatility: Cross-border trucking demand is softening. Intermodal lanes tied to U.S.–Mexico and U.S.–Canada are seeing delays, rebalancing, and spot rate pressure.
- Port Activity Spikes, Then Slows: Ports like Savannah saw heavy pre-tariff volume surges—now followed by a drop in inbound containers. That means fewer loads feeding inland rail networks.
- Railcar Demand Slowing: Analysts are reporting weakened car utilization and fewer new car orders in non-metal lanes—plastics, ag, and chemicals are all seeing softer demand.
- Rail Stocks Hit: Carriers like CPKC and CN took hits after the announcement. Investors are flagging heavy exposure to cross-border trade as a near-term risk.
We are Watching Canadian Class 1’s Earnings and Performance
The second-quarter 2025 earnings season has revealed a sharp divergence between the Canadian Class I railroads, driven by their different exposures to the new trade landscape.
- CN took the biggest hit, lowering its full-year 2025 adjusted EPS growth guidance from a robust 10-15% range down to a mid-to-high single-digit range, explicitly citing “persistent trade and tariff volatility”. In a powerful signal of extreme uncertainty, management also completely withdrew its multi-year 2024-2026 financial outlook. The market reacted severely, with all ten major analyst firms cutting their price targets and CN’s stock is testing multi-year lows.
- CPKC fared better, narrowly missing analyst forecasts, but still posting 3% revenue growth and improving its operating ratio. The results show the value of their new three-nation network: the Intermodal segment was a standout performer, with revenue ton-miles surging 18%, driven by its U.S.-Mexico service. This strength offset declines in the Merchandise segment, which was directly impacted by the steel tariffs.
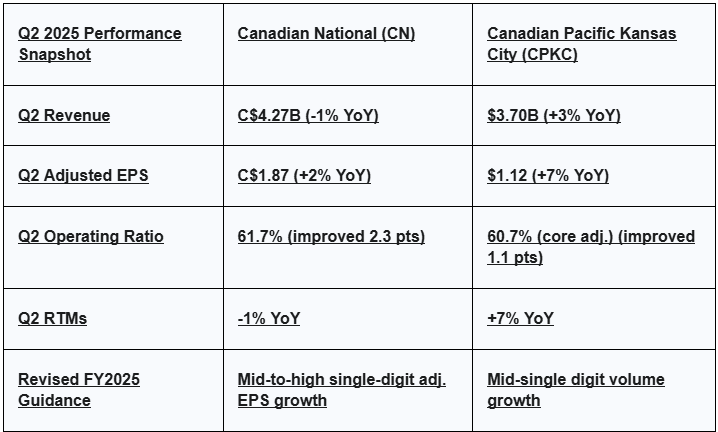
Source: CN, CPKC
We are Watching Class 1 Merger Developments
The proposed $85 billion acquisition of Norfolk Southern by Union Pacific aims to create the first coast-to-coast freight rail network in U.S. history. If approved, the combined system would manage over 50,000 miles of track across 43 states, eliminating key interchange points and fundamentally altering how rail freight moves across the country. While some see a path to greater efficiency, shippers, trade groups, and policymakers have raised significant concerns.
Shipper Concerns:
Shippers across the fuel, chemical, agriculture, and manufacturing sectors are actively organizing against the merger. Their primary concerns include:
- Loss of routing options at crucial interchange points like Chicago, Memphis, and St. Louis.
- Increased captive rates in areas where UP and NS already have dominant control.
- A potential decline in service performance and a lack of recourse for delays.
- Reduced flexibility and cost control in long-term contracts.
Other Stakeholders:
- CSX has hired Goldman Sachs to explore strategic options.
- BNSF is rumored to be planning a countermove if the merger proceeds.
- Analysts predict the market may consolidate into two major networks: UP–NS and BNSF–CSX.
- CPKC advises caution, citing its own merger-related service challenges as a warning against rapid network complexity.
While the merger could potentially eliminate delays at congested interchanges and reduce coast-to-coast transit times, these benefits depend on maintaining service quality and ensuring shippers retain enough leverage to hold the carrier accountable. The current STB review is therefore crucial, as the decisions made over the next 12 months will significantly impact North American rail for the coming decade.
The intense focus on long-haul efficiency and risk management at the Class 1 level is creating a mixed and challenging environment for the smaller shortline and regional railroads. As the essential “first and last mile” connectors, these smaller operators are highly dependent on their Class 1 partners and are feeling the downstream effects of their strategic shifts. For some, the Class 1s’ efforts to de-risk and streamline their networks has created new opportunities; these shortlines are seeing a surge in demand for ancillary services like railcar storage, cleaning, and custom switching as shippers and car owners look for flexible, local solutions. However, for others, the situation is more precarious. A decision by a Class 1 to de-emphasize a particular corridor or commodity can cause volumes to dry up for the feeder lines that depend on that traffic, putting them at significant risk.
We are watching Key Economic Indicators
Interest Rates
Both the Bank of Canada and the U.S. Federal Reserve held their key interest rates steady last week, signaling a cautious approach in a highly uncertain economic environment. On July 30, the Bank of Canada maintained its policy rate at 2.75% for the third consecutive time, while the U.S. Fed also held its rate at a range of 4.25% to 4.5%. Both central banks cited the unpredictable nature of U.S. trade policy and tariff impacts as key factors in their decisions. For the rail and logistics sector, this period of stable but elevated interest rates has a direct impact on capital-intensive decisions. Higher borrowing costs can deter companies from investing in new equipment like locomotives and railcars or upgrading existing fleets. This environment tends to make leasing a more attractive option over purchasing, as it shifts capital expenditures to more flexible operating expenses.
U.S. Unemployment Rate
According to the Bureau of Labor Statistics, the seasonally adjusted unemployment rate increased to 4.2% in July 2025, compared to 4.1% in June, while the number of unemployed reached approximately 7.2 million. Total nonfarm payroll employment rose by just 73,000 jobs in July, well below expectations and marking one of the weakest monthly gains in over two years. The slowdown reflects downward revisions of previous months: May’s job gains were revised down to 19,000 and June to about 14,000—together trimming 258,000 fewer jobs than originally reported.
While employment continued to grow in health care and social assistance, federal government roles declined, and gains elsewhere were limited. Labor force participation edged down to about 62.2%, and average hourly earnings rose 3.9% over the year (up 0.3% month over month), trending at $36.44 per hour. Chair Powell emphasized that the unemployment rate remains the primary indicator for the Federal Reserve, as the job market continues to cool—especially as reduced labor supply (due in part to immigration restrictions) and weakening demand could weigh more heavily on employment going forward

Consumer Spending
Without adjusting for inflation, total U.S. consumer spending grew 0.3% in June 2025 following flat growth in May. After accounting for inflation, real spending likely increased around 0.1–0.2%, modestly ahead of price gains.
The personal saving rate remained at 4.5% for May and June—down from the 5.0% level reached in April. These savings levels are significantly below the pre‑pandemic average of around 6–7%, suggesting consumers have drawn down reserve buffers.
Rising interest rates, persistent inflation, and the resumption of student loan payments continue to weigh on household budgets. With the savings cushion eroding and wage growth slowing, we anticipate a gradual slowdown in consumer spending over the coming months.

Gross Domestic Product (“GDP”)
Real GDP in the United States grew at an annualized rate of 3.0% in Q2 2025 (covering April through June), rebounding from a 0.5% decline in Q1 2025. The upswing primarily reflected a sharp decline in imports—which subtract from GDP—and a moderate rise in consumer spending. These improvements were partly offset by declines in investment and exports.
Consumer spending added approximately 0.98 percentage points to GDP growth, compared with 0.31 points in Q1. Services were the chief driver within consumption, notably in healthcare, food services, and financial services, while goods—especially durable goods such as motor vehicles and parts—also made a positive contribution.
Real final sales to private domestic purchasers (combining household spending and fixed investment) rose 1.2%, down from 1.9% in Q1, signaling more moderate underlying private demand growth.
On the price front, the price index for gross domestic purchases increased 1.9%, down from 3.4% in Q1. The PCE price index rose 2.1%, compared to 3.7% previously, and core PCE (excluding food and energy) rose 2.5%, down from 3.5% in Q1.

Consumer Confidence
The Conference Board’s Index of Consumer Confidence increased to 97.2 in July 2025, up from 95.2 in June.
The University of Michigan’s Index of Consumer Sentiment rose to 61.8 in July, up from 60.7 in June.

Producer Price Index
In June 2025, U.S. producer prices were unchanged month over month, following a 0.1% increase in May. Core PPI—which excludes food, energy, and trade services—also held steady after a 0.1% rise in the prior month. Prices for goods increased by 0.3%, driven by a 0.2% rise in food and a 0.6% increase in energy. Goods excluding food and energy rose 0.3%. In contrast, services prices declined by 0.1%, reflecting flat trade margins and a 0.9% drop in transportation and warehousing. Prices for services excluding trade, transportation, and warehousing were down 0.1%.
The Consumer Price Index (CPI) rose 0.1% month over month in May, easing from a 0.2% gain in April. Over the last 12 months, the all-items index increased 2.4%, up slightly from 2.3% in April. Core CPI, which excludes food and energy, also rose 0.1% for the month, down from 0.2% in April, bringing the annual core inflation rate to 2.8%.

Lease Bids
- 30-50, 6000cf Steel Hopper located off of CSX or NS in East. For use in petcoke service. Period: 5 Years.
- 50, 5000CF Covered Hopper located off of UP or BN in Houston. For use in Fertilizer service. Period: 6 Months. Bid: Negotiable.Needed ASAP.
- 10, 2500CF Open Top Hopper located off of UP or BN in Texas. For use in aggregate service. Period: 5 years. Bid: Negotiable.Need Rapid Discharge Doors.
- 20, 25.5k CPC 1232 Tank located off of UP, BN, CSX, NS in OK, TX, Northeast. For use in Asphalt service. Period: 3 Years. Bid: Negotiable.
- 10, 25.5K Any Type Tank located off of CSX in Florida. For use in UCO service. Period: 2 Years. Bid: Negotiable.
- 20, 28.3K 117J Tank located off of BN in Montana. For use in Crude service. Period: 2 years. Bid: Negotiable.
- 15-20, 29K 117R Tank located off of NS or CSX in Ohio. For use in Ply Oil service. Period: 6-12 Months. Bid: Negotiable.
- 10, 30K 117R or 117J Tank located off of Any Class 1 in USA. For use in Glycerin service. Period: 1 year. Bid: Negotiable.
- 50, 23.5-25.5 DOT111 Tank located off of Any Class 1 in USA. For use in Asphalt service. Period: 5 years. Bid: Negotiable.
- 50-100, 33K 117J Tank located off of BN or UP in Bellview. For use in Butane/ service. Period: Sept-March. Bid: Negotiable.
- 4, 30K 117J Tank located in Michigan. For use in Food Grade Ethanol service. Period: Multi year. Bid: Negotiable.
- 10-20, 29K CPC 1232 Tank located off of CP in Washington, Iowa. For use in Biodiesel service. Period: 1 Year min. Bid: Negotiable.
- 50, 33K 117J Tank located off of CP or CN in Canada. For use in Propane service. Period: Summer. Bid: Negotiable.
- 6, 4750 Covered Hopper located off of NS in Georgia. For use in Fertilizer service. Period: 3-5 years. Bid: Negotiable.
- 100, 21.9K 117J Tank located off of All Class 1s in Midwest. For use in CO2 service. Period: 6 months. Bid: Negotiable.
Sales Bids
• 28, 3400CF located off of UP BN in Texas. For use in Cement service. Bid: Negotiable. Cement Gates needed.
• 20, 17K DOT111 located off of various class 1s in various locations. For use in corn syrup service.
Lease Offers
- 60, 4750 Covered Hoppers located off of UP or BN in Eads, CO. Last used in Grain. Offer: Negotiable. UP to 5 Years, 3 Hopper, Gravity Gate, Trough Hatches.
- 100, 6250 Covered Hoppers located off of UP. Last used in DDG. Offer: Negotiable. 1 Year term. Dirty to Dirty. Free move on UP..
- 24, 25.5K-30K DOT111 Tanks located off of UP or BN in Texas. Last used in Base Oils. Offer: Negotiable. 1-2 Year.
- 25, 19.6K DOT111 Tanks located off of UP in US. Last used in Molases. Offer: Negotiable.
- 50, 20K DOT111 Tanks located off of UP or BN in Wichita Falls, TX. Last used in HCL. Offer: Negotiable.
- 50, 30K 117R Tanks located off of CSX, NS, or CN in Detroit. Last used in Diesel. Offer: Negotiable. Multiyear.
- 50, 20K 117J Tanks located off of All Class 1s in N/A. Last used in Styrene. Offer: Negotiable. Cars are currently moving.
Sales Offers
- 21, 50′ Boxcar Plate Cs located off of various class 1s in NM. Offer: Negotiable. End of Life.
- 3, 50′ Boxcar Plate Cs located off of various class 1s in multiple locations. Offer: Negotiable. End of Life.
- 27, 50′ Boxcar Plate Cs located off of various class 1s in PQ. Offer: Negotiable. End of Life.
- 100, 3250 Covered Hoppers located off of various class 1s in multiple locations. Offer: Negotiable. Sand Cars.
- 5, 2740 Mill Gondolas located off of various class 1s in NC. Offer: Negotiable. End of Life.
- 1, 2260 Mill Gondolas located off of various class 1s in AL. Offer: Negotiable. End of Life.
- 30, 2740 Mill Gondolas located off of various class 1s in multiple locations. Offer: Negotiable. End of Life.
- 21, 2740 Mill Gondolas located off of various class 1s in WA. Offer: Negotiable. End of Life.
- 9, 4750 Covered Hoppers located off of various class 1s in multiple locations. Offer: Negotiable. End of Life.
- 5, 4750 Covered Hoppers located off of various class 1s in multiple locations. Offer: Negotiable. End of Life.
- 50, 31.8K Tank CPC 1232s located off of UP or BN in TX. Offer: Negotiable. Requal Due in 2025.
Call PFL today to discuss your needs and our availability and market reach. Whether you are looking to lease cars, lease out cars, buy cars, or sell cars call PFL today at 239-390-2885
Live Railcar Markets
| CAT | Type | Capacity | GRL | QTY | LOC | Class | Prev. Use | Offer | Note |
|---|
PFL will be at the Following Conferences

- Where: La Quinta, CA
- Attending: David Cohen (954-729-4774)
- Conference Website

- Where: Hyatt Regency Dallas in Dallas, TX
- Attending:Curtis Chandler (239.405.3365), David Cohen (954-729-4774), Brian Baker (239.297.4519), Cyndi Popov(403) 402-5043
- Conference Website