
“We make a living by what we get, but we make a life by what we give.” – Winston Churchill
Jobs Update
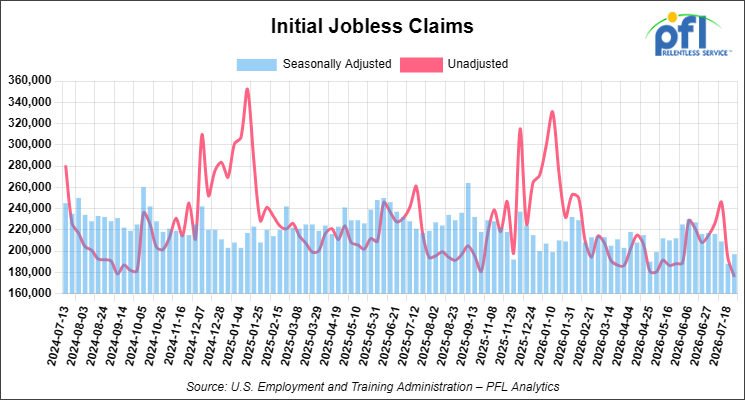
Initial jobless claims seasonally adjusted for the week ending July 25, 2026 came in at 197,000, versus the adjusted number of 188,000 people from the week prior, up 9,000 people week-over-week.
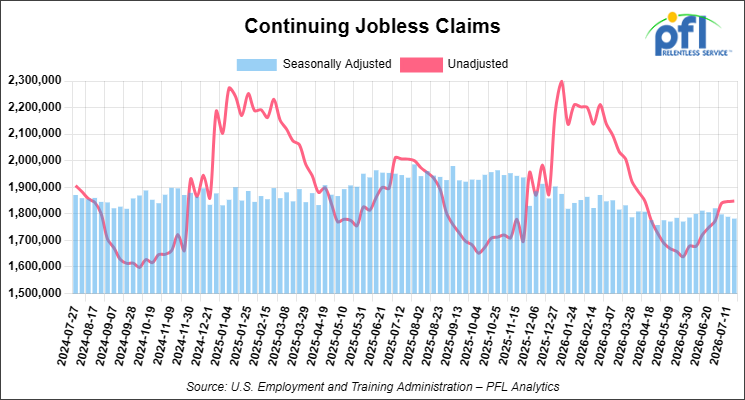
Continuing jobless claims came in at 1,782,000, versus the adjusted number of 1,789,000 people from the week prior, down 7,000 week-over-week.
Stocks closed higher on Friday of last week and higher week-over-week
The DOW closed higher on Friday of last week, up 276.97 points (0.53%), closing out the week at 52,485.03, up 537.78 points week-over-week. The S&P 500 closed higher on Friday of last week, up 52.09 points (0.70%), and closed out the week at 7,489.72, up 77.74 points week-over-week. The NASDAQ closed higher on Friday of last week, up 251.68 points (1.00%), and closed out the week at 25,373.85, up 398.03 points week-over-week.
In overnight trading, DOW futures traded higher and are expected to open at 52,988 this morning, up 353 points from Friday’s close.
Crude oil closed higher on Friday of last week, but lower week-over-week
West Texas Intermediate (WTI) crude closed up $1.08 per barrel (1.3%), to close at $84.67 on Friday of last week, but down $4.64 per barrel week-over-week. Brent crude closed up $1.09 per barrel (1.2%), to close at $90.12, but down $6.66 per barrel week-over-week.
One Exchange WCS (Western Canadian Select) for September delivery settled on Friday of last week at US$14.30 below the WTI-CMA (West Texas Intermediate – Calendar Month Average). The implied value was US$65.63 per barrel.
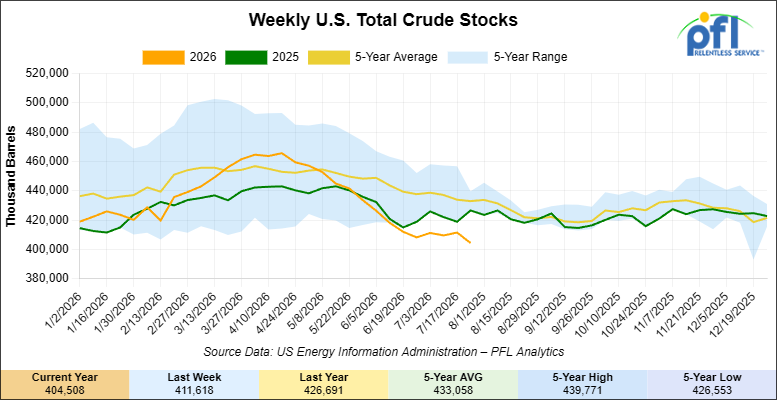
U.S. commercial crude oil inventories (excluding those in the Strategic Petroleum Reserve) decreased by 7.2 million barrels week-over-week. At 404.5 million barrels, U.S. crude oil inventories are 7% below the five-year average for this time of year.
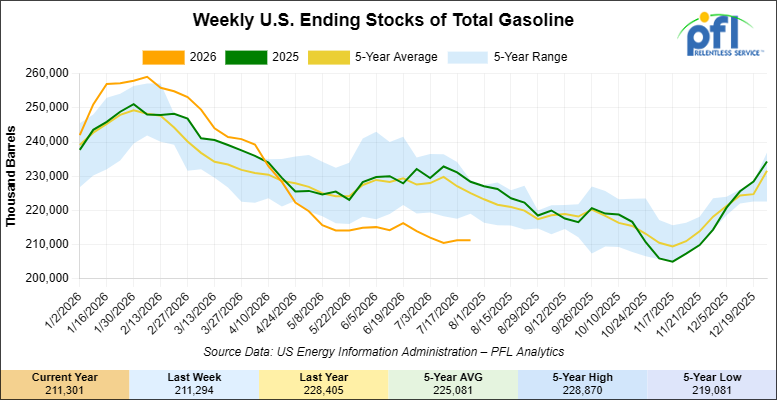
Total motor gasoline inventories slightly increased week-over-week and are 6% below the five-year average for this time of year.
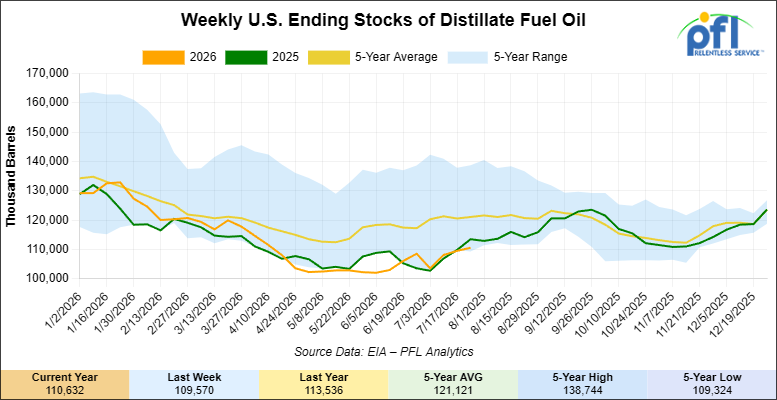
Distillate fuel inventories increased by 1.1 million barrels week-over-week and are 9% below the five-year average for this time of year.
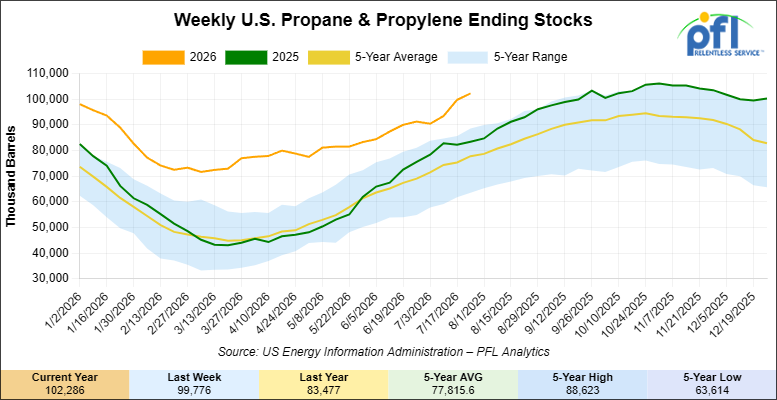
Propane/propylene inventories increased by 2.5 million barrels week-over-week and are 34% above the five-year average for this time of year.
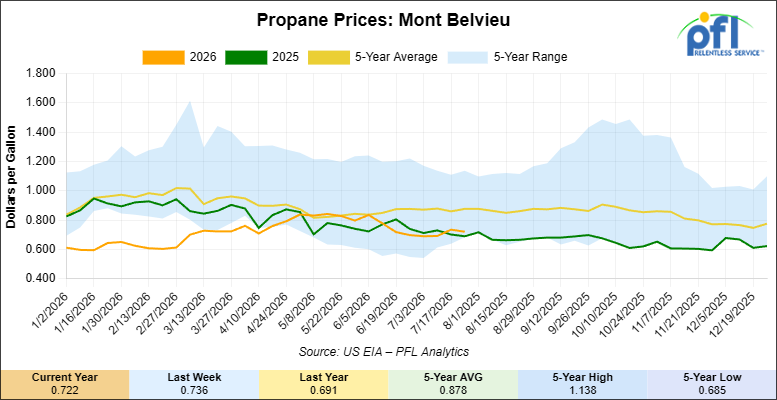
Propane prices closed at 72.2 cents per gallon on Friday of last week, down 1.4 cents per gallon week-over-week, but up 3.1 cents year-over-year.
Overall, total commercial petroleum inventories decreased by 3.7 million barrels week-over-week during the week ending July 24, 2026.
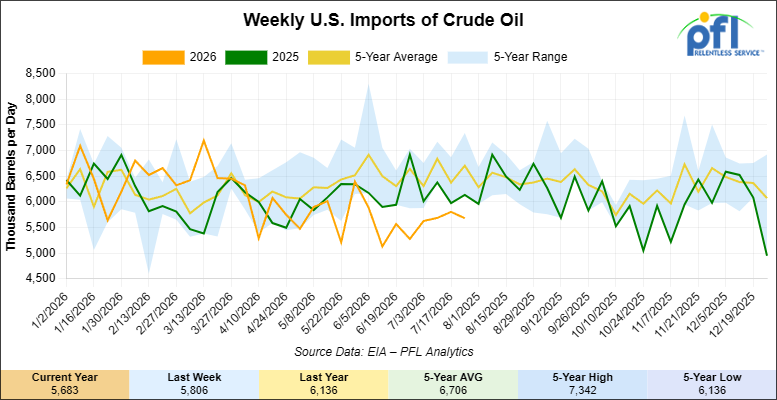
U.S. crude oil imports averaged 5.7 million barrels per day during the week ending July 24, 2026, a decrease of 124,000 barrels per day week-over-week. Over the past four weeks, crude oil imports averaged 5.7 million barrels per day, 6.9% less than the same four-week period last year. Total motor gasoline imports (including both finished gasoline and gasoline blending components) averaged 659,000 barrels per day, and distillate fuel imports averaged 98,000 barrels per day during the week ending July 24, 2026.
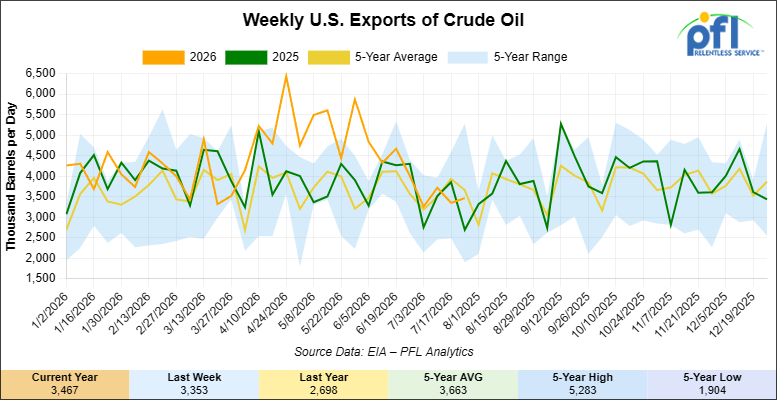
U.S. crude oil exports averaged 3.467 million barrels per day during the week ending July 24, 2026, an increase of 114,000 barrels per day week-over-week. Over the past four weeks, crude oil exports averaged 3.451 million barrels per day.
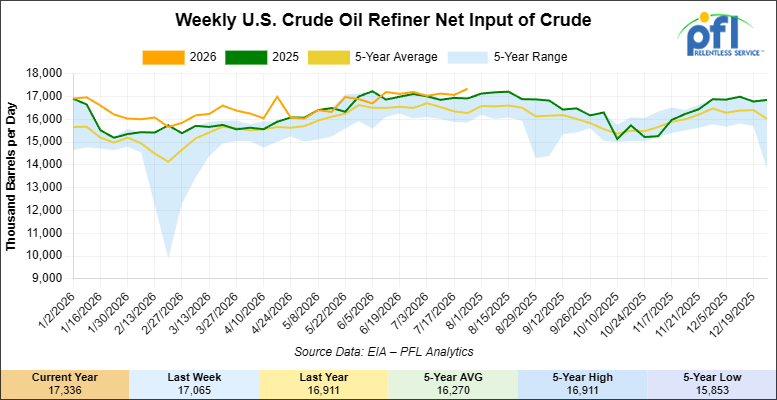
U.S. crude oil refinery inputs averaged 17.3 million barrels per day, during the week ending July 24, 2026, which was 271,000 barrels per day more week-over-week.
WTI is poised to open at $79.70, down $4.97 per barrel from Friday’s close.
North American Rail Traffic
Week Ending July 29, 2026:
Total North American weekly rail volumes were up (+3.31%) in week 31, compared with the same week last year. Total Carloads for the week ending July 29, 2026 were 334,577, up (+3.27%) compared with the same week in 2025, while weekly Intermodal volume was 355,620, up (+3.35%) year over year. 9 of the AAR’s 11 major traffic categories posted year-over-year increases. The largest decrease came from Coal (-1.33%). The largest increase was Metallic Ores and Metals (+12.46%).
In the East, CSX’s total volumes were up (+4.43%), with the largest decrease coming from Coal (-0.09%), while the largest increase came from Grain (+19.88%). NS’s total volumes were up (+2.63%), with the largest increase coming from Metallic Ores and Metals (+9.19%), while the largest decrease came from Farm Products (-7.40%).
In the West, BNSF’s total volumes were up (+2.77%), with the largest increase coming from Farm Products (+13.21%), while the largest decrease came from Forest Products (-6.72%). UP’s total volumes were up (+4.07%), with the largest increase coming from Petroleum & Petroleum Products (+19.78%), while the largest decrease came from Grain (-6.72%).
In Canada, CN’s total volumes were up (+1.67%), with the largest increase coming from Motor Vehicles and Parts (+20.01%), while the largest decrease came from Nonmetallic Minerals (-23.42%). CPKCS’s total volumes were up (+3.18%), with the largest increase coming from Metallic Ores and Metals (+57.40%), while the largest decrease came from Motor Vehicles and Parts (-19.44%).
Source Data: AAR – PFL Analytics
North American Rig Count Summary
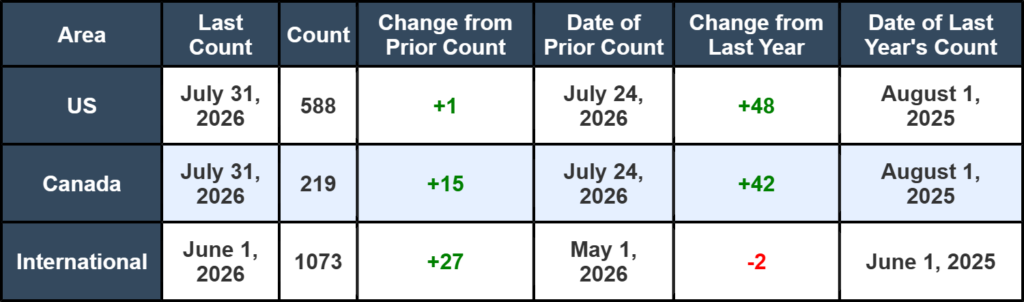
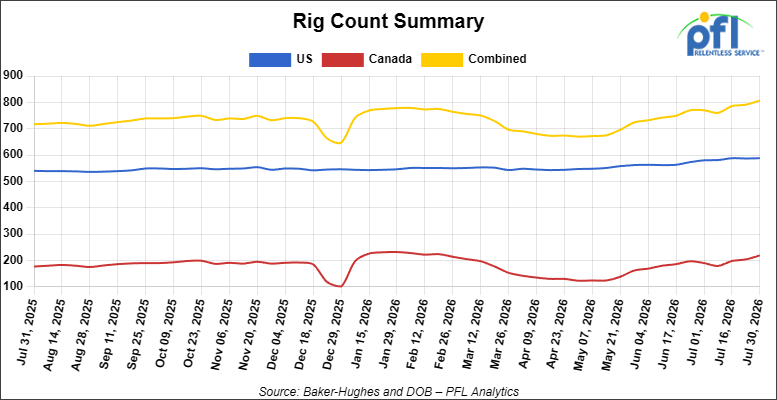
North American rig count was up by +16 rigs week-over-week. The US rig count was up by +1 rig week-over-week, and up by +48 rigs year-over-year. The US currently has 588 active rigs. Canada’s rig count was up by +15 rigs week-over-week and up by +42 rigs year-over-year. Canada currently has 219 active rigs. Overall, year-over-year we are up by +90 rigs collectively.
We are watching a few things out there for you:
We Are Watching Petroleum Carloads
The four-week rolling average of petroleum carloads carried on the six largest North American railroads fell to 29,612 from 29,656 which was a decrease of -44 rail cars week-over-week. Canadian volumes were higher. CN’s shipments were higher by +1.0% week-over-week, CPKC’s volumes were higher by +7.0% week-over-week. U.S. shipments were mixed. The NS had the largest percentage decrease and was down by -4.0% week-over-week. The UP had the largest percentage increase and was up by +8.0% week over week.
We Continue to Watch Our Strategic Petroleum Reserves
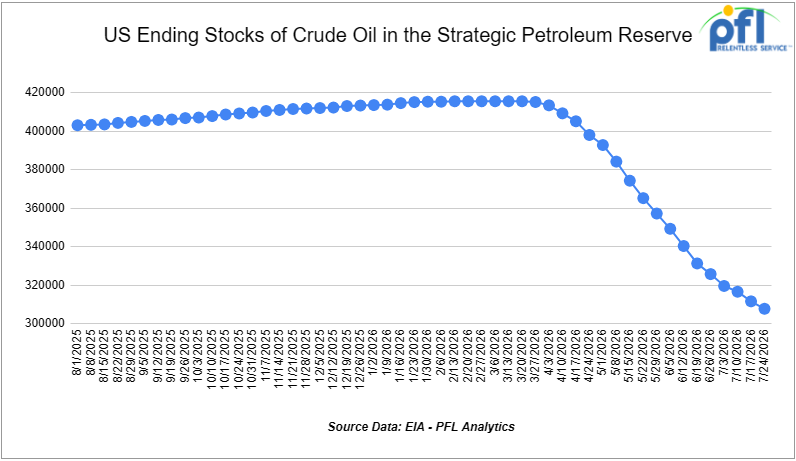
The ongoing emergency drawdown of the U.S. Strategic Petroleum Reserve (SPR) remains a major component of global efforts to offset crude oil supply disruptions stemming from the conflict involving Iran and the continued restrictions on oil shipments through the Strait of Hormuz. Since March, the Department of Energy (DOE) has awarded exchanges covering more than 133 million barrels of crude oil, with additional releases expected as part of a broader international response coordinated through the International Energy Agency (IEA).
The United States continues to execute its commitment to make available up to 172 million barrels from the SPR under the IEA’s collective plan to inject roughly 400 million barrels into global energy markets. Officials have argued that the releases are necessary to help stabilize crude supplies and limit further increases in fuel prices as refiners compete for replacement barrels amid ongoing transportation disruptions.
As releases have accelerated, inventories in the SPR have declined to 307.692 million barrels, down from 415.442 million barrels at the start of the conflict with Iran and reaching their lowest level since March 1983. Recent weekly withdrawals have ranked among the largest on record, highlighting the scale of the government’s intervention in oil markets. Since the first SPR drawdown began, the United States has withdrawn approximately 1.05 million barrels per day from the SPR through the week ending July 24, 2026.
Global petroleum inventories have also tightened considerably. The IEA has reported substantial draws in commercial crude and refined-product stockpiles across major consuming nations, underscoring the strain that the conflict has placed on world energy markets. Agency officials have indicated that further coordinated actions remain possible should supply disruptions persist or intensify.
The Administration continues to emphasize that the current program consists primarily of exchange agreements, rather than outright sales. Under these arrangements, companies receiving crude oil today are required to return the borrowed barrels in the future along with additional volumes as a premium. Energy Secretary Chris Wright has stated that the objective is to eventually restore the SPR to levels above those that existed prior to the current emergency releases.
We Are Watching Canadian Crude by Rail
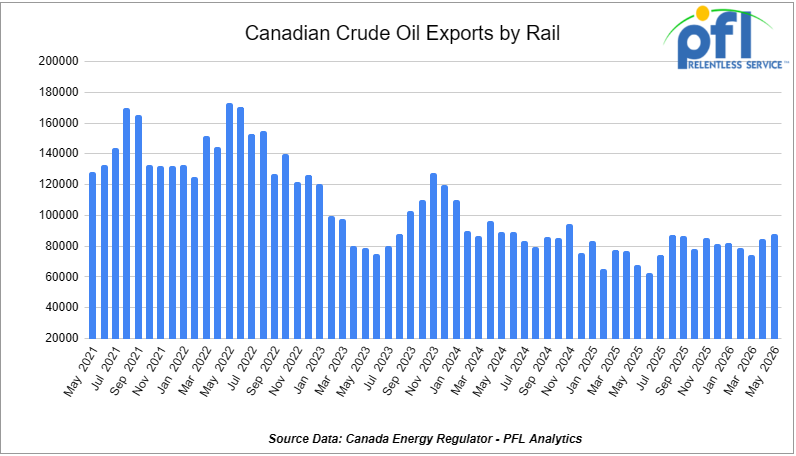
The Canadian Energy regulator reported on July 22, 2026, that 87,977 barrels were exported during the month of May 2026, up from 84,534 barrels in April of 2026, an increase of 3,443 barrels per day month-over-month. Its largest reading since November of 2024 where 94,188 barrels per day were exported to the United States.
Crude by rail will always be necessary out of Canada for stranded oil not connected by pipelines. Raw bitumen, which is shipped as a non-haz product and is not able to flow in pipelines, is competitive with pipeline tolls and is a growing market to keep an eye on. In a normal predictable market we really need to see basis WTI-CMA (West Texas Intermediate – Calendar Month Average) blowout to -18 per barrel for sustained periods of time to make economic sense. Current rail rates from Alberta to the U.S. Gulf Coast have averaged roughly $17 per barrel, making rail competitive whenever WCS-WTI spreads exceed $18 per barrel, including quality adjustments.
This is not a fleet that switches overnight: car owners and lessors want five-year commitments, the Class Ones expect similar term, and new 117J cars carry one to two year build times.
Folks, what we are in now is not a normal and predictable market. Some would say nothing has been normal or predictable since COVID. With pipelines out of Alberta full or nearly full one consideration is the outright price of oil itself, with the conflict in Iran not seeming to go away anytime soon, some may step up, take on some cars to get barrels to market quickly. Mistreamers won’t do that, however, we may see the producer step up. For the producer it is all about what their netback is, not how much it costs to get there. The producer can pay more than $18 per barrel right now if that is their only outlet and pipelines are full. The risk reward ratio may make sense with elevated prices but the old saying – what goes up must come down it is just a matter of when. We always have our eyes on this one please stay tuned to PFL or call the desk to trouble shoot.
We Continue to Watch Left Wing Carney
Canadian oil sands producer and refiner Cenovus chief executive Jon McKenzie told analysts on the company’s second quarter call on Wednesday of last week that trilateral negotiations among Alberta, Ottawa and the Oil Sands Alliance on a deal to grow production and export capacity while reducing emissions are advancing. He also said the underlying memorandum still carries an “uncompetitive carbon tax that uniquely burdens Canadian industry,” while allowing that it creates a framework for governments and industry to work together on production growth, emissions reduction and expanded market access.
The trilateral deal extends the federal and Alberta memorandum that set out the conditions for a West Coast pipeline, which include new industrial carbon taxes and construction of the Pathways carbon capture project. The Oil Sands Alliance signed its own memorandum with both governments in early July. Ottawa’s has an October 1st deadline to designate the pipeline a project of national interest is still in the cards – Alberta’s submission carried no shipper commitments.
The carbon tax is not the only constraint on oil sands capital. Under the OSFI B-15 guideline, federally regulated banks and insurers must measure and report the emissions financed through their loan books. The first Climate Risk Returns cycle, covering Canada’s six systemically important banks and four internationally active insurance groups, found approximately 360 million tonnes of carbon dioxide equivalent in financed emissions, 301 million at the banks and 58.2 million at the insurers, against a national inventory of roughly 694 million tonnes. Setting aside sovereign holdings, transition vulnerable sectors accounted for about half of the banks’ financed emissions, led by agriculture, transportation and fossil fuels. The banks through regulation in Canada are married to Canada’s version of what we use to call at PFL “The Green New Deal”.
Nobody in Ottawa has instructed a bank not to lend to an oil sands producer. The regime does not work that way. It requires the lender to carry the borrower’s emissions on its own regulatory return, which makes the credit expensive to hold whatever the project economics look like. The Big Five left the Net-Zero Banking Alliance in January 2025 and kept the reporting machinery running, because the reporting is mandatory. Scope 3 disclosure has been deferred to fiscal 2028 and off-balance-sheet capital markets emissions to fiscal 2029, so the obligation grows from here.
In our opinion, a framework is not a final investment decision. Ottawa gets to announce a pipeline while keeping both the levy and the disclosure regime that make it harder to finance and calls the result a partnership. We continue to watch this one folks – please call PFL today to trouble shoot.
We Are Watching Renewables
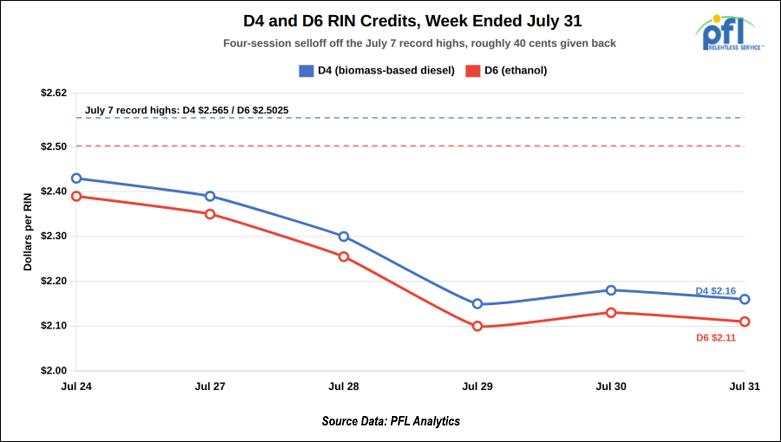
Ethanol D6 and biomass-based diesel D4 credits set all-time highs of $2.5025 and $2.565 on July 7th and have given back roughly 40 cents apiece since. D6 closed Friday of last week at $2.11 and D4 at $2.16, down 28 cents and 27 cents week-over-week. The selloff ran three straight sessions. D6 lost 4 cents Monday of last week, 9.5 cents Tuesday and 15.5 cents Wednesday, taking both credits to 10-week lows, the weakest since May 21. Thursday brought a 3 cent bounce and Friday gave 2 cents of it back. Ethanol at Argo finished the week at $1.96 per gallon, up 3 cents, and California LCFS credits closed at $80 per tonne, up $5.50.
Two things drove the selloff. Market participants pointed to speculation that EPA will side with refiners seeking exemption from the Renewable Fuel Standard, and a court filing confirmed the agency must rule on two small refinery exemption petitions for the 2024 compliance year, covering HF Sinclair’s Parco refinery in Wyoming and Alon’s Krotz Springs facility in Louisiana, no later than August 3. HF Sinclair has sued EPA over the delay with the 2025 compliance deadline set for September 1st, and Reuters reported the agency is weighing an extension of that deadline. The soybean oil to heating oil spread also collapsed, falling below $1 for the first time since early April, and credit prices generally follow it.
The obligated parties see it differently. Valero’s senior vice president of renewable operations said on the company’s second quarter call that 2026 will be a low production year against the obligation, drawing down the credit bank and keeping D4 structurally elevated, with the bank potentially exhausted between year end and the middle of 2027. Chairman Lane Riggs noted the market has little precedent for how the standard would function if credits were no longer available. CVR Energy reported $216 million of compliance costs in the second quarter, a net RIN expense of $11.16 per barrel, and slowed its purchases on the view that EPA will eventually be forced to intervene. CoBank put numbers on the gap: the 2026 and 2027 obligations jump 67% and 70% above the 2025 total of 5.42 billion gallons, which would require biomass-based diesel capacity use to reach 90% this year and 95% next, against nearly 60% in 2025.
U.S. ethanol production reached 1.133 million barrels per day in the week ended July 24, the second highest rate on record and a 28-week high, running 3.4% above the same week last year. Inventories built for a third consecutive week to 24.726 million barrels. Rule 11 railcar ethanol at Chicago last changed hands near $1.94 per gallon, four cents higher on the week, while FOB railcar Nebraska traded $1.76 on the Union Pacific line and as much as $1.80 on the BNSF line. ADM said last Thursday it will expand oilseed crush capacity at four plants by roughly 700,000 tonnes per year, including Spiritwood, North Dakota, which feeds Marathon’s 184 million gallon per year renewable diesel plant at Dickinson.
A mandate rising 67% has to be met with physical gallons moving to blend points, and the capacity to make them is not built yet. That is a tank car and covered hopper problem.
We Are Watching the Lease Market
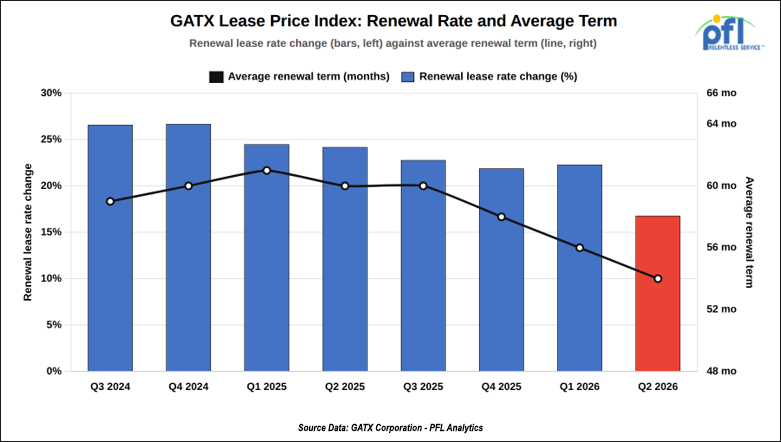
GATX reported second quarter results on Thursday of last week showing the renewal lease rate change on its Lease Price Index at positive 16.8%, down from 22.3% in the first quarter and 24.2% in the second quarter of 2025. The average renewal term on cars in the index fell to 54 months from 60 months a year ago, even as the renewal success rate climbed to 82.6% from 79.1% in the prior quarter. Rail North America finished the quarter with fleet utilization at 98.0% across roughly 201,800 cars excluding boxcars, and segment profit rose to $118.5 million from $96.6 million a year earlier.
Trinity reported the same day. Orders of 1,560 cars against 1,570 deliveries put book-to-bill at roughly 1.0, while backlog closed at 11,340 units and $1.59 billion, down 19.8% in units and 19.1% in dollars from a year earlier. Earnings of $1.25 per share leaned on a $132 million non-cash pre-tax gain from the Napier Park partnership transaction. Rail Products operating profit fell 61.8% on lower deliveries and a production interruption at the Longview, Texas plant, where a two-facility consolidation runs into early 2027. Lease fleet utilization was 97.3%, renewal success improved to 75%, and the future lease rate differential was positive 3.5%. Jean Savage told analysts the market is turning.
Lessees are renewing more often than they were three months ago but signing shorter deals, and the rate escalation that held above 20% for two years has broken. GATX said the index was held down by an outsized quarter of sand car renewals at lower rates, the same in-basin sand substitution we covered last week. Trinity holds just under half the industry backlog, so book-to-bill near 1.0 at that share sets a floor. It does not signal a recovery.
Section 232 tariffs on imported tank cars remain unresolved. GATX said it is contractually responsible for those tariffs, has seen no material impact to date, and described the situation as fluid. It seems to us at PFL that the shortening renewal term matters more than the headline rate. Fifty-four months is still a long commitment, but it is half a year shorter than it was, and lessees who expect softer rates ahead do not lock in five years.
We Continue to Watch the Surface Transportation Board
Union Pacific and Norfolk Southern filed their second and final supplemental response on July 27th, meeting the deadline the Surface Transportation Board set on May 28th when it accepted the revised application and placed the proceeding, including the environmental review, in abeyance. The filing completes the applicants’ response and clears the way for the Board to lift the abeyance and start the formal evaluation clock on the $85 billion transaction.
Four commitments came with it. Committed gateway pricing roughly doubles the number of eligible shipments and extends to bulk unit train shippers, which the applicants describe as the functional equivalent of thousands of haulage agreements in a single enforceable commitment. The railroads also pledged to preserve Class I options for shippers dropping from three carriers to two, not only from two to one, wherever they can legally grant access to another railroad. Service-level protections would let customers seek temporary alternate rail service in the event of a service decline, and a new rate relief process adds Board oversight. An earlier filing on July 7th addressed the Terminal Railroad Association of St. Louis, Kansas City Terminal Railway and TTX.
Union Pacific and CN signed a binding memorandum of understanding on July 22nd. CN takes Norfolk Southern’s ownership interests in the Kansas City Terminal Railway and the Terminal Railroad Association of St. Louis, gains overhead rights between Tuscola and East St. Louis, Illinois, wins the right to serve customers between St. Louis and Kansas City including use of Union Pacific’s Neff Yard, and picks up operating rights between Memphis and the Eagle Pass gateway to Mexico. Union Pacific gains rights over CN’s former Elgin, Joliet and Eastern route around Chicago. In exchange, CN agreed not to oppose the merger, removing one of the four Class I objectors.
BNSF was not persuaded. In a July 24 customer letter, chief marketing officer Tom Williams argued that the CN agreements demonstrate new routes and market access can be created through commercial partnerships, which cuts against more than a year of Union Pacific’s case that only a merger could deliver them. BNSF’s position is that the combined railroad would still control roughly half the U.S. freight rail market and leave some customers with fewer competitive options. Applicants continue to target mid-2027 for closing.
The Board has not said when it will rule on the supplement. Committed gateway pricing and the three-to-two access commitment are the provisions to track through the conditions phase, since they carry most of the value to a private car owner.
We Are Watching Demurrage
RailPulse said on Wednesday of last week that beginning October 1st, railcar location and time data submitted by subscribers and generated through its platform will serve as the definitive record for demurrage and storage charge dispute resolution, subject to limited exceptions, between participating subscribers and RailPulse member railroads. These disputes have historically turned on competing and occasionally conflicting records of when a car arrived and how long it sat, and the framework replaces that with a single shared dataset.
Arrival, departure and dwell events come from certified telemetry devices on subscriber-equipped cars. Billing continues under each railroad’s existing process, so the invoice does not change, only the record behind it. Mike McClellan, the RailPulse founder who is also senior vice president and chief strategy officer at Norfolk Southern, described standardized data that shippers and railroads agree on as resolving a long-standing friction point. Nucor chief mechanical officer Steve Skeels noted that these disputes absorb significant time and attention before the underlying issue is even addressed.
A fleet carrying certified telemetry argues from its own record after October 1st, and a fleet without it argues with the railroad’s. That makes it an equipment decision with a deadline on it. The framework applies only among participating subscribers and member railroads, so the practical value to any given fleet depends on which railroads it interchanges with.
PFL works with fleet operators weighing telematics against cycle-time and dwell exposure. It seems to us at PFL that owners with cars in high-dwell service should price the devices against a couple of years of contested demurrage before they look at the hardware cost!
We Are Watching Barstow
A coalition of environmental groups sued on July 1 to send BNSF’s Barstow International Gateway back to the start of environmental review, two weeks after the project won unanimous support from the Barstow City Council in June and after it had already cleared a two-year California review. The $4 billion, 4,500-acre intermodal terminal, block-swap yard and container transload facility is now tied up in litigation.
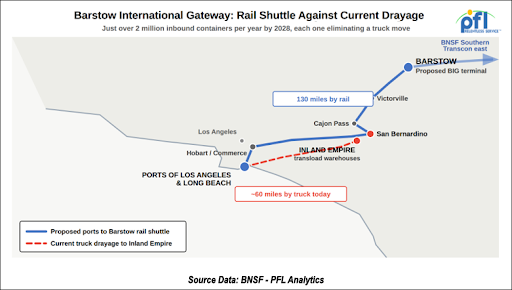
International containers arriving at Los Angeles and Long Beach would load directly onto well cars at the ports and move 130 miles by rail to Barstow, where they would be transloaded into domestic containers at warehouses on site and railed to inland destinations. The terminal would handle just over 2 million inbound containers by rail per year in 2028, each one eliminating a truck move. At present those boxes are trucked roughly 60 miles to the Inland Empire, transloaded, then trucked again to BNSF terminals at San Bernardino and Hobart.
Moving freight by rail produces up to 75% fewer greenhouse gas emissions than moving it by truck. The site would use zero-emission rail-mounted gantry cranes, hybrid rubber-tired gantry cranes, zero-emission forklifts and hostlers, electric plug-ins for refrigeration units and a 21-megawatt solar farm, with Tier 4 locomotives dedicated to the port shuttles and agreements already in place with the Mojave Desert Air Quality Management District and the California Air Resources Board. Plaintiffs want the main line electrified instead, which is not a product anyone can currently buy: battery-electric and hydrogen fuel cell line-haul locomotives remain prototypes, and overhead catenary would require a high-traction, high-horsepower locomotive that has not been developed.
The project is projected to create 3,627 direct jobs in 2028 in a town where 23% of residents live below the poverty line. A project that cleared state review, won unanimous local approval and arrived with this mitigation package can still lose years to litigation, and anyone modeling a large terminal, transload or storage facility should price that in. We will be keeping our eye on this one.
We Are Watching the CN
CN said Friday of last week that it is supporting more than 300 shipper development projects across its North American network while investing about C$2.8 billion in capital improvements during 2026. The railway brought more than 70 customer projects into service in 2025, representing over C$2 billion in customer investment, and has put 30 shipper-led projects into service so far in 2026 with another 70 expected through the end of the year and into early 2027.
Sandra Ellis, CN’s vice president of bulk, industrial and business development, tied the pipeline of projects to customer confidence in network capacity, pointing to investment in the capacity, infrastructure and operating model needed to support new business while maintaining fluidity. Named capital projects include a new Zanardi Rapids Bridge at the Port of Prince Rupert and a double-track project at Glen Valley, British Columbia, both on the western corridor.
Growth in rail traffic extends well beyond the movement of freight. Every new customer, facility and railcar added to the network increases the need for the services that keep equipment operating safely and efficiently throughout its lifecycle. Railcar inspections, maintenance, cleaning, repairs, qualifications, storage and field support all play an essential role in ensuring rail assets remain safe, compliant and available to meet growing customer demand.
PFL works with shippers and fleet operators standing up new facilities, where the car requirement and the service plan tend to get settled later than they should. It seems to us at PFL that 300 projects entering service across roughly eighteen months is worth planning against now, well ahead of when the cars are needed.
We Are Always Watching Safety
As North America’s rail network continues to grow and operations become more complex, the industry’s commitment to safety has never been more important. Whether it’s a Class I railroad, a short line, an industrial facility, or a customer siding, today’s operations are busier than ever. More trains, more switching, and more people working around rail equipment mean every movement must be carefully planned and executed.
One of the biggest trends shaping the industry is the increasing use of technology to support safe operations. Automated inspection systems, real-time monitoring, enhanced communications, and advanced detection technologies are giving crews better visibility into potential hazards and helping them make informed decisions in the field. These tools don’t replace experience, they complement it by providing another layer of awareness in dynamic operating environments.
Even with these advances, technology is only part of the solution. The foundation of every safe rail operation remains experienced people, thorough training, clear communication, disciplined operating procedures, and a strong safety culture. Every inspection completed, every repair verified, and every pre-job briefing contributes to preventing incidents before they occur.
Here at PFL, that philosophy guides every project we undertake. Our crews support customers across North America with railcar inspections, mobile repairs, valve services, cleaning, flaring, maintenance, and field support. Whether we’re working in an active rail yard, refinery, petrochemical complex, transload facility, or on a short line, every job begins with proper planning, hazard identification, equipment verification, and clear communication. We believe there is no substitute for doing the job safely the first time.
Safety also extends beyond protecting people, it protects our customers’ operations. Well-maintained railcars, properly executed repairs, and disciplined field practices help reduce downtime, improve reliability, and keep freight moving efficiently throughout the supply chain. A strong safety culture benefits everyone, from railroad employees and contractors to shippers and the communities we serve.
As the industry continues to invest in new technologies and best practices, the goal remains the same: reduce risk while improving operational reliability. Innovation will continue to shape the future of rail safety, but experienced people, disciplined execution, and a commitment to continuous improvement will always be at its core.
PFL is watching how safety continues to evolve across the North American rail industry. By combining experienced field crews with proven operating practices and a commitment to continuous improvement, we remain focused on helping our customers operate safely, reliably, and efficiently every day.
We Are Watching Key Economic Indicators
Consumer Spending
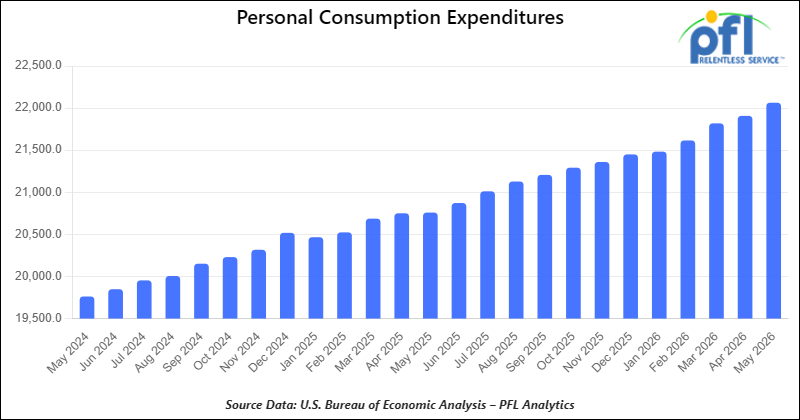
In June 2026, total consumer spending adjusted for inflation rose 0.4% from May 2026, continuing a moderate pace of growth in household demand. This follows a 0.3% increase in May 2026 and no change in April 2026. Year-over-year inflation-adjusted total spending remained positive, reflecting continued resilience in consumer demand, despite moderating inflation.
Inflation-adjusted spending on goods and services both increased in June. Services spending continued to outpace goods spending, extending the ongoing strength in service-sector consumption, while goods spending was supported by broad-based gains outside of energy-related purchases.
Consumer Confidence
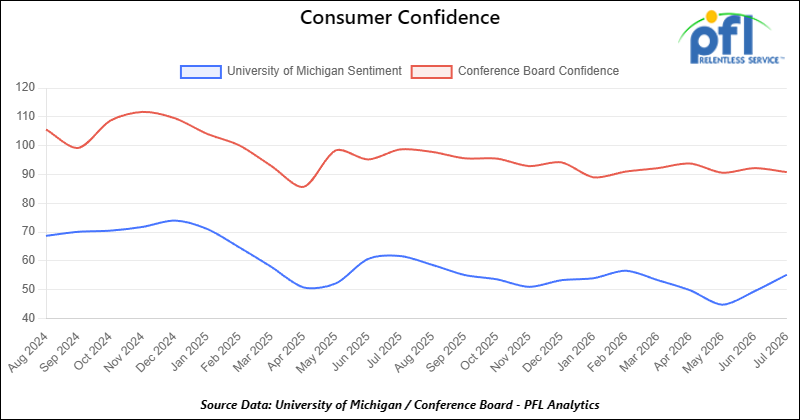
The Index of Consumer Sentiment from the University of Michigan increased from 49.5 in June to 55.2 in July.
The Conference Board Consumer Confidence Index decreased from 92.2 in June to 90.8 in July.
Lease Bids
- 20-50, 4000-5000 Covered Hoppers located off of UP or BNSF in Houston. For use in Urea, Potash, and Ammonium Sulfate service. Period: 6-12 Months.
- 30-50, 25.5K DOT 111 Tanks located off of All Class 1s in various locations. For use in Asphalt service. Period: 1-3 Years.
- 40, 29K DOT 111 Tanks located off of UP or BNSF in the Midwest. For use in Veg Oil service. Period: 5 Year.
- 20, DOT 117J Tanks located off of NS, CSX, CN, or CPKC in various locations. For use in C5 service. Period: 1 year. Need gauge rods.
- 300, 5200CF Covered Hoppers located off of CP or CM in Canada. For use in Petcoke service. Period: 3 Year.
- 10, 30K 117J Tanks located off of BNSF in Canada. For use in Propane or Butane service. Period: 3 Year.
- 20, 28K or larger 117J Tanks located off of BNSF or UP in California. For use in Crude service. Period: 6 months.
- 75, 30K 117 Tanks located off of NS in Ohio. For use in Condensate service. Period: 6-12 Months. Mag Rods Not Needed.
- 100, 28.3K DOT 111 or 117 Tanks located off of CP or CN in Canada. For use in VGO service. Period: 1-3 Years.
- 5, 28.3K DOT 111 or 117 Tanks located off of CN in Canada. For use in Bitumen service. Period: Trip Lease.
- 5-10, 25.5K DOT 111 Tanks located off of CN in Canada. For use in Caustic service. Period: 3-6 Months.
- 100, 340W Pressure Tank located off of CN or CP in Canada. For use in Propane service. Period: 6 Months.
- 10-20, 3200 or 3281 Covered Hoppercars located off of CN or CP in Canada. For use in Sodium Sulphate service. Period: 3-5 years. Lined.
- 50, 340W Pressure Tank located off of CN or CP in Canada. For use in Propane service. Period: Winter.
- 30-50, 340W pressure Tank located off of NS or CSX in Northeast U.S. For use in Propane service. Period: Winter.
- 25, 340W Pressure Tank located off of UP or BN in US. For use in Propane service. Period: Winter.
- 50, 28.3K 117J Tank located off of BNSF in Kansas/Oklahoma. For use in Fuel Oil service. Period: 6 Months.
- 100, 28.3K 117J Tank located off of CN in Canada. For use in Diesel service. Period: 1 year.
Sales Bids
- 28, 3400CF Covered Hoppers located off of UP or BNSF in Texas. For use in Cement service. Cement Gates needed.
- 20, 17K DOT111 Tanks located off of various class 1s in various locations. For use in corn syrup service.
- 120, Various Open-Top Aluminum Rotary Gondolas located off of various class 1s in various locations. For use in Sulphur service. Built 2004 or later.
- 12, 21.5K-25K DOT 111 Tanks located off of Various Class 1s in Michigan. For use in Diesel, Asphalt, Crude service. Coiled and Insulated.
Lease Offers
- 21, 6351 Covered Hoppers located off of CN in Wisconsin. Last used in DDG. Available until February 2027.
- 29, 6500 Covered Hoppers located off of CN in Wisconsin. Last used in DDG. Available until February 2027.
- 29, 25.5K DOT117J Tanks located off of UP or BNSF in Texas. Cars are currently clean.
- 200, 340W DOT 112J Tanks located off of all class 1s in Multiple Locations. Last used in propane and butane. Cars are currently clean.
- 15, 6200CF Covered Hoppers located off of all class 1s in Wisconsin. Last used in plastic. Cars are currently clean.
- 30, 6500CF Covered Hoppers located off of all class 1s in Wisconsin. Last used in plastic. Cars are currently clean.
- 6, 21K Stainless Steel Tanks located off of UP in Texas / Mexico Border. Last used in surfactant. Cars are currently clean.
- 100, 28.4K DOT 117J Tanks located off of UP or BNSF in Beaumont, TX. Cars are currently clean.
- 50, 30K DOT117J Tanks located off of UP or BNSF in the South. Last used in ethanol.
- 30, 30K DOT 117R Tanks located off of BNSF in Washington. Last used in renewable jet fuel.
- 80, 30K DOT 117R Tanks located off of BNSF in Washington. Last used in renewable diesel.
- 10, 30K DOT 117R Tanks located off of BNSF in Washington. Last used in renewable naphtha.
- 10, 29K DOT 117R Tanks located off of BNSF and UP in Texas. Last used in gasoline additive. Coiled and Insulated.
- 39, 31K CPC1232 Tanks located off of All Class 1s in Iowa. Last used in diesel.
- 2, 30K DOT 117R Tanks located off of BNSF and UP in Texas. Last used in Diesel.
- 1, 30K DOT 117R Tanks located off of BNSF and UP in Texas. Last used in gas blend stock.
- 3, 30K DOT 117R Tanks located off of BNSF and UP in Texas. Last used in gasoline.
- 41, 30K DOT 111 Tanks located off of in Brownsville. Last used in Diesel. Cars are currently clean.
Sales Offers
- 81, 31.8K CPC1232 Tanks located off of UP or BNSF in TX. Last used in Multiple Services. Requal Due in 2025.
- 35, 3400CF Covered Hoppers located off of UP or BNSF in the Midwest. Last used in Sand.
- 25, 30K 117J Tanks located off of CSX in Jackson, TN. Last used in Fuels. Newly Requalified.
Call PFL today to discuss your needs and our availability and market reach. Whether you are looking to lease cars, lease out cars, buy cars, or sell cars call PFL today at 239-390-2885
Railcar for Sale or Lease
| CAT | Type | Capacity | GRL | QTY | LOC | Class | Prev. Use | Offer | Note |
|---|
| CAT | Type | Size | GRL | QTY | LOC | Class | Term | Commodity | Offer | Note |
|---|
| CAT | Type | Capacity | GRL | QTY | LOC | Class | Prev. Use | Clean | Offer | Note |
|---|
| CAT | Type | Capacity | GRL | QTY | LOC | Class | Commodity | Offer | Note |
|---|
PFL will be at the Following Conferences

- Where: The Gaylord Opryland Hotel
- Attending: Brian Baker (239.297.4519)
- Conference Website

- Where: The Westin Galleria Dallas
- Attending: David Cohen (954-729-4774), and Curtis Chandler (239-405-3365)
- Conference Website
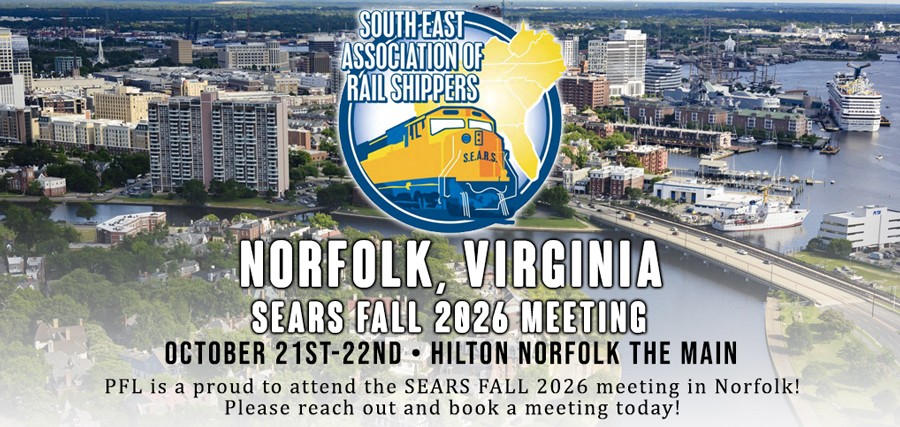
- Where: The Westin Galleria Dallas
- Attending: Brian Baker (239.297.4519)
- Conference Website