” There are two kinds of people: those who do the work and those who take the credit. Try to be in the first group; there is less competition there.” — Indira Gandi
COVID-19 and Markets Update
The United States currently has 4,813,984 confirmed COVID-19 cases and 158,372 confirmed deaths
The U.S. Labor Department stated on Thursday of last week that U.S. workers filed an additional 1.45 million jobless claims, bringing the total job losses since the coronavirus pandemic to 52 million, exceeding expectations yet again and the markets suffered as a result over all last week outside of a few high tech flyers.
The DOW did close higher on Friday, up 144.67 points (+ 0.44%) to finish out the week at 26,428.32. The S&P 500 traded up 24.90 points (+0.77%) on Friday, closing at 3,271.12 The Nasdaq finished the session higher as well, gaining 157.46 points (+1.49%) and closing out the week at 10,745.27. In overnight trading, DOW futures traded lower and are expected to open down this morning 15 points.
West Texas Intermediate (WTI) traded up 35¢ to close at $40.27 on Friday on the New York Mercantile Exchange, however, the contract was down $1.02 per barrel week over week on the back of weaker economic indicators here in the U.S. with GDP hitting its lowest level since the Great Depression as the Chinese COVID 19 virus continues to plague the us.
Brent traded up .27¢ cents to close at $43.52 on Friday of last week, a gain of 16¢ per barrel week over week.
U.S. crude inventories fell by 10.6 million barrels last week and now stand at 526 MM/bbls. According to the EIA net U.S. crude imports fell one million bbls/d, dropping to 1.9 million bbls/d.
Gasoline inventories were up by 654,000 bbls while distillate inventories increased by 503,000 MM/bbls.
May 2020 was the largest output cut on record as in relates to crude production– with U.S. crude production falling a record 2MM/bpd. “After a bad day for big oil on Friday of last week with terrible earnings for all, we are now starting to see the impact in barrels,” said Phil Flynn, an analyst at Price Futures in Chicago. This suggests that we will see a tighter market in the future, and if the economy turns around we will have trouble meeting demand.” The U.S. dollar continued its dramatic fall on Friday of last week and had its biggest monthly drop in over a decade. Thursday’s terrible GDP news, global stimulus packages, and a weak U.S. dollar will continue to be supportive of oil prices.
Oil is lower in overnight trading and as of the writing of this report, WTI is poised to open at $39.80 down 47¢/ barrel from Friday’s close
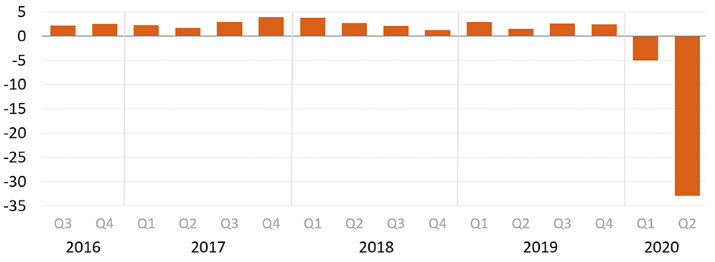
Real gross domestic product (GDP) decreased at an annual rate of 32.9% in the second quarter of 2020 according to the “advance” estimate released by the Bureau of Economic Analysis. In the first quarter, real GDP decreased by 5.0 percent. Current‑dollar GDP decreased 34.3 percent, or $2.15 trillion, in the second quarter to a level of $19.41 trillion. In the first quarter, GDP decreased by 3.4 percent, or $186.3 billion (see chart below):

The GDP estimate released on July 30th is based on source data that are incomplete or subject to further revision by the source agency The “second” estimate for the second quarter, based on more complete data, will be released on August 27, 2020.
Things we are keeping an eye on:
- Folks, we are still monitoring DAPL – no news from the judge yet if DAPL will be shut down. ONEOK said on its earnings call last week on July 29th that could re-purpose its Bakken natural gas liquids pipeline for crude service if the Dakota Access pipeline shuts.
- No news on Marathon’s High Plains Crude Oil Pipeline that was ordered to shut down by the U.S. Interior Department’s Bureau of Indian.
- Canadian producers said they are increasing production, however, crude and basis markets suffered last and netbacks to Canadian producers got worse for Canadian producers than its U.S. counterparts. WCS for September delivery closed Friday at US -$9.93 per barrel below the WTI-CMA. The implied value was US $30.58 compared to an implied value of US $31.88 on the 24th of July down a US$1.30 week over week.
Rig Count
North America rig count moved higher and is up 3 rigs week over week with the U.S. flat week over week and Canada gaining 3 rigs. Year over year we are down 783 rigs collectively. Canada now has 45 rigs nationwide operating and the U.S. has 251 rigs operating.
North American Rig Count Summary

In the U.S. there are 181 rigs drilling for oil, 68 rigs drilling for natural gas and two miscellaneous rigs according to Baker Hughes. This is the fifth consecutive week where we have seen U.S. rig counts continue to deteriorate or remain flat week over week (in the case of week 30) while Canadian rig counts posted gains. According to Baker Hughes, this is the lowest level of U.S. rig count activity since 1987.
We have been extremely busy at PFL with return on lease programs involving rail car storage instead of returning cars to a shop. A quick turnaround is what we all want and need. Railcar storage in general has been extremely active. Please call PFL now at 239-390-2885 if you are looking for rail car storage, want to trouble shoot a return on lease scenario or have storage availability. Whether you are a car owner, lessor or lessee or even a class 1 that wants to help out a customer we are here to “help you help your customer!”
North American Rail Traffic
Total North American rail volumes were down 9.7% year over year in week 30 (U.S. -9.9%, Canada -7.5%, Mexico -14.2%), resulting in quarter-to-date volumes that are down 9.2% and year to date volumes that are down 11.6% (U.S. -12.7%, Canada -8.5%, Mexico -10.0%). 10 of the AAR’s 11 major traffic categories posted year-over-year declines with the largest decreases coming from coal (-28.5%), metallic ores & metals (-25.5%), intermodal (-2.9%) and nonmetallic minerals (-20.9%). The largest increase came from farm products & food (+11.4%).
In the East, CSX’s total volumes were down 9.8%, with the largest decreases coming from coal (-31.7%), motor vehicles & parts (-14.2%) and metals & products (-36.5%). NS’s total volumes were down 9.0%, with the largest decreases coming from coal (-35.6%), intermodal (-3.6%), petroleum (-56.0%) and metals & products (-27.0%). The largest increase came from motor vehicles & parts (+15.9%).
In the West, BN’s total volumes were down 13.1%, with the largest decreases coming from coal (-27.6%), intermodal (-5.3%) and petroleum (-33.7%). UP’s total volumes were down 8.0%, with the largest decreases coming from coal (-27.0%), stone sand & gravel (-32.9%), chemicals (-12.0%) and petroleum (-29.8%). The largest increase came from intermodal (+3.5%).
In Canada, CN’s total volumes were down 6.8% with the largest decreases coming from petroleum (-32.0%), stone sand & gravel (-51.4%) and coal (-26.4%). The largest increase came from intermodal (+4.3%). RTMs were down 12.0%. CP’s total volumes were down 10.4%, with the largest decreases coming from petroleum (-53.5%) and intermodal (-9.6%). The largest increase came from farm products (+84.7%). RTMs were down 8.6%.
KCS’s total volumes were down 6.9%, with the largest decreases coming from motor vehicles & parts (-28.4%) and intermodal (-4.2%).
Source: Stephens
In other Transportation News
Stability in the airfreight market may be short-lived with outbound China rates rising this month and big high-tech product launches poised to soak up cargo aircraft in several weeks. That could pinch some shippers that currently view air transport as a refuge from unreliable and expensive ocean shipping, freight transportation specialists say. The price of shipping by air has dropped about 70% since the spring when capacity shortages were rampant because of surging medical-supply orders, but have been slowly moving back up according to market watchers and freight transportation companies.
A small dip can be a big win during a pandemic, when global supply chain disruptions have taken huge bites out of volumes at U.S. ports. One bright spot is the Georgia Ports Authority announced last week that fiscal-year volume at the Port of Savannah was down by less than 1% compared to the previous year – not bad folks. The Port of Savannah handled 4.44 million twenty-foot equivalent units in fiscal year 2020, which ended June 30. Container tons grew 2% or 56,440 tons to hit another record with 33.5 million tons. “Cargo volume reductions related to COVID-19 were offset by the strength of our export markets and record volumes earlier in the year,” GPA Executive Director Griff Lynch said.
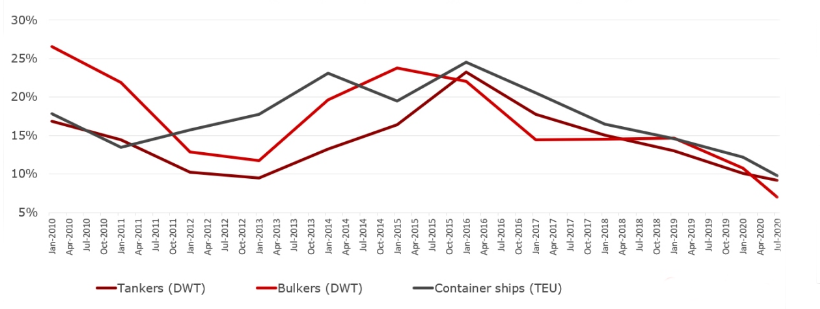
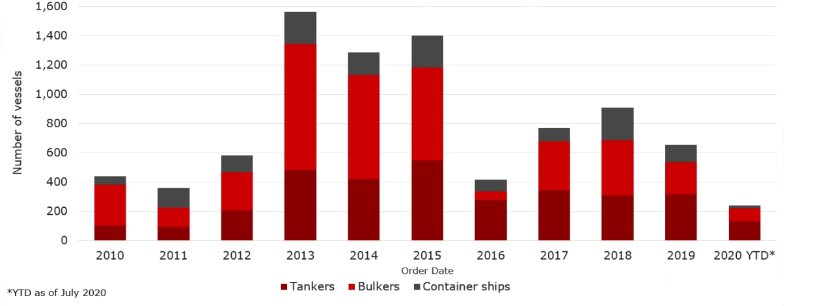
Ship orders collapse; will a rate boom follow? Pre-COVID, the bull case for shipping rates was all about plunging new build orders. A drop in orders in 2019 pointed to rising freight rates in 2021, given the lag between contract signing and delivery. Mid-COVID, the bull case for rates is even more about plunging new build orders than before. There will be a lot fewer vessels on the water in 2021, 2022 and beyond than previously thought. According to Vessels Value, the tanker order book has fallen to 9% of the operating fleet in terms of capacity (measured in deadweight tons or DWT). This could be a long term tail wind for crude by rail if we see less tankers on the Ocean – it could contribute to wider spreads making it attractive to transport crude by rail for some refineries instead of taking in port vessels – see chart(s) below:
Order Book Capacity as a Percentage of Fleet Capacity

New Build Order by Vessel Type

Railcar Markets
PFL is offering: Various tank cars for lease with dirty to dirty service including, nitric acid, gasoline, diesel and crude oil. Lease terms negotiable, short and long term opportunities available. Currently have 4 unit car trains ready to be subleased for 1- 12 months dirty to dirty attractive rates. Other leases on 117Js and 117Rs, dirty to dirty for sublease. Clean cars are available 1-5 years scatted across the country. 61 ft. bulkhead flat cars, lease only. PFL has a number of steel and aluminum hoppers for various commodities and tank cars, all for sale. Additionally sand cars, box cars, coal cars and hoppers including sugar covered and plastic pellet cars, are also available for sale and lease in various locations and terms. Please call PFL today!
PFL is seeking: 40 cars for LPG service needed in Kansas for Oct-Mar service, dirty preferred, clean considered. 200 25.5 cpc 1232 cars for use in Mexico for 1-3 years for heavy fuel oil. 2 Covered hoppers for purchase, 5500 series, for storage at plant site in the Chicago area, BN or NS connection. 25-50 chip gons for lease or sale, UP location preferred. 5-10 syrup cars are needed in the Midwest. Need 100 steel coal gons for sale. Need 10 20K to 23.5 coiled and insulated for one year in ethylene glycol. 10 CPC 1232 or other for industrial alcohol use in Indiana off the NS for 6 months: lessee would take ethanol cars clean then use for industrial alcohol service and deliver the cars back to you with industrial alcohol heals (cars would be accepted with ethanol heels please call to discuss). Please call PFL today!
Call PFL today to discuss your needs and our availability and market reach. Whether you are looking to lease cars, lease out cars, buy cars or sell cars call PFL today 239-390-2885
PFL offers turn-key solutions to maximize your profitability. Our goal is to provide a win/win scenario for all and we can handle virtually all of your railcar needs. Whether it’s loaded storage, empty storage, subleasing or leasing excess cars, filling orders for cars wanted, mobile railcar cleaning, blasting, mobile railcar repair, or scraping at strategic partner sites, PFL will do its best to assist you. We also assist fleets and lessors with leases and sales and offer Total Fleet Evaluation Services.We will analyze your current leases, storage, and company objectives to draw up a plan of action. We will save Lessor and Lessee the headache and aggravation of navigating through this rapidly changing landscape
PFL IS READY TO CLEAN CARS TODAY ON A MOBILE BASIS. WE HAVE JUST COMPLETED A JOB IN EAST TEXAS
Live Railcar Markets
| CAT | Type | Capacity | GRL | QTY | LOC | Class | Prev. Use | Clean | Offer | Note |
|---|
