
“Most of the things worth doing in the world had been declared impossible before they were done.“
– Louis D. Brandeis
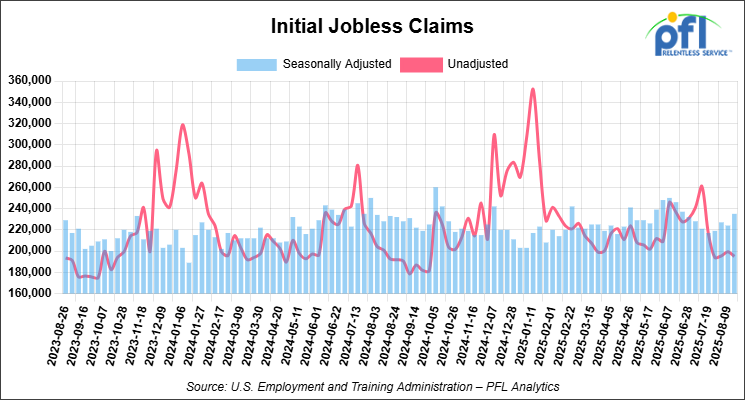
Jobs Update
• Initial jobless claims seasonally adjusted for the week ending August 23, 2025 came in at 235,000, versus the adjusted number of 224,000 people from the week prior, up 11,000 people week over week.
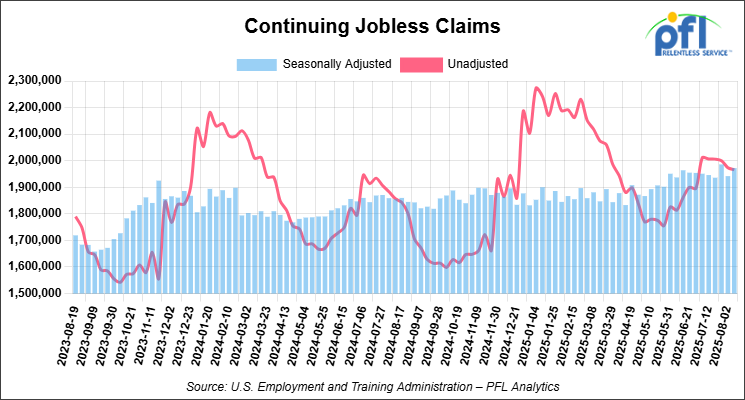
• Continuing jobless claims came in at 1,972,000, versus the adjusted number of 1,942,000 people from the week prior, up 30,000 week-over-week.
Stocks closed higher on Friday of last week and mixed week-over-week
The DOW closed higher on Friday of last week, up 846.24 points (1.89%), closing out the week at 45,631.74, up 685.62 points week-over-week. The S&P 500 closed higher on Friday of last week, up 96.74 points (1.52%), and closed out the week at 6,466.91, up 17.11 points week-over-week. The NASDAQ closed higher on Friday of last week, up 396.22 points (1.88%), and closed out the week at 21,496.53, down -126.45 points week-over-week.
In overnight trading, DOW futures traded lower and are expected to open at 45,608 this morning, down -107 points from Friday’s close.
Crude oil closed higher on Friday of last week and higher week-over-week
West Texas Intermediate (WTI) crude closed up 14 cents per barrel (0.22%), to close at $63.66 on Friday of last week, and up 86 cents week-over-week. Brent crude closed up 6 cents per barrel (0.09%), to close at $67.73, and up $1.88 week-over-week.
One Exchange WCS (Western Canadian Select) for October delivery settled on Friday of last week at US$12.35 below the WTI-CMA (West Texas Intermediate – Calendar Month Average). The implied value was US$50.65 per barrel.
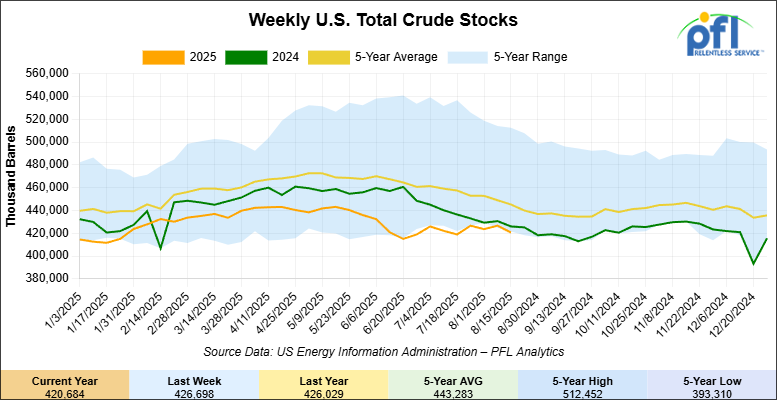
U.S. commercial crude oil inventories (excluding those in the Strategic Petroleum Reserve) decreased by 6 million barrels week-over-week. At 420.7 million barrels, U.S. crude oil inventories are 6% below the five-year average for this time of year.
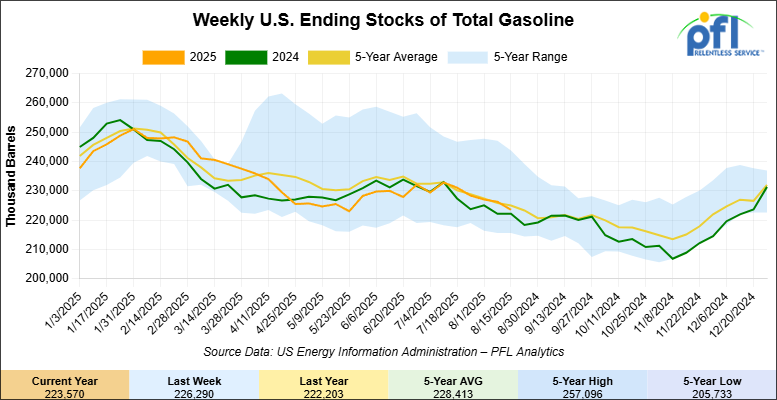
Total motor gasoline inventories decreased by 2.7 million barrels week-over-week and are 1% below the five-year average for this time of year.
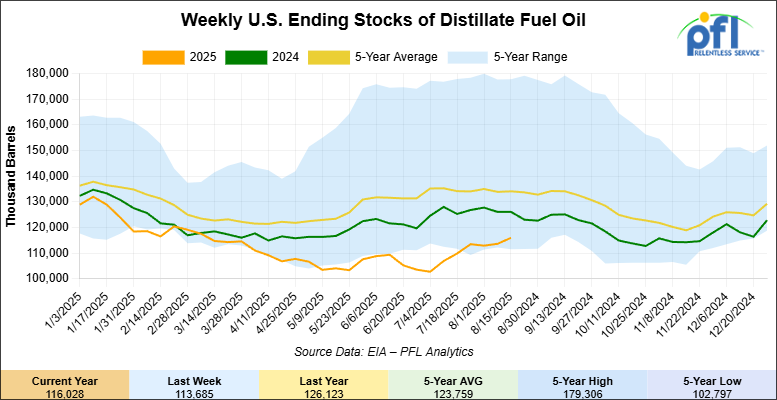
Distillate fuel inventories increased by 2.3 million barrels week-over-week and are 13% below the five-year average for this time of year.
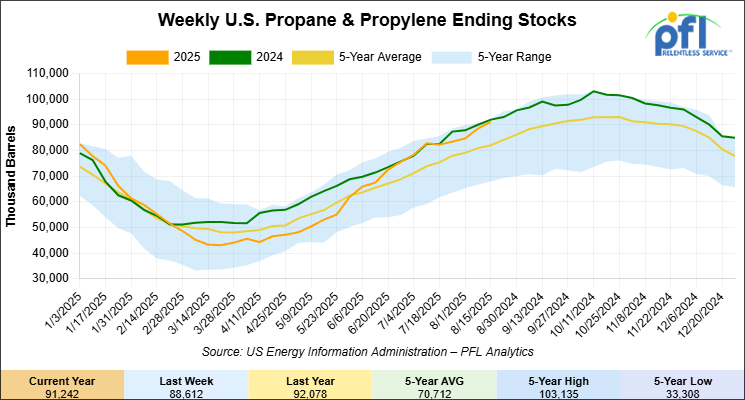
Propane/propylene inventories increased by 2.6 million barrels week-over-week and are 12% above the five-year average for this time of year.
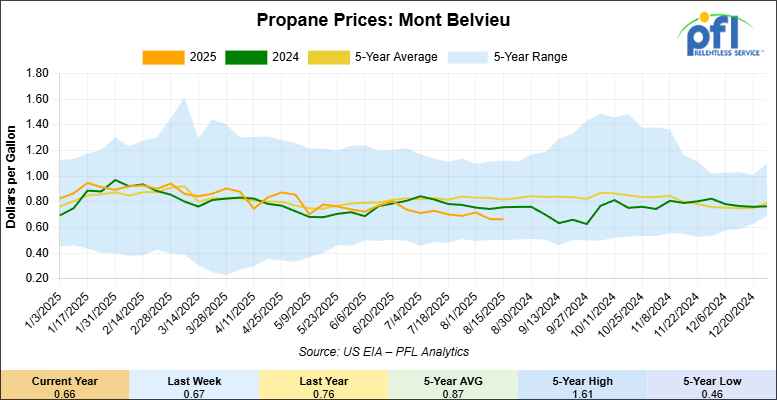
Propane prices closed at 66 cents per gallon on Friday of last week, down 1 cent per gallon week-over-week and down 10 cents year-over-year.
Overall, total commercial petroleum inventories decreased by 4.2 million barrels during the week ending August 15, 2025.
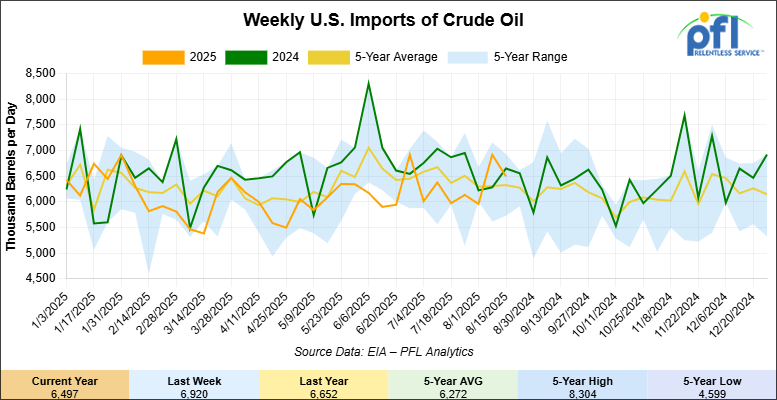
U.S. crude oil imports averaged 6.5 million barrels per day during the week ending August 15, 2025, a decrease of 423,000 barrels per day week-over-week. Over the past four weeks, crude oil imports averaged 6.4 million barrels per day, 2.3% less than the same four-week period last year. Total motor gasoline imports (including both finished gasoline and gasoline blending components) averaged 655,000 barrels per day, and distillate fuel imports averaged 124,000 barrels per day during the week ending August 15, 2025.
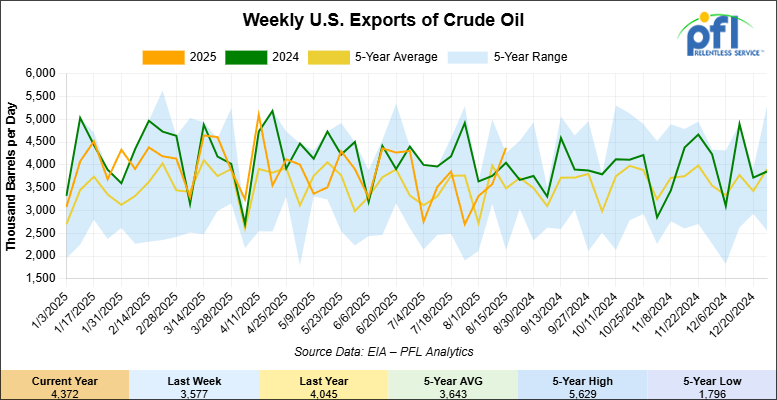
U.S. crude oil exports averaged 4.372 million barrels per day during the week ending August 15, 2025, an increase of 795,000 barrels per day week-over-week. Over the past four weeks, crude oil exports averaged 3.491 million barrels per day.
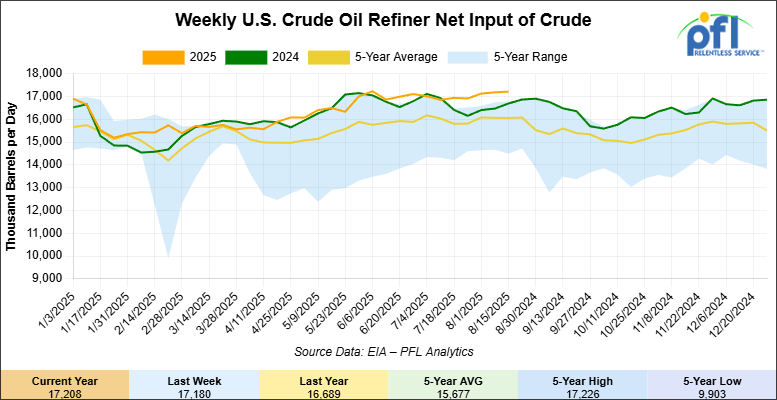
U.S. crude oil refinery inputs averaged 17.2 million barrels per day during the week ending August 15, 2025, which was 28,000 barrels per day more week-over-week.
WTI is poised to open at $64.08, up 42 cents per barrel from Friday’s close.
North American Rail Traffic
Week Ending August 20, 2025:
Total North American weekly rail volumes were down (1.74%) in week 34, compared with the same week last year. Total carloads for the week ending August 20 were 323,051, down (-1.59%) compared with the same week in 2024, while weekly intermodal volume was 346,195, down (-1.59%) year over year.
8 of the AAR’s 11 major traffic categories posted year-over-year decreases. The largest decrease came from Forest Products (-15.62%), while the largest increase was Coal (+7.88%).
In the East, CSX’s total volumes were down (-1.89%), with the largest decrease coming from Grain (-23.5%), while the largest increase came from Motor Vehicles and Parts (+7.59%). NS’s volumes were down (-0.98%), with the largest increase coming from Petroleum & Petroleum Products (+25.3%), while the largest decrease came from Grain (-31.48%).
In the West, BNSF’s total volumes were up (+0.96%), with the largest increase coming from Grain (+14.08%), while the largest decrease came from Coal (-20.08%). UP’s total rail volumes were down (-0.78%), with the largest increase coming from Coal (+24.92%), while the largest decrease came from Other (-8.92%).
In Canada, CN’s total rail volumes were down (-2.15%), with the largest increase coming from Grain (+59.21%), while the largest decrease came from Coal (-20.08%). CPKCS’s rail volumes were down (-20.97%), with the largest increase coming from Coal (+13.42%), while the largest decrease came from Forest Products (-67.46%).
Source Data: AAR – PFL Analytics
Rig Count
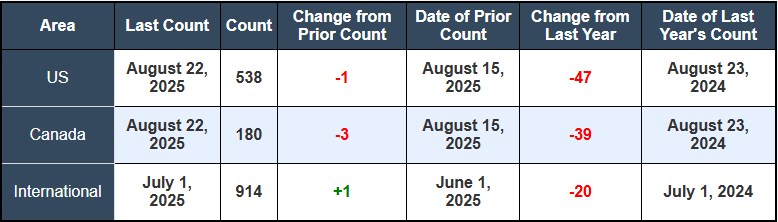
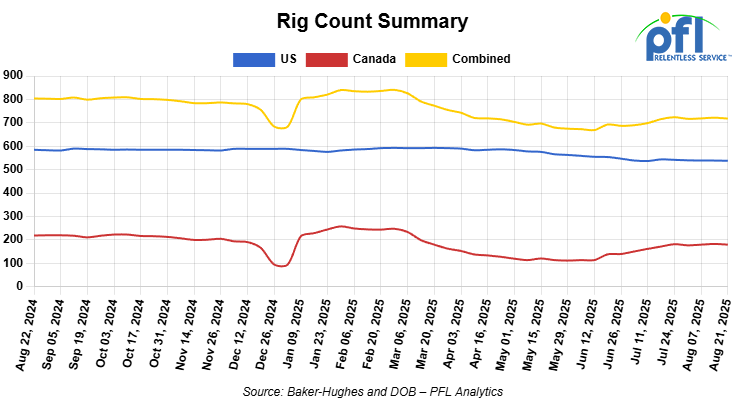
North American rig count was down by 4 rigs week-over-week. The US rig count was down by -1 rig week-over-week, and down by -47 rigs year-over-year. The US currently has 538 active rigs. Canada’s rig count was down by -3 rigs week-over-week and down by -39 rigs year-over-year. Canada currently has 180 active rigs. Overall, year-over-year we are down by -86 rigs collectively.
North American Rig Count Summary
We are watching a few things out there for you:
We are watching Petroleum Carloads
The four-week rolling average of petroleum carloads carried on the six largest North American railroads dropped to 27,787 from 27,841 which was a decrease of -54 rail cars week-over-week. Canadian volumes were mixed. CPKC’s shipments were lower by -1.0% week over week, CN’s volumes were higher by +7.0% week-over-week. U.S. shipments were mostly higher. BN had the largest percentage increase and was up by +17.0%. The CSX was the sole decliner and was down by -2%.
We are watching Renewables
Mid-day on Friday of last week, U.S. Environmental Protection Agency (EPA) in a press release announced that it is acting on a backlog of 175 Small Refinery Exemption (SRE) petitions from 38 small refineries for 2016 – 2024 compliance years. In consultation with the U.S. Department of Energy (DOE), the EPA reviewed and considered information submitted by each petitioning small refinery. The EPA said it then evaluated each SRE petition consistent with the Clean Air Act and case law and after carefully reviewing all information, the EPA is granting full exemptions to 63 petitions, granting partial exemptions to 77 petitions, denying 28 petitions, and determining 7 petitions to be ineligible.
The EPA said it is reaffirming the policy that it set in the first Trump Administration through the 2020 Renewable Volume Obligation Rulemaking, granting partial relief (a 50% exemption) where a small refinery has demonstrated that it faces partial hardship. Under DOE’s 2011 Small Refinery Study, small refineries would have been denied any relief despite demonstrating partial hardship. With Friday’s action, the EPA said it is getting the SRE program back on track with an approach that recognizes some small refineries are impacted more significantly than others and that EPA’s relief should reflect those differences. Concurrently with this decision, the EPA said it will update the Renewable Fuel Standard (RFS) Small Refinery Exemption website to reflect action on the 175 petitions.
At the same time, the EPA said it is reaffirming a policy to return RFS compliance credits, known as Renewable Identification Numbers (RINs), previously retired for compliance when a small refinery receives an exemption for a prior compliance year. Under the RFS program, RINs have a two-year window for use, covering the compliance year in which they were generated and the following compliance year. Therefore, while 2022 and earlier vintage RINs are not eligible for use to meet the open 2024 compliance obligations or future obligations, these vintage RINs can be used to demonstrate compliance for prior compliance years consistent with their two-year window. Ultimately, this means that the 2022 and earlier vintage RINs will not impact the number of RINs available to meet 2024 and future compliance obligations and are not expected to impact demand for biofuels.
Finally, soon, the EPA said it will submit a draft supplemental proposed rule to the Office of Management and Budget (OMB) on the proposed reallocations of the 2023 and later compliance year exempted volumes. The EPA said it does not plan to propose reallocation of any of the exempted volumes for any SREs from 2016 – 2022 in light of the limitation on their potential use. The EPA said it will also be providing updated information on how the agency intends to project SREs for 2026 and 2027 in the context of establishing percentage standards for those years. The proposed adjustments will help ensure that refineries blend the intended volumes of renewable fuel into the nation’s fuel supply in 2026 and 2027 after accounting for the SREs granted for 2023 and 2024 in today’s actions and projected SREs granted for 2025 – 2027 in Set 2. The supplemental proposal will seek to balance the goals of the RFS in supporting the production and use of renewable fuels while taking into account economic impacts, following the law, and ensuring opportunity for stakeholder comment.
Please see EPA’s Renewable Fuel Standard program website for more information.
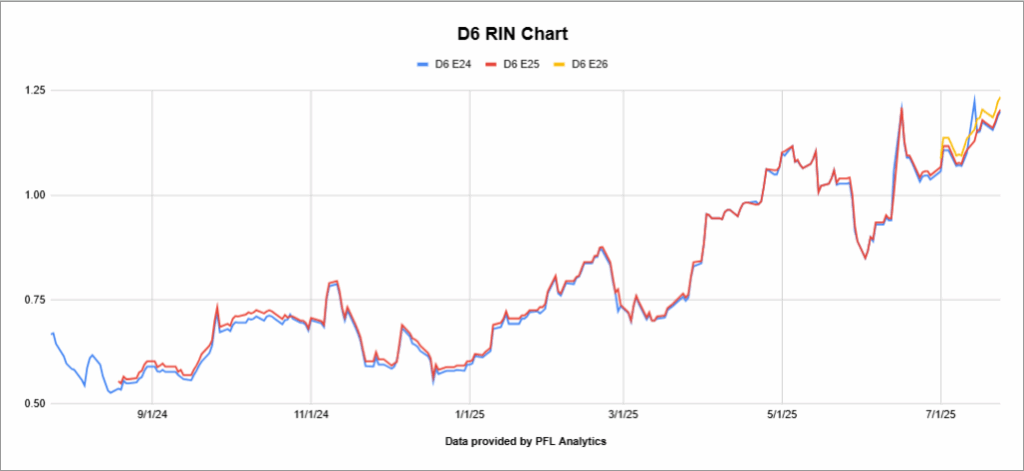
Prior to the announcement by the EPA on Friday of last week 2025 D6 (Ethanol) RINS traded below $1.00 per RIN on Wednesday of last week hitting a high of $1.21 per RIN midday after the announcement by the EPA before settling at $1.08 and ½ of a cent per RIN week.
D6 RINS have been on a tear in 2025, and liquidity has increased substantially since the beginning of the year. On January 3, 2025, 2025 D6 RINS closed at 62 cents per RIN that is up 46 and ½ cents per RIN since the beginning of the year. See Chart below:
The same can be said for 2025 D4 (Biodiesel) RINS 2025 D4 RIN’S On January 3, 2025 closed at 64 and ½ of a cent per RIN and on Friday of last week 2025 D4 RINS closed $1.13 and ½ of a cent per RIN, that is up 49 cents per RIN since the beginning of the year. See Chart below:

For our readers that like trading or watching the D4/D6 spread that has been widening – especially out in 2026. See chart below:

Meanwhile, 2025 D3 RINS (Advanced Biofuels) on January 3 closed out the day at $2.37 and ½ of a cent per RIN and on Friday of last week 2025 D3 RINS closed $2.17 and ½ of a cent per RIN, down 20 cents per RIN since the beginning of the year. See Chart below:

What does all this mean? Higher RIN prices are good for farmers – the higher the RIN price the more demand for crops as it incentives obligated parties to purchase more renewable fuels to blend in conventional or fossil fuels. More grain being produced is good for rail. Higher RIN prices are also good for Ethanol and Biodiesel producers also good for rail. Higher RIN prices are bad for obligated parties (Refiners), they must either pay for RINS, or they have to blend more ethanol in gasoline, blend more biodiesel in diesel or produce renewable diesel out of vegetable oil, used cooking oil, tallow etc. There are added incentives to do this in California (LCFS credit), Oregon (CFP credit), Washington State (CFS Credit) and British Columbia (Canada). See chart below (note British Columbia Credits are not covered by PFL):

In these left-wing States, in addition to paying for RINS if they do not blend enough, an obligated party either has to produce and/or blend renewable content, or pay the respective State if they don’t. It is there to encourage the obligated party to have more renewable content in the fuel that it sells and it is working. As previously reported by PFL, both Valero and Phillips are shuttering California refineries and repurposing them into renewable diesel facilities. How does Valero and Phillips benefit from this if at all? It reduces their obligation to buy, reducing their obligation as polluters at the same time and gives them LCFS credits a double whammy so to speak. It is semi-good news for rail – new domestic content rules by the Trump Administration will increase rail demand for more feedstock to feed the new biorefineries. The bad news for rail is that it will reduce demand for rail cars to ship gasoline and diesel and other products that refineries produce, as it is not an apple-to-apple comparison. The bad news for the American consumer is we are going to have less refining capacity particularly in California. California will be short refined products and will have to have products shipped in to meet California demand. If we are going to be energy independent, we need more refineries, not less. Stay tuned to PFL we are watching this one closely and we will see how it all shakes out.
PFL is watching Canada
A lot is going on up there, folks:
Left-wing Canadian Prime Minister Mark Carney
Mark Carney does not seem to be in a hurry to do anything productive for Canada instead, we hear what he is going to do. Canada needs more pipe in the ground now, needs to build mines, needs to tear down inter-Provincial tariffs. He has promised to cut down on the review of new projects to two years instead of 4-10 years. There are projects shovel-ready now that have been held up in regulator review and lawsuits by activists, but people don’t want to build them because Canada’s version of the “Green New Deal” is still in place and the federal government is at war with their own producers. You know what they say – “Never bite the hand that feeds you.” We don’t think Carney heard that one.
Last week, two of Canada’s largest energy companies and significant rail shippers, Enbridge Inc. and Cenovus Energy Inc., were targeted by a complaint filed with the Alberta Securities Commission (ASC). A shareholder advocacy group is alleging the companies have engaged in “greenwashing” by making misleading disclosures about their “net-zero” emissions plans.
In Mark Carney’s prior life, he often championed this type of behavior through his roles at Brookfield and the Glasgow Financial Alliance for Net Zero (GFANZ), and is facing increased scrutiny.
Critics in the energy sector are quick to highlight what they see as a fundamental hypocrisy: financial institutions demanding aggressive climate targets from producers while their own investment funds remain heavily exposed to traditional energy assets.
In other Carney news, in a significant strategic shift, Prime Minister Mark Carney’s government announced on Friday of last week, a plan to de-escalate the protracted trade dispute with the United States. The move, which followed a direct conversation between Carney and U.S. President Donald Trump, signals a pivot from broad-based retaliation toward a more targeted defense of key Canadian industries. This decision marks a departure from the confrontational “elbows up” rhetoric that characterized Carney’s election campaign, reflecting a pragmatic calculation of the economic realities of managing the relationship with Canada’s largest trading partner. The government is positioning the policy change as a necessary step to preserve the foundational Canada-U.S.-Mexico Agreement (CUSMA/USMCA) ahead of its scheduled 2026 review.
The core of the announcement is a carefully delineated rollback of retaliatory measures. Effective September 1, 2025, Canada will eliminate its counter-tariffs on all U.S. goods that are compliant with CUSMA. Ottawa has framed this as a reciprocal action, “matching” the U.S. administration’s decision to exempt CUSMA-compliant Canadian goods from its own sweeping tariffs. However, the de-escalation is not absolute. Canada will strategically retain its retaliatory tariffs on U.S. steel, aluminum, and automobiles, indicating a deliberate choice to shield specific, historically vulnerable sectors while easing the broader economic friction.
The reaction from Canadian and U.S. stakeholders was immediate and deeply divided. Business groups and importers expressed significant relief, anticipating that consumers will benefit from lower prices on a wide range of American goods. In contrast, Canadian labor unions described the decision as “capitulation,” arguing that it weakens Canada’s bargaining position without securing any concessions in return. This calculated concession appears to be a pre-emptive diplomatic maneuver designed to reframe the narrative ahead of the 2026 CUSMA review. By unilaterally removing its retaliatory tariffs, Canada (or Carney) believes it positions itself as the defender of the existing agreement, shifting the political burden onto the U.S. and making it more difficult for Washington to be the aggressor when the deal comes up for formal review.
Bottom line is, Carney does not know how to negotiate or how to run a country. There are many natural resources in Canada ready to exploit – he needs to drop the green new deal – give the go ahead for new projects as Canadians continue to lose jobs he needs to save them and unleash Canada’s private sector while there is still one or he needs to step down – it is that simple. Canadian politics are complicated. There are a bunch of parties that form the government, but if a few of the parties got together and called a no confidence vote that may be what needs to be done. He has no cards except to diversify Canada’s markets and he needs to do it now.
Cenovus Bid for MEG Energy
The Canadian oil patch consolidation trend continues to accelerate, with Cenovus Energy Inc. announcing a definitive agreement last week to acquire MEG Energy Corp. in a cash-and-stock deal valued at approximately C$7.9 billion, inclusive of assumed debt. This move effectively concludes a strategic review initiated by MEG after it rebuffed an unsolicited offer from Strathcona Resources Ltd. back in June.
The deal solidifies Cenovus’s position as a dominant force in the oil sands, particularly in Steam-Assisted Gravity Drainage (SAGD) operations. The combination of the two producers is set to create an entity with oil sands production exceeding 720,000 barrels per day (bbls/d). With MEG folded in, Cenovus is expected to surge toward nearly 900,000 boe/d immediately, with ambitions to grow to about 950,000 boe/d by 2028. The true prize in this acquisition appears to be the consolidation of adjacent and highly complementary assets at Christina Lake. Cenovus CEO Jon McKenzie highlighted the strategic fit, stating, “This transaction represents a unique opportunity to acquire approximately 110,000 barrels per day of production within some of the highest quality, longest-life oil sands resource in the basin, which sits directly adjacent to our core Christina Lake asset.”
Cenovus is projecting significant operational efficiencies and cost savings from the merger. The company expects to realize approximately C$150 million in near-term annual synergies, with that figure growing to over C$400 million per year by 2028 and beyond. These synergies are expected to come from corporate overhead, commercial optimizations, and integrated development across the now-contiguous Christina Lake region.
What does this mean for the Rail Sector? While major pipeline projects handle the bulk of egress, the creation of such a large, integrated producer has direct implications for the rail industry.
1. Consolidated Logistics and Negotiating Power: The new, larger Cenovus will merge two separate logistics and transportation departments. This will lead to a complete re-evaluation of their transportation network, including rail contracts, terminal usage, and storage. A single, more powerful entity will have greater leverage in negotiating rates and services with railways and service providers.
2. Operational Synergies Extend to Transport: The “synergies” mentioned are not just about drilling and production. A streamlined Cenovus will look to optimize every aspect of its supply chain. This could mean consolidating crude-by-rail (CBR) loading points, favoring certain destinations or routes for efficiency, and creating larger, more consistent batch shipments that are more attractive for rail transport.
3. Increased Production: Ultimately, the goal of this merger is to produce more oil more efficiently. As the combined entity ramps up production and optimizes its Christina Lake assets, the incremental barrels will need a path to market. This enhances the underlying demand for all forms of transport, including rail, which provides crucial flexibility to reach niche markets and bypass pipeline bottlenecks. However, rail will be basis dependent and fixed price dependent. With Canadian production roaring back after a summer of wild fires and plant turnarounds, pipelines are going to get full quickly with the implied value for October delivery of $50 U.S. per barrel for WCS (Edmonton) and more production for heavy crude coming online from OPEC countries and Chevron now bringing Venezuelan crude back to the U.S. (first ship to land on Thursday) we expect unless there is an all out war for fixed price to fall and basis to widen from current levels. As a rule of thumb, Canadian heavy producers break even is somewhere around C$45 per barrel.
We will be watching this closely as the deal moves toward – its expected close in the fourth quarter of 2025. Stay tuned to PFL.
PFL is Watching Infrastructure Investment and Equipment Orders
CN Rail outlined its comprehensive 2025 capital spending plan totalling C$3.4 billion ($2.4 billion USD), representing one of the largest infrastructure investments in the railroad’s history. The program allocates C$2.9 billion for track, signals, and bridge improvements, with an additional C$500 million dedicated to rolling stock acquisitions and locomotive rebuilds.
● Key infrastructure projects include mainline capacity expansion in Western Canada, terminal improvements in Vancouver and Montreal, and significant investment in automated systems and precision railroading technology. The spending represents approximately 19% of CN’s expected 2025 revenue, well above the industry average of 15-17%.
CN emphasized that the capital program supports long-term growth while maintaining operational flexibility during current trade uncertainties. Priority projects include double-tracking critical bottlenecks and expanding intermodal terminal capacity to handle anticipated volume growth from the CSX-BNSF partnership and other competitive responses.
Equipment Orders Surge Amid Steel Price Pressures
FreightCar America received 1,250 railcar orders worth $141 million in Q1 2025, capturing 25% of total industry orders and marking their largest order intake in 15 years. The orders included tank cars, covered hoppers, and automotive carriers, reflecting diverse demand across commodity segments.
Total industry Q1 2025 orders of only 5,085 units represented a significant decline from historical norms, indicating broader market weakness. Railcar manufacturers are struggling with steel cost inflation, as hot rolled coil prices jumped to $945 per ton from $700 in November 2024, while plate steel exceeded $1,000 per ton due to tariff impacts.
Trinity Industries reported disappointing Q2 results with new orders of only 2,310 units, though its railcar leasing segment maintained 96.8% fleet utilization. The company’s backlog fell to $2.0 billion, down from peak levels earlier in the year, reflecting customer caution amid economic uncertainty.
Leasing Market Dynamics
The railcar leasing sector continues showing strong fundamentals with utilization rates above 96% across major lessors. Greenbrier has maintained a 98% lease fleet utilization rate with strong demand for tank cars and covered hoppers. These high utilization rates have continued to support lease rate increases, benefiting both lessors and manufacturers but hurting shippers as margins are getting squeezed. Ultimately end users are going to pay – we don’t see inflation going away anytime soon!
Industry consolidation has accelerated – Tealinc-Midwest Railcar merger is a recent example of this, smaller lessors are seeking scale to compete effectively. The consolidation trend reflects pressure on independent operators from rising acquisition costs and the need for larger fleets to serve railroad customers efficiently.
Capital Allocation Priorities
Class I railroads are prioritizing infrastructure investments over equipment purchases, reflecting their focus on operational efficiency and service reliability. This strategy shifts equipment financing burden to leasing companies and private car owners, supporting the strong leasing market dynamics observed across the sector.
The emphasis on infrastructure spending also reflects lessons learned from recent service disruptions and the recognition that network capacity constraints limit revenue growth potential. Railroads are essentially “buying” capacity through capital investment rather than expanding equipment fleets.
We are Watching the Industrial Head Count
Class I railroads employed 118,965 workers in the United States in July 2025, a -0.31% decrease from June 2025’s count of 119,339 and a -2.24% year-over-year decrease from July 2024’s total of 121,697, according to Surface Transportation Board data.


Two of the six employment categories posted month-over-month increases between June and July. These were Executives, officials, and staff assistants, which rose +0.46% to 8,001 workers, and Professional and administrative, which increased +0.88% to 9,302 workers.
The categories that posted month-over-month decreases were Maintenance of way and structures, down -0.04% to 29,077 workers, Maintenance of equipment and stores, down -0.29% to 17,014 workers, Transportation (other than train and engine), down -0.40% to 4,959 workers, and Transportation (train and engine), down -0.81% to 50,612 workers.
Year over year, two categories posted an employment gain, which were Executives, officials, and staff assistants up +0.93% and Maintenance of way and structures up +0.26%.
Categories that registered year-over-year decreases in July were Professional and administrative down -6.15%; Maintenance of equipment and stores down -2.69%; Transportation (other than train and engine) down -1.41%; and Transportation (train and engine) down -3.31%.
We are watching Key Economic Indicators
Industrial Output & Capacity Utilization
Manufacturing accounts for roughly 75% of total industrial output. In July, manufacturing output was flat (0.0% m/m) after a +0.3% gain in June and is +1.4% y/y. Total capacity utilization slipped to 77.5% from 77.7% (still 2.1 pp below its long-run average). Manufacturing capacity utilization edged down to 76.8% from 76.9%, underscoring persistent slack even as headline output stabilizes.

Lease Bids
- 30-50, 6000cf Steel Hopper located off of CSX or NS in East. For use in petcoke service. Period: 5 Years.
- 50, 5000CF Covered Hopper located off of UP or BN in Houston. For use in Fertilizer service. Period: 6 Months. Bid: Negotiable.Needed ASAP.
- 10, 2500CF Open Top Hopper located off of UP or BN in Texas. For use in aggregate service. Period: 5 years. Bid: Negotiable.Need Rapid Discharge Doors.
- 20, 25.5k CPC 1232 Tank located off of UP, BN, CSX, NS in OK, TX, Northeast. For use in Asphalt service. Period: 3 Years. Bid: Negotiable.
- 10, 25.5K Any Type Tank located off of CSX in Florida. For use in UCO service. Period: 2 Years. Bid: Negotiable.
- 20, 28.3K 117J Tank located off of BN in Montana. For use in Crude service. Period: 2 years. Bid: Negotiable.
- 15-20, 29K 117R Tank located off of NS or CSX in Ohio. For use in Ply Oil service. Period: 6-12 Months. Bid: Negotiable.
- 10, 30K 117R or 117J Tank located off of Any Class 1 in USA. For use in Glycerin service. Period: 1 year. Bid: Negotiable.
- 50, 23.5-25.5 DOT111 Tank located off of Any Class 1 in USA. For use in Asphalt service. Period: 5 years. Bid: Negotiable.
- 50-100, 33K 117J Tank located off of BN or UP in Bellview. For use in Butane/ service. Period: Sept-March. Bid: Negotiable.
- 4, 30K 117J Tank located off of in Michigan. For use in Food Grade Ethanol service. Period: Multi year. Bid: Negotiable.
- 10-20, 29K CPC 1232 Tank located off of CP in Washington, Iowa. For use in Biodiesel service. Period: 1 Year min. Bid: Negotiable.
- 50, 33K 117J Tank located off of CP or CN in Canada. For use in Propane service. Period: Summer. Bid: Negotiable.
- 6, 4750 Covered Hopper located off of NS in Georgia. For use in Fertilizer service. Period: 3-5 years. Bid: Negotiable.
- 100, 21.9K 117J Tank located off of All Class 1s in Midwest. For use in CO2 service. Period: 6 months. Bid: Negotiable.
Sales Bids
- 28, 3400CF Covered Hopper located off of UP BN in Texas. For use in Cement service. Bid: Negotiable.Cement Gates needed..
- 20, 17K Tank DOT111 located off of various class 1s in various locations. For use in corn syrup service. Bid: Negotiable.
- 120, Various Gondola Open-Top Aluminum Rotary located off of various class 1s in various locations. For use in Sulphur service. Bid: Negotiable.Built 2004 or later.
Lease Offers
- 60, 4750 Covered Hoppers located off of UP or BN in Eads, CO. Last used in Grain. Offer: Negotiable. UP to 5 Years, 3 Hopper, Gravity Gate, Trough Hatches.
- 100, 6250 Covered Hoppers located off of UP in US. Last used in DDG. Offer: Negotiable. 1 Year term. Dirty to Dirty. Free move on UP..
- 24, 25.5K-30K DOT111 Tanks located off of UP or BN in Texas. Last used in Base Oils. Offer: Negotiable. 1-2 Year.
- 25, 19.6K DOT111 Tanks located off of UP in US. Last used in Molases. Offer: Negotiable.
- 50, 20K DOT111 Tanks located off of UP or BN in Wichita Falls, TX. Last used in HCL. Offer: Negotiable.
- 50, 30K 117R Tanks located off of CSX, NS, or CN in Detroit. Last used in Diesel. Offer: Negotiable. Multiyear.
- 50, 20K 117J Tanks located off of All Class 1s in Multiple Locations. Last used in Styrene. Offer: Negotiable. Cars are currently moving.
- 22, 25.5K Tanks DOT111 located off of UP in Texas. Last used in Asphalt. Offer: Negotiable.
Sales Offers
- 21, 50′ Boxcar Plate Cs located off of various class 1s in NM. Offer: Negotiable. End of Life.
- 3, 50′ Boxcar Plate Cs located off of various class 1s in multiple locations. Offer: Negotiable. End of Life.
- 27, 50′ Boxcar Plate Cs located off of various class 1s in PQ. Offer: Negotiable. End of Life.
- 100, 3250 Covered Hoppers located off of various class 1s in multiple locations. Offer: Negotiable. Sand Cars.
- 5, 2740 Mill Gondolas located off of various class 1s in NC. Offer: Negotiable. End of Life.
- 1, 2260 Mill Gondolas located off of various class 1s in AL. Offer: Negotiable. End of Life.
- 30, 2740 Mill Gondolas located off of various class 1s in multiple locations. Offer: Negotiable. End of Life.
- 21, 2740 Mill Gondolas located off of various class 1s in WA. Offer: Negotiable. End of Life.
- 9, 4750 Covered Hoppers located off of various class 1s in multiple locations. Offer: Negotiable. End of Life.
- 5, 4750 Covered Hoppers located off of various class 1s in multiple locations. Offer: Negotiable. End of Life.
- 50, 31.8K Tank CPC 1232s located off of UP or BN in TX. Offer: Negotiable. Requal Due in 2025.
Call PFL today to discuss your needs and our availability and market reach. Whether you are looking to lease cars, lease out cars, buy cars, or sell cars call PFL today at 239-390-2885
Live Railcar Markets
| CAT | Type | Capacity | GRL | QTY | LOC | Class | Prev. Use | Offer | Note |
|---|
PFL will be at the Following Conferences

- Where: La Quinta, CA
- Attending: David Cohen (954-729-4774)
- Conference Website

- Where: Hyatt Regency Dallas in Dallas, TX
- Attending:Curtis Chandler (239.405.3365), David Cohen (954-729-4774), Brian Baker (239.297.4519), Cyndi Popov(403) 402-5043
- Conference Website