
“All human wisdom is summed up in two words; wait and hope.”
– Alexandre Dumas
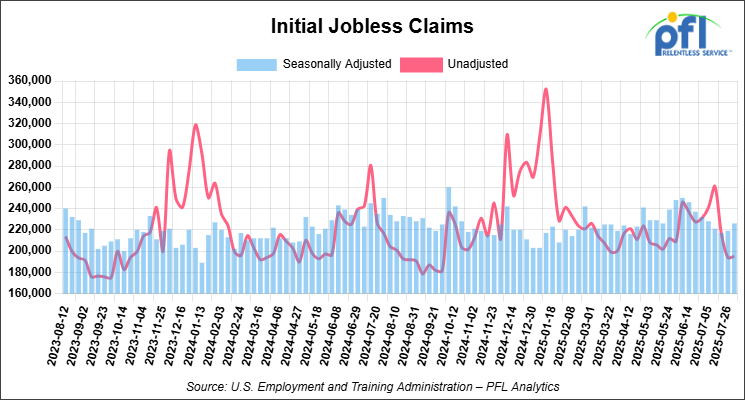
Jobs Update
• Initial jobless claims seasonally adjusted for the week ending August 2, 2025, came in at 226,000, up 7,000 people week over week.
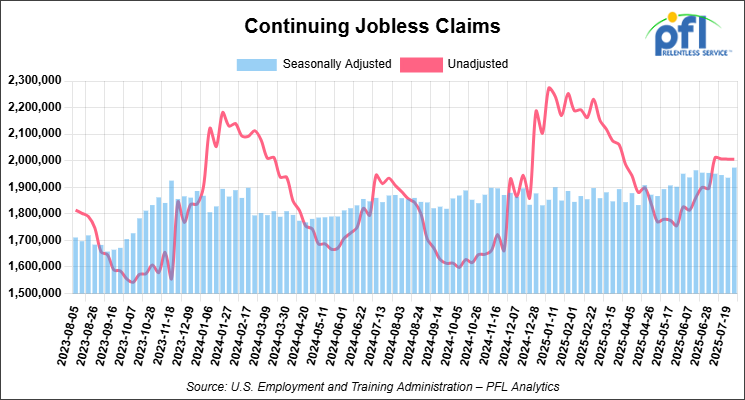
• Continuing jobless claims came in at 1,974,000, versus the adjusted number of 1,936,000 people from the week prior, up 38,000 week-over-week.
Stocks closed higher on Friday of last week and higher week-over-week
The DOW closed higher on Friday of last week, up 206.97 points (0.47%), closing out the week at 44,175.61, up 587.03 points week-over-week. The S&P 500 closed higher on Friday of last week, up 49.45 points (0.78%), and closed out the week at 6,389.45, up 151.44 points week-over-week. The NASDAQ closed higher on Friday of last week, up 207.32 points (0.98%), and closed out the week at 21,450.02, up 799.89 points week-over-week.
In overnight trading, DOW futures traded higher and are expected to open at 44,369 this morning, up 91 points.
Crude oil closed higher on Friday of last week, but lower week-over-week
West Texas Intermediate (WTI) crude closed at $63.88 on Friday of last week, down $3.45 week-over-week. Brent crude closed up $0.16 per barrel (0.2%), to close at $66.59, but down $3.08 week-over-week.
One Exchange WCS (Western Canadian Select) for September delivery settled on Friday of last week at US$12.05 below the WTI-CMA (West Texas Intermediate – Calendar Month Average). The implied value was US$50.81 per barrel.
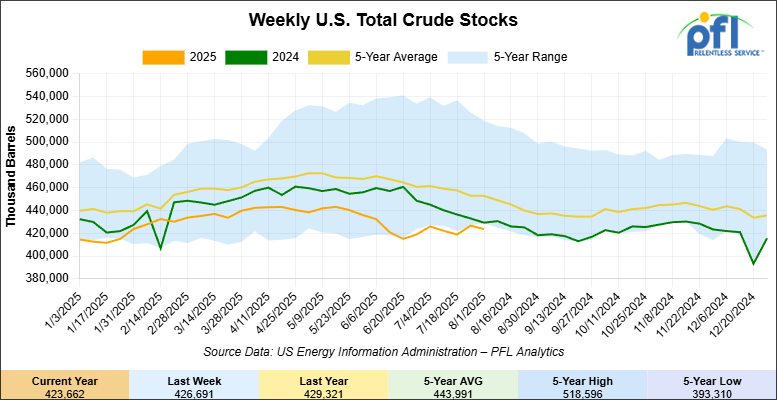
U.S. commercial crude oil inventories (excluding those in the Strategic Petroleum Reserve), decreased by 3 million barrels week-over-week. At 423.7 million barrels, U.S. crude oil inventories are 6% below the five-year average for this time of year.
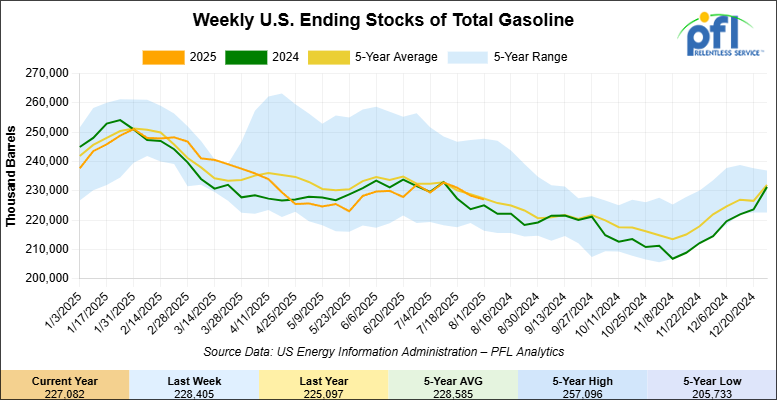
Total motor gasoline inventories decreased by 1.3 million barrels week-over-week and are 1% below the five-year average for this time of year.
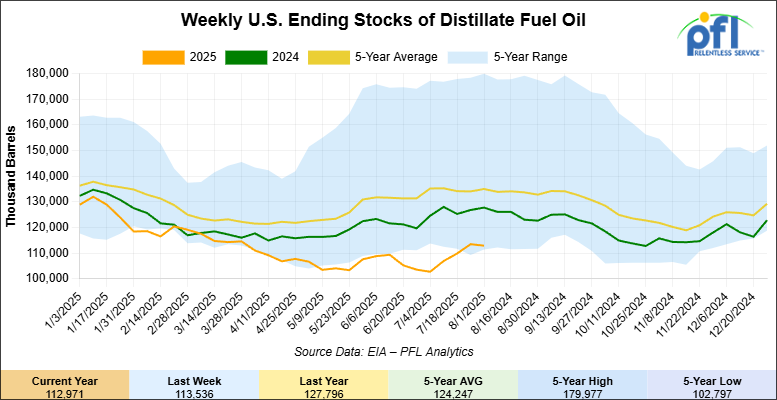
Distillate fuel inventories decreased by 600,000 barrels week-over-week and are 16% below the five-year average for this time of year.
Propane/propylene inventories increased by 1.3 million barrels week-over-week and are 8% above the five-year average for this time of year.
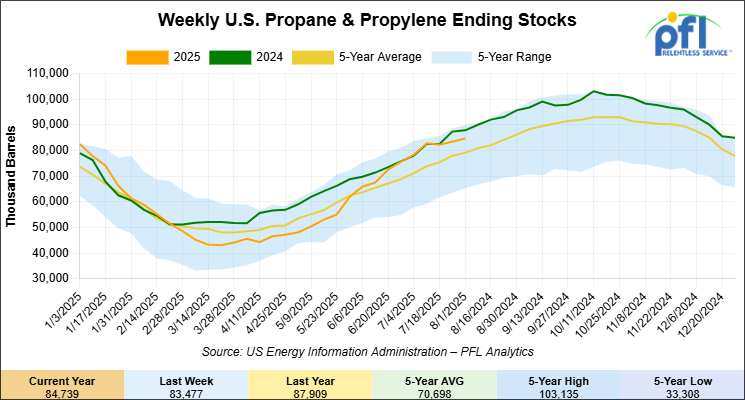
Propane prices closed at 72 cents per gallon on Friday of last week, up 3 cents per gallon week-over-week, and down 6 cents year-over-year.

Overall, total commercial petroleum inventories increased by 2.1 million barrels during the week ending August 1, 2025.
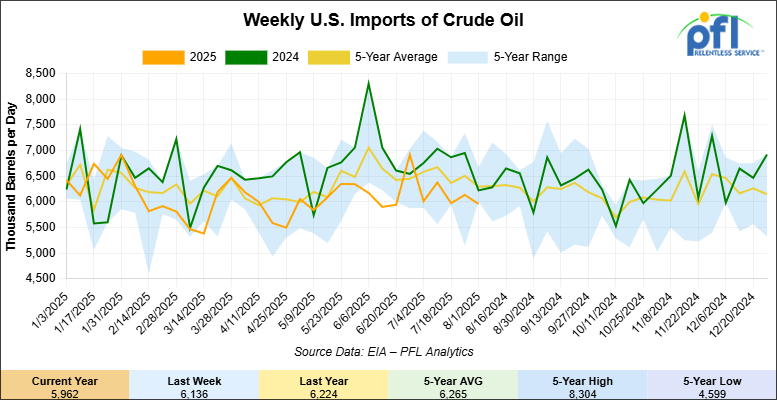
U.S. crude oil imports averaged 6 million barrels per day during the week ending August 1, 2025, a decrease of 174,000 barrels per day week-over-week. Over the past four weeks, crude oil imports averaged 6.1 million barrels per day, 9.7% less than the same four-week period last year. Total motor gasoline imports (including both finished gasoline and gasoline blending components) averaged 535,000 barrels per day, and distillate fuel imports averaged 79,000 barrels per day during the week ending August 1, 2025.
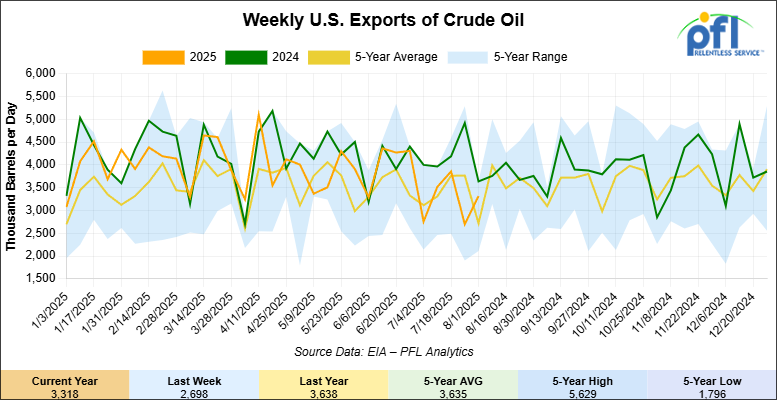
U.S. crude oil exports averaged 3.318 million barrels per day during the week ending August 1, 2025, an increase of 620 thousand barrels per day week-over-week. Over the past four weeks, crude oil exports averaged 3.347 million barrels per day.
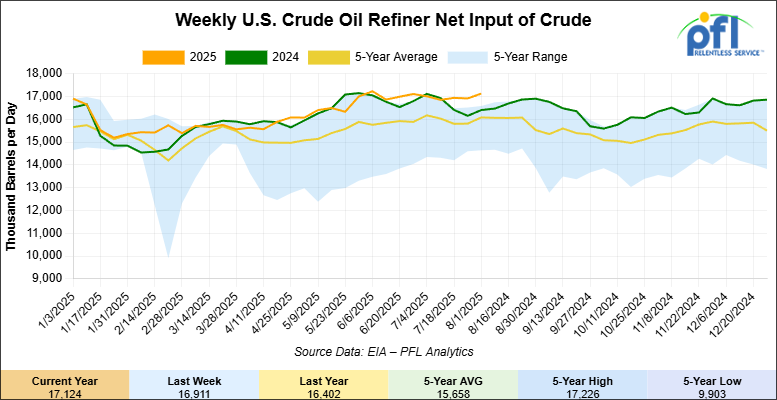
U.S. crude oil refinery inputs averaged 17.1 million barrels per day during the week ending August 1, 2025, which was 213,000 barrels per day more week-over-week.
WTI is poised to open at $63.95, up 7 cents per barrel from Friday’s close.
North American Rail Traffic
Week Ending August 6, 2025:
Total North American weekly rail volumes were up (0.18%) in week 32, compared with the same week last year. Total carloads for the week ending on August 6 were 328,147, up (0.74%) compared with the same week in 2024, while weekly intermodal volume was 339,937, down (0.35%) compared to the same week in 2024.
6 of the AAR’s 11 major traffic categories posted year-over-year decreases. The largest decrease came from Metallic Ores and Metals, which was down (-10.03%), while the largest increase was from Grain, which was up (+22.61%).
In the East, CSX’s total volumes were up (+0.77%), with the largest decrease coming from Chemicals (-14.25%), while the largest increase came from Nonmetallic Minerals (+13.47%). NS’s volumes were up (+0.02%), with the largest increase coming from Motor Vehicles and Parts (+19.05%), while the largest decrease came from Coal (-7.81%).
In the West, BN’s total volumes were up (1.51%), with the largest increase coming from Grain (+20.05%), while the largest decrease came from Nonmetallic Minerals (-14.09%). UP’s total rail volumes were up (+4.2%), with the largest increase coming from Grain (+34.04%), while the largest decrease came from Farm Products (-2.66%).
In Canada, CN’s total rail volumes were down (-3.86%), with the largest increase coming from Grain (+67.37%) while the largest decrease came from Metallic Ores and Metals (-26.23%). CPKCS’s rail volumes were down (-20.16%), with the largest increase coming from Grain (+26.21%), while the largest decrease came from Forest Products (-64.67%).
Source Data: AAR – PFL Analytics
Rig Count
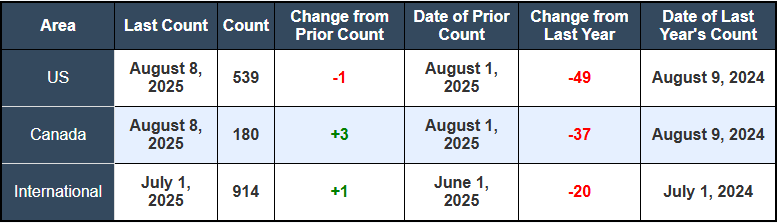
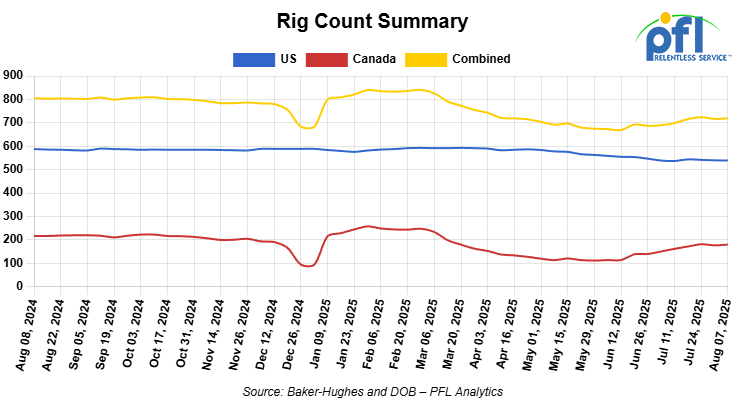
North American rig count was up by 2 rigs week-over-week. The US rig count was down by -1 rigs week-over-week, and down by -49 rigs year-over-year. The US currently has 539 active rigs. Canada’s rig count was up 3 rigs week-over-week, and down by -37 rigs year-over-year. Canada currently has 180 active rigs. Overall, year-over-year we are down by -86 rigs collectively.
North American Rig Count Summary
We are watching a few things out there for you:
We are Watching Petroleum Carloads
The four-week rolling average of petroleum carloads carried on the six largest North American railroads rose to 28,164 from 27,782 which was an increase of +382 rail cars week-over-week. Canadian volumes were mixed. CPCK’s shipments were lower by -1.0% week over week, CN’s volumes were up by +2.0% week-over-week. U.S. shipments were also mixed. The UP had the largest percentage decrease and was down by -7.0%. The NS had the largest percentage increase and was up by +9.0%.
PFL is Watching FTAI Infrastructure and Wheeling and Lake Erie
FTAI Infrastructure just made a bold, unapologetic move—spending $1.05 billion to buy The Wheeling & Lake Erie Railway (W&LE), the biggest independent regional railroad in America. This isn’t Wall Street shuffling paper; this is about adding track, horsepower, and reach that can actually move freight faster.
The deal drops W&LE straight into FTAI’s Transtar network, creating a regional freight player with serious muscle. Pending Surface Transportation Board approval, the transaction closes in Q3.
Why you should care if you ship anything by rail:
- W&LE runs more than 1,000 miles of track through Ohio, Pennsylvania, West Virginia, and Maryland;
- It connects with three Class I railroads and 16 regional/short lines, meaning more routing flexibility and better leverage in rate talks;
- The customer list is as diverse as it gets: steel, frac sand, chemicals, plastics, grain, lumber, and NGLs.
The bigger point: This acquisition plugs a major regional network into a broader system, giving shippers new lanes, more competitive interchange options, and potential relief from some of the bottlenecks that have plagued Midwest freight. For industries moving bulk commodities like energy, manufacturing, and agriculture, this could mean faster turnarounds and a stronger negotiating position with carriers.
With $2.25 billion in new funding—$1.25B in debt, $1B in preferred stock—FTAI has the resources to invest in track upgrades, equipment, and service expansion. If the integration is handled right, it’s a chance for shippers to see genuine gains in reliability and capacity.
For energy producers, manufacturers, and ag shippers, the takeaway is simple: this is one of the few rail deals in recent memory that could immediately open up more options and better connections. Bigger footprint. More flexibility. And a stronger hand at the negotiating table.
We are Watching Tariffs and the Impact on Rail
Import cargo at U.S. container ports is projected to drop sharply—down 5.6% year-over-year from 25.5 million TEUs in 2024 to an expected 24.1 million TEUs in 2025.
That July spike you saw at the docks was a one-off! Shippers were rushing to beat looming tariff hikes. Now the forecast turns dim: August imports could fall 10–15%, with September plunging nearly 20%—levels not seen since late 2023.
Why This Matters for Rail:
- Less Cargo = Less Rail Demand – Fewer containers coming in means fewer intermodal moves and thinner volumes for rail lines tied to port traffic;
- Volatility Is the New Normal – Stop-start shipping schedules will make forecasting a headache for the rest of the year;
- Rates Could Swing Both Ways – Lower demand may briefly ease pricing, but expect carriers to cut or consolidate service to match reduced volumes;
- Equipment Shuffle Incoming – Underutilized chassis, containers, and railcars tied to imports will need to be redeployed or sit idle.
At-Risk Corridors: Where the Slowdown Hits First
West Coast → Midwest
- LA/Long Beach to Chicago/Kansas City – Traditionally heavy with Asian imports; volumes likely to fall fastest as shippers reroute or cut orders.
- Oakland to Midwest hubs – Smaller but still exposed; discretionary cargo may bypass entirely.
East Coast → Interior
- Savannah/Charleston to Atlanta, Memphis, and Chicago – The tariff-driven pre-buy surge is over; expect emptier trains and potential service cuts.
- New York/New Jersey to Ohio Valley – High exposure to retail goods and consumer imports from Europe and Asia.
Gulf Coast → Heartland
- Houston to Dallas, St. Louis, and Chicago – Energy-related imports may hold, but consumer goods and industrial machinery traffic will feel the drop.
The Bigger Picture:
In April, U.S.–China container volumes plunged as importers reacted to triple-digit tariff hikes. Ports like Savannah only posted record numbers because of the short-lived tariff reprieve—once it expired, volumes dropped hard. Logistics giants are warning of a shaky second half as companies pull back orders and re-route sourcing.
The Bottom Line for Rail Shippers:
Aggressive tariff policy is re-drawing the freight map in real time. Intermodal flows are set to shrink, demand will be unpredictable, and asset utilization will be harder to manage. Shippers who adapt quickly—by locking in competitive contracts, diversifying gateways, and staying flexible on routing—will have the upper hand when the market stabilizes.
We are Watching Wildfire Disruptions
The 2025 wildfire season in Canada is shaping up to be one of the most destructive on record, with over 6.5 million hectares already burned—more than double the average by this time of year. These fires are not just a national environmental crisis, but they are a growing logistical nightmare for rail operators and shippers. CN Rail has faced repeated service shutdowns and rerouting in Manitoba, Alberta, and British Columbia, while smoke conditions have disrupted visibility and delayed critical rail corridors across Ontario and Quebec. In some cases, fires have cut off access to major ports, including the Port of Vancouver, leading to ripple effects across intermodal networks and container scheduling.
For the rail industry, the operational impact is twofold: immediate disruption of scheduled routes, and the longer-term challenge of system reliability. Shippers are already feeling the effects in the form of longer transit times, missed connections, and rising costs from rebooking or rehandling cargo. For companies managing just-in-time supply chains, especially in grain, forestry, and energy commodities, these wildfires introduce a volatile new variable into planning. Going forward, carriers and customers alike will need to invest in stronger seasonal contingency planning, including the diversification of routing options, proactive customer communication strategies, and fire-season capacity buffers. The industry must now treat wildfire disruption as an annual risk factor—on par with labor disruptions or severe weather—rather than an occasional outlier.
Class 1 compliance is getting Tough, More Government Interference
Both Canadian and U.S. regulators have sharpened their focus on freight rail safety, emissions, and labor standards in 2025. In Canada, Transport Canada has been ramping up inspection volumes and issuing a growing number of administrative penalties under the Railway Safety Act. The federal government is also leaning harder on compliance with the Locomotive Emissions Monitoring (LEM) Program, signaling that greenhouse gas accountability will play a more active role in regulatory oversight. Shippers are seeing the impact through increased documentation requirements and higher carbon-related surcharges—particularly with CN’s revised carbon charge program now in effect. Some say these policies are “regulatory sabotage” that punish efficient, diesel-powered freight systems, drive up costs, and benefit trucking competitors who aren’t yet held to the same climate standards.
The U.S. is witnessing a similar pivot. The proposed Railway Safety Act of 2025 includes new inspection standards for hazardous cargo and stronger enforcement around brake and car component technologies, particularly those tied to foreign sources flagged under national security clauses. In parallel, the Federal Railroad Administration (FRA) is actively reviewing freight car safety standards, while worker unions continue pushing for permanent paid sick leave and fatigue management policies, some of which have been adopted into federal guidelines.
Rail companies will need to plan for higher operating costs, not just from compliance, but from structural investment in cleaner locomotives, upgraded braking systems, and expanded labor benefits. Shippers, too, must brace for changes in freight rates as railroads begin to recover these regulatory costs through tariffs. Companies that operate across borders will be particularly exposed, requiring legal teams and compliance officers to stay ahead of diverging standards between U.S. and Canadian regulators.
We are Watching Supply Chain Adjustments
Despite the double hit of wildfires and labor disruptions in 2025, Canadian railroads have delivered some of the strongest grain movement volumes in recent memory. CN Rail’s 2024–25 season closed with more than 31 million metric tons moved, and projections for the upcoming year remain strong—assuming wildfire interruptions are controlled. CPKC has made massive capital investments in fleet renewal, including hundreds of new hopper cars and Tier 4 locomotives, positioning itself to handle heavier seasonal volume across its expanded network from Western Canada to the U.S.’s Gulf Coast.
Still, the industry is far from stable. Labor slowdowns at key ports, particularly Vancouver and Montreal, have highlighted the fragility of Canada’s export corridors, while shifting weather patterns have made traditional crop forecasts less reliable. Shippers and rail operators are being forced to adapt by redesigning supply flows: leaning more on secondary rail hubs, building up inventory buffers, and exploring greater modal flexibility through rail-truck transloading. In the U.S., uncertainty around diesel pricing, export tariffs, and intermodal congestion continues to put pressure on long-haul freight planning.
The message for stakeholders is clear: supply chains must evolve from linear to adaptive. Fixed routes and rigid schedules are no longer viable in a system facing year-round climate, labor, and regulatory volatility. Forward-looking firms are now embracing dynamic logistics models, specifically ones that layer real-time visibility, alternate routing, and risk-adjusted pricing into their planning. Those that fail to make the shift may find themselves priced out or stranded when the next disruption strikes.
We are watching Fuel-by-Rail
Headline petroleum carload figures are masking a major compositional shift in the market. While the four-week rolling average of petroleum carloads rose slightly to 28,164, AAR data for the week ending August 2 shows U.S. carloads of “petroleum and petroleum products”—a category heavily influenced by crude—actually decreased by 185 carloads year-over-year.
- Canadian Crude-by-Rail (CBR) Market Assessment: The Canadian CBR market remains structurally marginalized. In May, CBR exports fell to just 67,700 b/d, a 24% decline from the prior year.
- NGL & Ethanol Growth Confirmed by New Infrastructure: In stark contrast to CBR, the NGL and ethanol rail sectors are booming, a trend confirmed by new infrastructure coming online this week.
- NGLs: Enterprise Products Partners loaded the first-ever ethane cargo from its new 120,000 b/d Neches River terminal this week, with the vessel departing for China on August 5th. This follows confirmation that Energy Transfer’s 250,000 b/d expansion of its Nederland, Texas, NGL export terminal is now online, with volumes expected to ramp up through the end of the year. These facilities create a powerful “pull” for NGLs that must be delivered by rail.
- Ethanol: Ahead of U.S. tariffs, U.S. ethanol exports surged to 137,500 b/d in June, a new record for the month and a 19% increase over the previous year, with strong demand from Canada, India, and South Korea driving the growth, but we expect that to subside very quickly. Ontario, on Friday, updated the province’s regulations pertaining to domestic bio-based content requirements for both diesel fuel and gasoline and has determined that at least 75% of the renewable content required in the province’s diesel fuel and 64% of the renewable content required in the gasoline must originate in Canada. The Ontario Ministry of the Environment, Conservation and Parks directed that the updated requirements will be prorated for the remainder of the 2025 compliance year and will be effective immediately.
“Viable clean fuel production is essential to Canada’s energy security, and energy security is the cornerstone of economic security in Canada. ABFC [Advanced Biofuels Canada] recognizes the significant steps taken by the Government of Ontario to ensure that domestic renewable fuel producers are competitive in Ontario’s fuel market. With this move, both British Columbia and Ontario have now implemented requirements that a proportion of the clean fuels supplied in the market are of Canadian-origin,” stated Advanced Biofuels Canada President Fred Ghatala in reaction to the Ontario Ministry of the Environment, Conservation and Parks’ decision.
We are watching: The Railcar & Equipment Market
The current market is defined by a disconnect between a strong leasing market and a softening new build market.
- Leasing Market Remains Robust: While specific data from lessors was not released this week, analysts note that the costs of tank car maintenance appear to be rising faster than the cost of new cars, suggesting continued opportunities for lessors to maintain strong leasing margins into the near future.
- New Build Outlook: The new build market appears to be softening. Order volume has slowed over the past few months as shippers defer purchase decisions.
- Regulatory Driver: The market for 117Js is underpinned by a federal mandate requiring the phase-out of all legacy DOT-111 and CPC-1232 tank cars for flammable liquids by May 1, 2029.
PFL’s Perspective & Strategic Recommendations:
The ground is shifting under the rail industry this week. M&A activity is set to redraw the competitive map, while a Supreme Court ruling has just de-risked new energy infrastructure development. The bifurcation of the fuel-by-rail market is accelerating, with new NGL export terminals coming online just as Canadian crude-by-rail withers.
- For Shippers: The UP-NS merger process will be the most critical issue to watch. Engage with trade groups now to voice concerns over service and rate impacts. The FTAI-W&LE deal shows that regional and shortline partners are more important than ever for network flexibility.
- For Railroads & Operators: The successful launch of new NGL export terminals underscores the importance of rail as the critical “first and last mile” connector. Prioritizing service and fluidity for these growing NGL and ethanol supply chains is paramount.
- For Investors: Valuations must be re-evaluated. The Supreme Court’s Uinta decision creates a clear tailwind for investment in new energy-related rail projects. In the equipment sector, leasing companies with strong fleet utilization and rate power appear better positioned than manufacturers facing a softening new build market.
We are Watching Key Economic Indicators
U.S. Manufacturing
The ISM Manufacturing PMI slipped to 48 in July, down from 49 in June and below expectations for a modest rebound to 49.5. This marks the fifth straight month of contraction in the manufacturing sector and the lowest reading since October 2024.
Weakness was most pronounced in supplier deliveries (45.7 vs. 46.7) and employment (43.4 vs. 45), signaling ongoing challenges in labor management and logistics. “The Employment Index dropped further into contraction as panelists indicated that managing head count is still the norm at their companies, as opposed to hiring,” noted Susan Spence, Chair of the ISM Manufacturing Business Survey Committee.
Despite the overall decline, there were pockets of resilience. Production edged higher (51.4 vs. 50.3), while declines in new orders (47.1 vs. 46.4) and order backlogs (46.8 vs. 44.3) slowed, suggesting some stabilization in demand. Price pressures eased notably, with the prices index falling to 64.8 from 69.7 — a welcome sign for firms navigating elevated input costs.
Overall, the data paints a picture of a manufacturing sector still under pressure, with cautious optimism emerging in select components.

Lease Bids
- 30-50, 6000cf Steel Hopper located off of CSX or NS in East. For use in petcoke service. Period: 5 Years.
- 50, 5000CF Covered Hopper located off of UP or BN in Houston. For use in Fertilizer service. Period: 6 Months. Bid: Negotiable.Needed ASAP.
- 10, 2500CF Open Top Hopper located off of UP or BN in Texas. For use in aggregate service. Period: 5 years. Bid: Negotiable.Need Rapid Discharge Doors.
- 20, 25.5k CPC 1232 Tank located off of UP, BN, CSX, NS in OK, TX, Northeast. For use in Asphalt service. Period: 3 Years. Bid: Negotiable.
- 10, 25.5K Any Type Tank located off of CSX in Florida. For use in UCO service. Period: 2 Years. Bid: Negotiable.
- 20, 28.3K 117J Tank located off of BN in Montana. For use in Crude service. Period: 2 years. Bid: Negotiable.
- 15-20, 29K 117R Tank located off of NS or CSX in Ohio. For use in Ply Oil service. Period: 6-12 Months. Bid: Negotiable.
- 10, 30K 117R or 117J Tank located off of Any Class 1 in USA. For use in Glycerin service. Period: 1 year. Bid: Negotiable.
- 50, 23.5-25.5 DOT111 Tank located off of Any Class 1 in USA. For use in Asphalt service. Period: 5 years. Bid: Negotiable.
- 50-100, 33K 117J Tank located off of BN or UP in Bellview. For use in Butane/ service. Period: Sept-March. Bid: Negotiable.
- 4, 30K 117J Tank located in Michigan. For use in Food Grade Ethanol service. Period: Multi year. Bid: Negotiable.
- 10-20, 29K CPC 1232 Tank located off of CP in Washington, Iowa. For use in Biodiesel service. Period: 1 Year min. Bid: Negotiable.
- 50, 33K 117J Tank located off of CP or CN in Canada. For use in Propane service. Period: Summer. Bid: Negotiable.
- 6, 4750 Covered Hopper located off of NS in Georgia. For use in Fertilizer service. Period: 3-5 years. Bid: Negotiable.
- 100, 21.9K 117J Tank located off of All Class 1s in Midwest. For use in CO2 service. Period: 6 months. Bid: Negotiable.
Sales Bids
• 28, 3400CF located off of UP BN in Texas. For use in Cement service. Bid: Negotiable. Cement Gates needed.
• 20, 17K DOT111 located off of various class 1s in various locations. For use in corn syrup service.
Lease Offers
- 60, 4750 Covered Hoppers located off of UP or BN in Eads, CO. Last used in Grain. Offer: Negotiable. UP to 5 Years, 3 Hopper, Gravity Gate, Trough Hatches.
- 100, 6250 Covered Hoppers located off of UP. Last used in DDG. Offer: Negotiable. 1 Year term. Dirty to Dirty. Free move on UP..
- 24, 25.5K-30K DOT111 Tanks located off of UP or BN in Texas. Last used in Base Oils. Offer: Negotiable. 1-2 Year.
- 25, 19.6K DOT111 Tanks located off of UP in US. Last used in Molases. Offer: Negotiable.
- 50, 20K DOT111 Tanks located off of UP or BN in Wichita Falls, TX. Last used in HCL. Offer: Negotiable.
- 50, 30K 117R Tanks located off of CSX, NS, or CN in Detroit. Last used in Diesel. Offer: Negotiable. Multiyear.
- 50, 20K 117J Tanks located off of All Class 1s in N/A. Last used in Styrene. Offer: Negotiable. Cars are currently moving.
Sales Offers
- 21, 50′ Boxcar Plate Cs located off of various class 1s in NM. Offer: Negotiable. End of Life.
- 3, 50′ Boxcar Plate Cs located off of various class 1s in multiple locations. Offer: Negotiable. End of Life.
- 27, 50′ Boxcar Plate Cs located off of various class 1s in PQ. Offer: Negotiable. End of Life.
- 100, 3250 Covered Hoppers located off of various class 1s in multiple locations. Offer: Negotiable. Sand Cars.
- 5, 2740 Mill Gondolas located off of various class 1s in NC. Offer: Negotiable. End of Life.
- 1, 2260 Mill Gondolas located off of various class 1s in AL. Offer: Negotiable. End of Life.
- 30, 2740 Mill Gondolas located off of various class 1s in multiple locations. Offer: Negotiable. End of Life.
- 21, 2740 Mill Gondolas located off of various class 1s in WA. Offer: Negotiable. End of Life.
- 9, 4750 Covered Hoppers located off of various class 1s in multiple locations. Offer: Negotiable. End of Life.
- 5, 4750 Covered Hoppers located off of various class 1s in multiple locations. Offer: Negotiable. End of Life.
- 50, 31.8K Tank CPC 1232s located off of UP or BN in TX. Offer: Negotiable. Requal Due in 2025.
Call PFL today to discuss your needs and our availability and market reach. Whether you are looking to lease cars, lease out cars, buy cars, or sell cars call PFL today at 239-390-2885
Live Railcar Markets
| CAT | Type | Capacity | GRL | QTY | LOC | Class | Prev. Use | Offer | Note |
|---|
PFL will be at the Following Conferences

- Where: La Quinta, CA
- Attending: David Cohen (954-729-4774)
- Conference Website

- Where: Hyatt Regency Dallas in Dallas, TX
- Attending:Curtis Chandler (239.405.3365), David Cohen (954-729-4774), Brian Baker (239.297.4519), Cyndi Popov(403) 402-5043
- Conference Website