
The return we reap from generous actions is not always evident.
Francesco Guicciardini
Jobs Update
- Initial jobless claims for the week ending July 1st, 2023 came in at 248,000, up 12,000 people week-over-week.
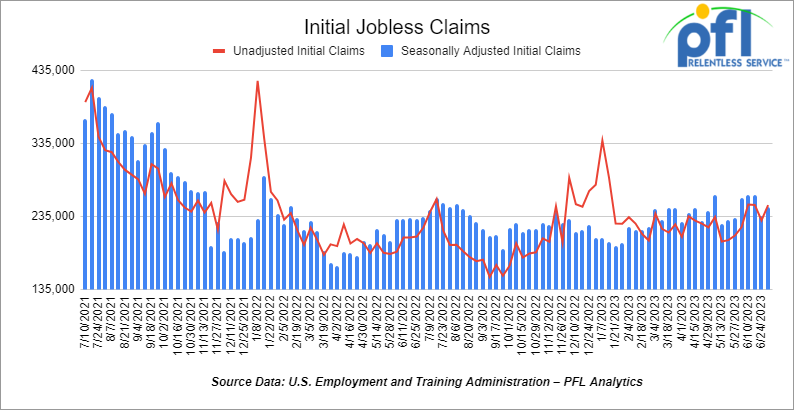
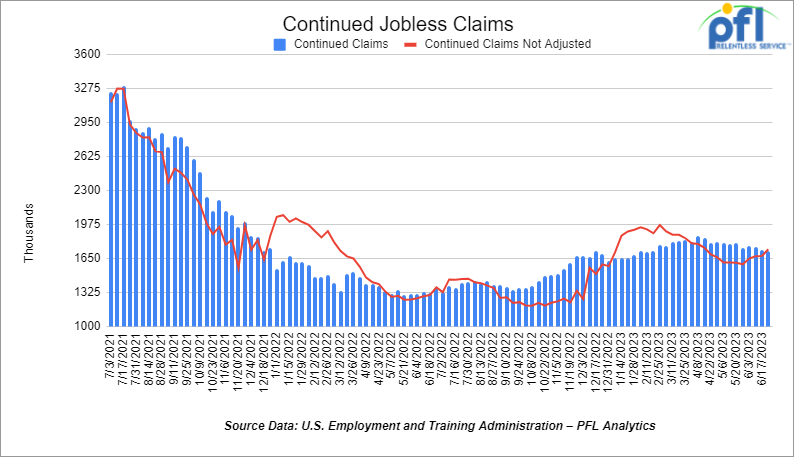
- Continuing jobless claims came in at 1.720 million people, versus the adjusted number of 1.733 million people from the week prior, down -13,000 people week over week.
Stocks closed lower on Friday of last week and lower week over week
The DOW closed lower on Friday of last week, down -187.38 points (-0.55%), closing out the week at 33,734.88, down -672.72 points week over week. The S&P 500 closed lower on Friday of last week, down -12.64 points (-0.29%) and closed out the week at 4,398.95, down -51.43 points week over week. The NASDAQ closed lower on Friday of last week, down -18.33 points (-0.13%), and closed the week at 13,660.72, down -127.20 points week over week.
In overnight trading, DOW futures traded lower and are expected to open at 33,930 this morning down -7 points.
Crude oil closed up on Friday of last week and was higher week over week
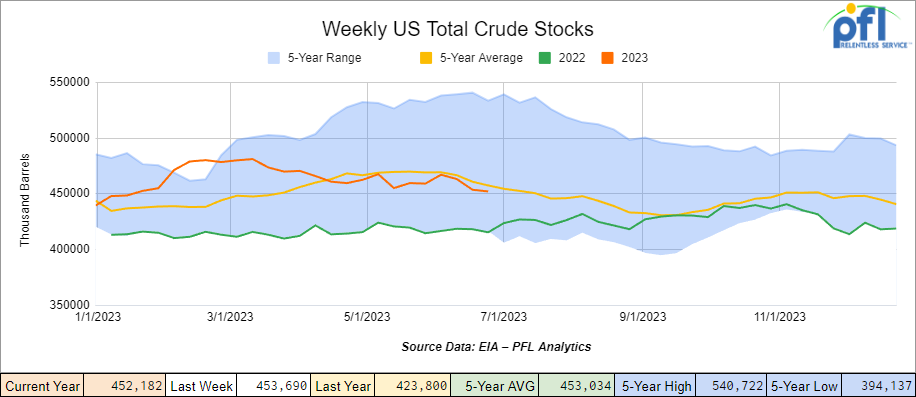
WTI traded up $2.06 per barrel (+2.9%) to close at $73.86 per barrel on Friday of last week, up $3.22 per barrel week over week. Brent traded up US$1.96 per barrel (+2.6%) on Friday of last week, to close at US$78.47 per barrel, up US$3.57 per barrel week over week. U.S. commercial crude oil inventories (excluding those in the Strategic Petroleum Reserve) decreased by 1.5 million barrels week over week. At 452.2 million barrels, U.S. crude oil inventories are 1% below the five-year average for this time of year.
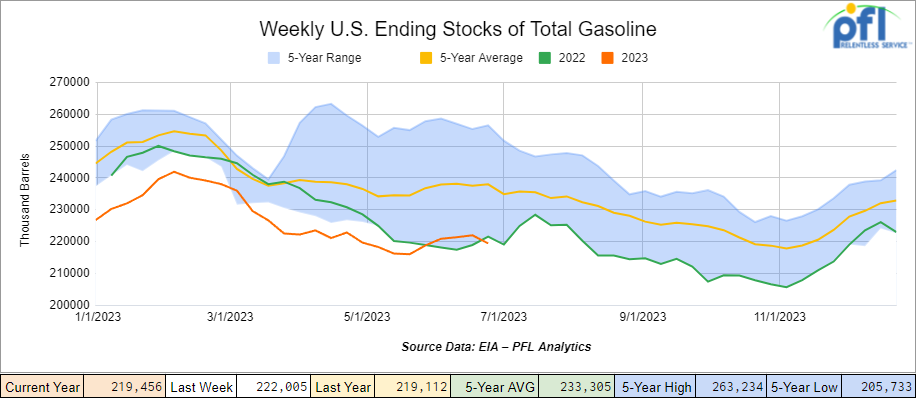
Total motor gasoline inventories decreased by 2.5 million barrels week over week and are 7% below the five-year average for this time of year.
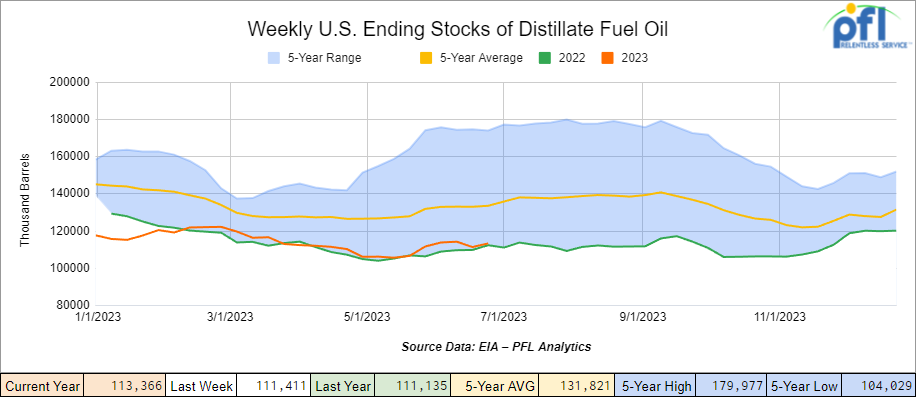
Distillate fuel inventories decreased by 1 million barrels week over week and are 16% below the five-year average for this time of year.
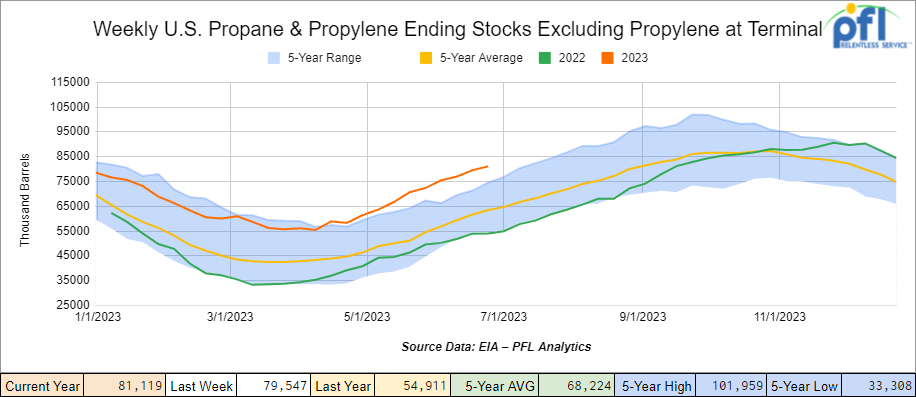
Propane/propylene inventories increased 1.6 million barrels week over week and are 26% above the five-year average for this time of year.
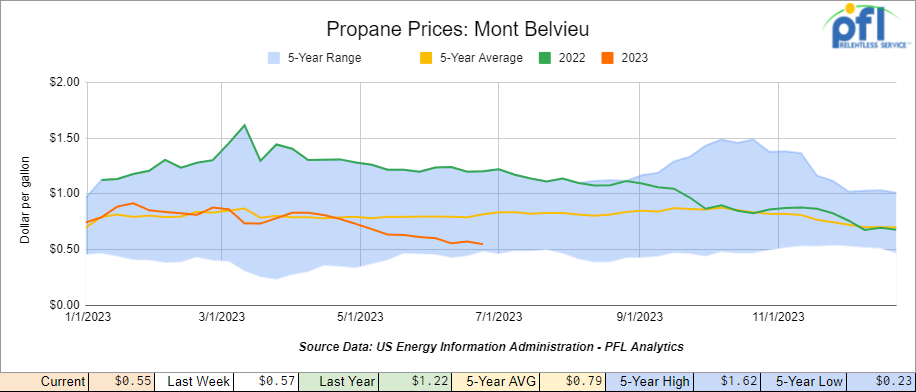
Propane prices closed at 55 cents per gallon, down 2 cents per gallon week over week and down 67 cents per gallon year over year
Overall, total commercial petroleum inventories decreased by 2.8 million barrels during the week ending June 30th, 2023.
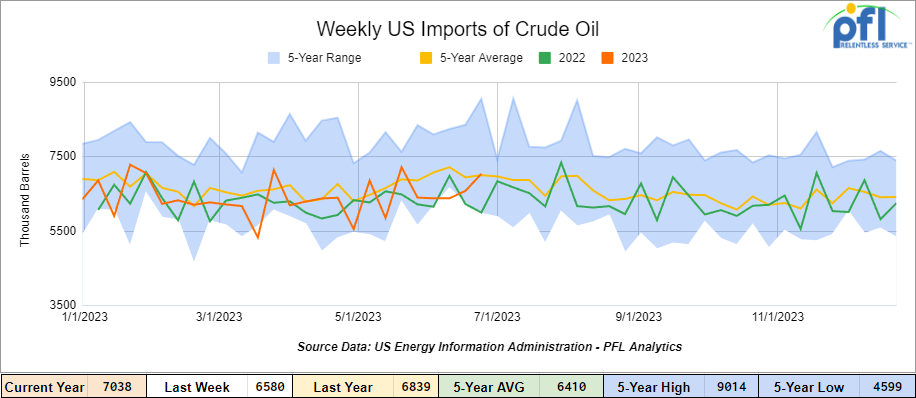
U.S. crude oil imports averaged 7 million barrels per day during the week ending June 30th, 2023, an increase of 459,000 barrels per day week over week. Over the past four weeks, crude oil imports averaged about 6.5 million barrels per day, 0.4% more than the same four-week period last year. Total motor gasoline imports (including both finished gasoline and gasoline blending components) averaged 851,000 barrels per day, and distillate fuel imports averaged 113 thousand barrels per day for the week ending June 30th, 2023.
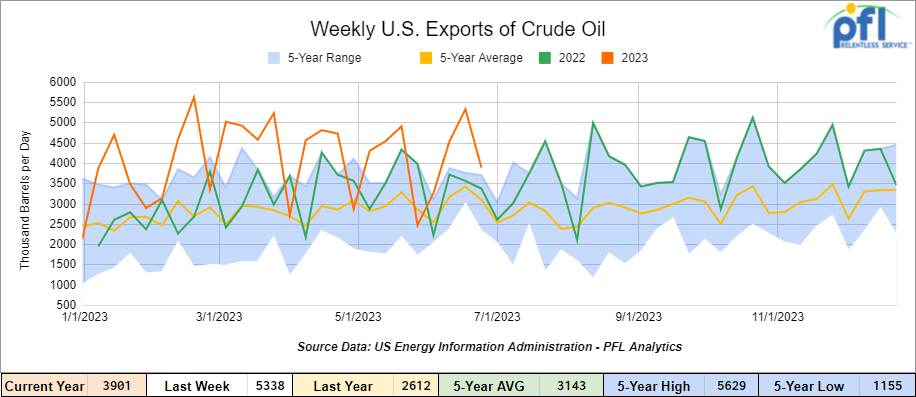
U.S. crude oil exports averaged 3.901 million barrels per day for the week ending June 30th, 2023, a decrease of 1.437 barrels per day week over week. Over the past four weeks, crude oil exports averaged 4.263 million barrels per day.
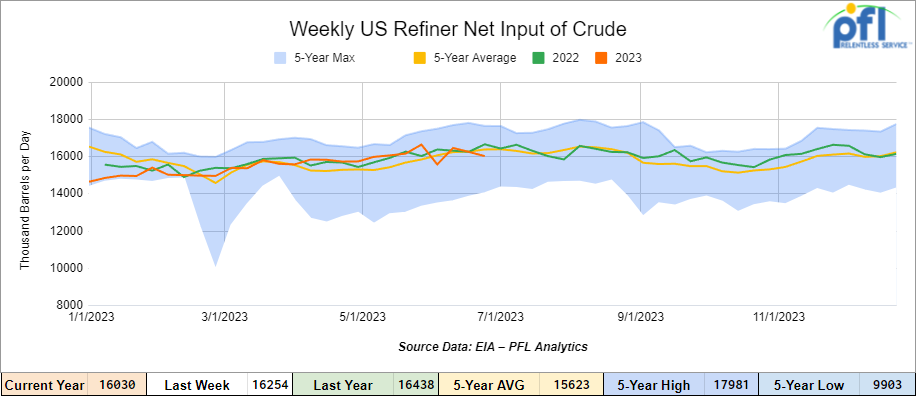
U.S. crude oil refinery inputs averaged 16 million barrels per day during the week ending June 30, 2023, which was 224,000 barrels per day less than the previous week’s average.
As of the writing of this report, WTI is poised to open at $73.29, down -0.57 cents per barrel from Friday’s close.
North American Rail Traffic
Week Ending July 5th, 2023.
Total North American weekly rail volumes were down (-5.96%) in week 26, compared with the same week last year. Total carloads for the week ending on July 5th, 2023 were 336,572, down (-4.46%) compared with the same week in 2022, while weekly intermodal volume was 312,046, down (-7.52%) compared to the same week in 2022. 8 of the AAR’s 11 major traffic categories posted year over year decreases with the most significant decrease coming from Grain (-28.82%). The largest increase came from Motor Vehicles and Parts (+16.23%).
In the East, CSX’s total volumes were down (-2.44%), with the largest decrease coming from Grain (-23.67%) and the largest increase from Motor Vehicles and Parts (+20.54%). NS’s volumes were down (-2.66%), with the largest decrease coming from Petroleum and Petroleum Products (-20.06%) and the largest increase from Motor Vehicles and Parts (+10.33%).
In the West, BN’s total volumes were down (-7.55%), with the largest decrease coming from Grain (-30.38%), and the largest increase coming from Motor Vehicles and Parts (+29.62%). UP’s total rail volumes were down (-4.2%) with the largest decrease coming from Grain (-33.03%) and the largest increase coming from Motor Vehicles and Parts (+13.53%).
In Canada, CN’s total rail volumes were down (-14.75%) with the largest increase coming from other (+3.29%) and the largest decreases coming from Grain (-55.57%). CP’s total rail volumes were up (2.07%) with the largest decrease coming from Forest Products (-16.28%) and the largest increase coming from Motor Vehicles and Parts (+68.35%).
KCS’s total rail volumes were down (-20.35%) with the largest decrease coming from Grain (-48.55%) and the largest increase coming from Other (+17.48%).
Source Data: AAR – PFL Analytics
Rig Count
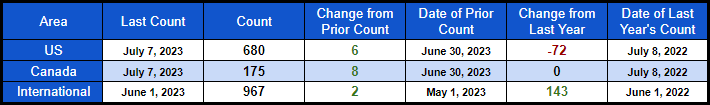
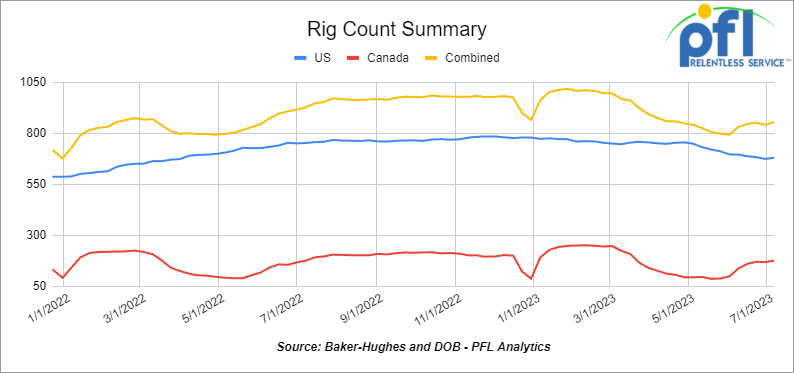
North American rig count was up by +14 rigs week over week. U.S. rig count was up by +6 rigs week over week and down by -72 rigs year-over-year. The U.S. currently has 680 active rigs. Canada’s rig count up by +8 rigs week-over-week and flat year over year. Canada’s overall rig count is 175 active rigs. Overall, year-over-year, we are down -72 rigs collectively.
International rig count which is published monthly was up by +2 rigs month-over-month and up +143 rigs year-over-year. Internationally, there are 967 active rigs.
North American Rig Count Summary
A few things we are watching:
We are watching the National Steel Car and other Labor Strikes
The strike by 1,450 National Steel Car workers in Hamilton, Ontario, Canada, continues as the workers fight for wage increases, the elimination of multi-tier pay and pensions, and claim needing improved working conditions. The striking workers are part of a larger wave of labor unrest in North America, including a strike by 7,400 Canadian dock workers and a strike by over 1,400 workers at Wabtec in Pennsylvania. The workers are urging solidarity among various sections of the working class to counter the demands for concessions and what they claim as unsafe conditions imposed by the corporate elite. They criticize the lack of support from the United Steelworkers (USW) and advocate for joint cross-border strike action to achieve their goals.
The committee emphasizes the importance of international class solidarity and criticizes the nationalist and pro-company outlook of the union bureaucracy. They highlight ongoing contract negotiations for workers at United Parcel Service and the Detroit Three automakers, stressing the need for collective action. The committee aims to establish the National Steel Car Rank-and-File Committee and collaborate with the International Workers Alliance of Rank-and-File Committees (IWA-RFC) to coordinate efforts with other workers’ groups.
The National Steel Car Rank and File Committee organized a public meeting to unify the workers’ struggle and involve other industrial and manufacturing workers in Canada and the United States on Thursday, July 6th. The committee aimed to address the grievances and push for a joint counter-offensive against the company and its allies in the union bureaucracy. Meanwhile, striking workers have reported that the company has cut off their health benefits, leaving them to cover medical expenses out of pocket. The union’s strike fund provides strike pay, but it only kicks in after several weeks of strike action. Workers are demanding an end to the manipulation in negotiations, unsafe working conditions, and loss of life, emphasizing the need for change and unified action. National Steel Car and other pending labor disputes out there have the real possibility of seriously damaging North America’s supply change.
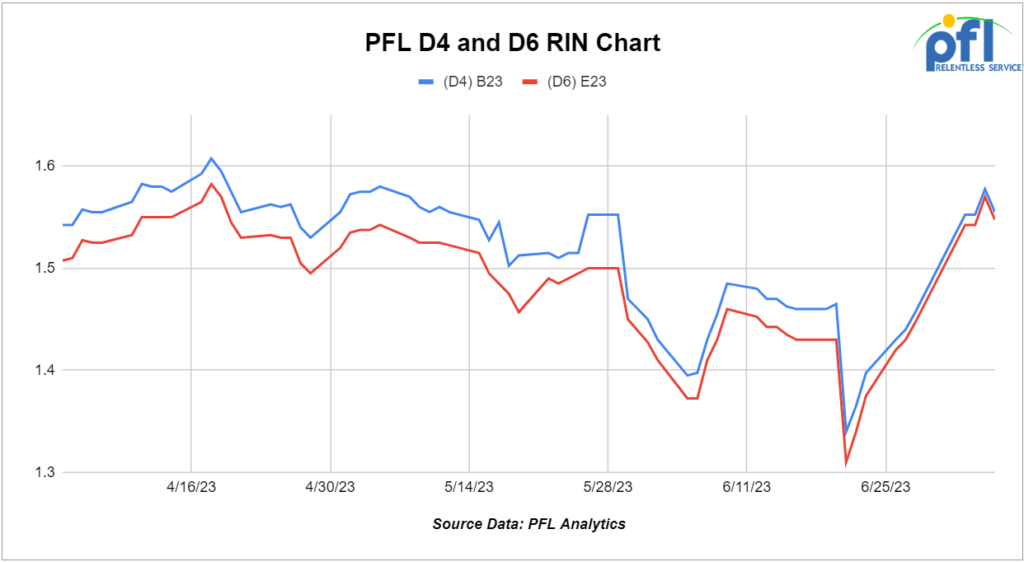
Why Lower Oil Prices Haven’t Translated to Cheaper Fuel at the Pump
Despite lower oil prices that have remained stagnant, consumers have not witnessed a significant decrease in prices at the pump. One contributing factor to this phenomenon is the increase in the prices of D4 and D6 Renewable Identification Numbers (RINS). D6 RINS are generated by blending Ethanol with gasoline and D4 RINS are generated by blending Biodiesel with diesel which the government says is essential in meeting the Environmental Protection Agency’s renewable fuel standards. Unfortunately, the prices of D4 and D6 RINS have been on the rise, creating additional costs for oil refiners, who then pass on these expenses to consumers, preventing a significant drop in pump prices.
Furthermore, the decline in ethanol production has also played a role in the lack of reduction in pump prices. Ethanol, typically derived from corn, is a key component in blending with gasoline. However, a decrease in the availability of corn and the subsequent increase in its prices have caused a surge in ethanol costs. As a result, refiners face higher expenses in procuring ethanol, which they pass on to consumers. This upward pressure on Ethanol prices further hampers any potential decrease in fuel prices, frustrating consumers who expected relief from the lower oil prices.
We are watching Key Economic Indicators
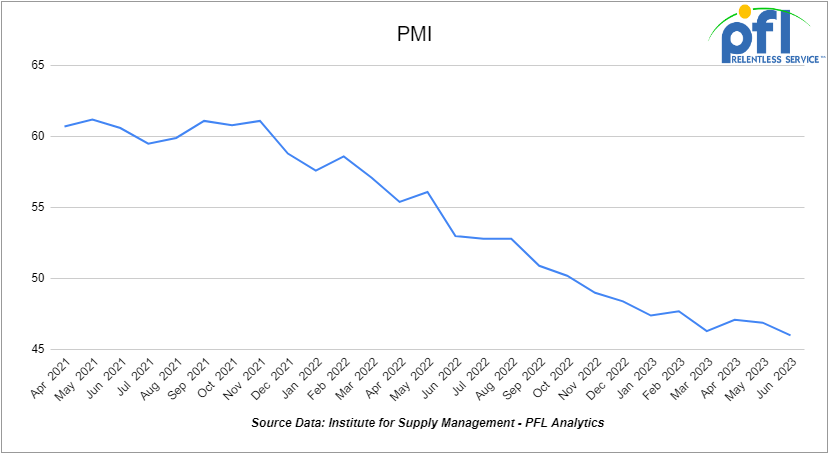
Purchasing Managers Index (PMI)
The Institute for Supply Management releases two PMI reports – one covering manufacturing and the other covering services. These reports are based on surveys of supply managers across the country and track changes in business activity. A reading above 50% on the index indicates expansion, while a reading below 50% signifies contraction, with a faster pace of change the farther the reading is from 50. In June, the PMI decreased to 46.0% from May’s 46.9%, marking the eighth consecutive month of readings below 50% and a 0.9% decrease month over month from May. Meanwhile, the new orders component continued to contract to 45.6% in June.
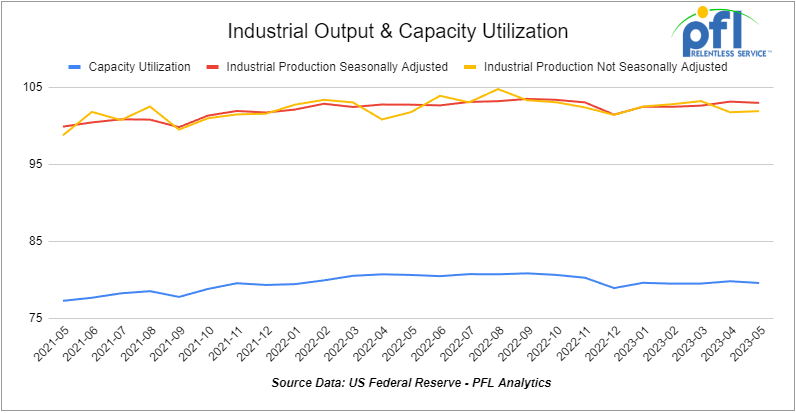
Industrial Output & Capacity Utilization
The Federal Reserve reported that total U.S. industrial output fell a seasonally adjusted, preliminary 0.2% in May 2023 from April 2023, marking its first decline in three months. However, total output in May 2023 was up just 0.2% over May 2022, reflecting the relative stagnation that has affected total output over the past year.
Manufacturing output, which accounts for around 75% of total output, also experienced a modest increase of a preliminary and seasonally adjusted 0.1% in May, significantly lower than the 0.9% rise in April. Manufacturing output in May 2023 was down 0.3% from May 2022, showing a downward trend over the past year. Various industrial sectors have witnessed different growth patterns over the past year, with some sectors declining, such as railroad rolling stock, paper products, and wood products, while others, like motor vehicles and parts and grain mill products, have generally shown an upward trend. However, certain sectors, including agricultural chemicals, petroleum refineries, and plastics, have experienced periods of growth and decline, making it challenging to determine a clear trend.
The overall industrial capacity utilization rate in May was a preliminary 79.6%, slightly down from April but consistent with the monthly average this year.
Manufacturing capacity utilization remained stable at a preliminary 78.4% in May, the same as in April.
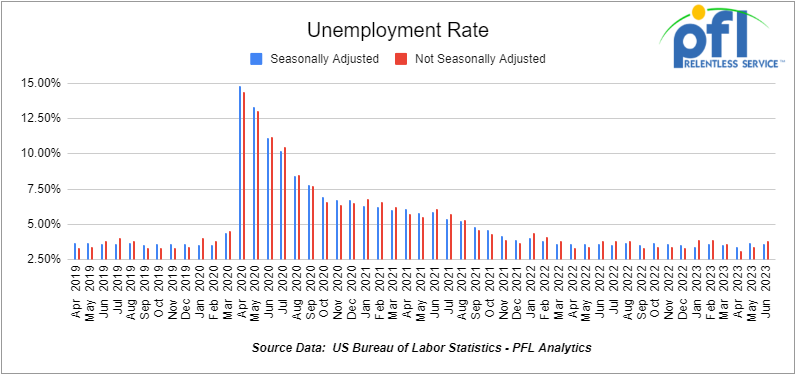
U.S. Unemployment Rate
The Bureau of Labor Statistics’ June employment report, released on July 7th, showed a modest decline in job growth compared to previous months. In June 2023, approximately 209,000 net new jobs were created, which is slightly lower than the revised figure for May. However, the six-month projection of 1.7 million net new jobs exceeded earlier expectations. The official unemployment rate in June decreased to 3.6%, demonstrating a slight improvement. The labor force participation rate for prime-age workers, aged 25-54, reached its highest level since 2002 at 83.5% in June 2023. While average hourly earnings increased by 4.7% compared to the previous year, it was the smallest growth rate in two years. Moreover, the number of individuals working part-time due to economic reasons rose to its highest level in over a year. In May 2023, the total job openings stood at 9.8 million, slightly lower than the previous month. The ratio of job openings to officially unemployed individuals decreased to 1.6, the lowest since October 2021. Initial weekly claims for unemployment experienced a slight increase in June, reaching the highest level since November 2021, indicating potential challenges in the labor market. The quits rate rose in May, suggesting workers’ confidence in finding new employment opportunities. While labor market indicators reflect a cooling trend, it may not necessarily have negative implications as it could be a result of the intended effects of the Federal Reserve’s rate hikes
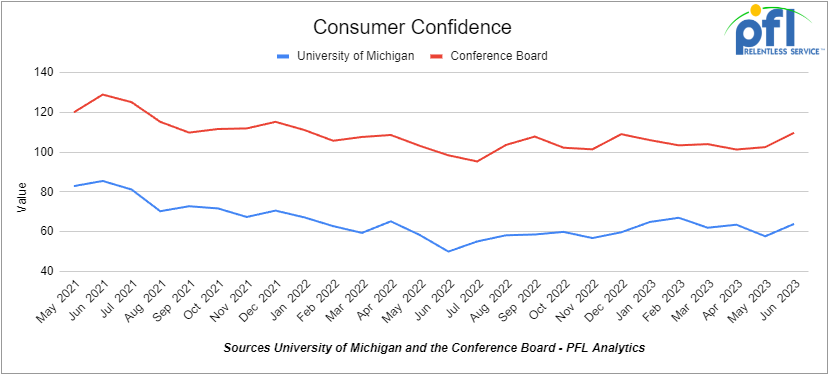
Consumer Confidence
The Conference Board’s Index of Consumer Confidence increased from 102.5 in May to 109.7 in June, marking the highest level in 17 months. This unexpected gain surpassed economists’ predictions, indicating the difficulty of accurately understanding consumer behavior. Notably, the Expectations Index, which measures consumers’ short-term outlook for income, business, and jobs, rose significantly from 71.5 in May to 79.3 in June. Meanwhile, the University of Michigan’s index on consumer sentiment also saw an improvement, rising from 59.2 in May to 64.4 in June, the highest level in four months.
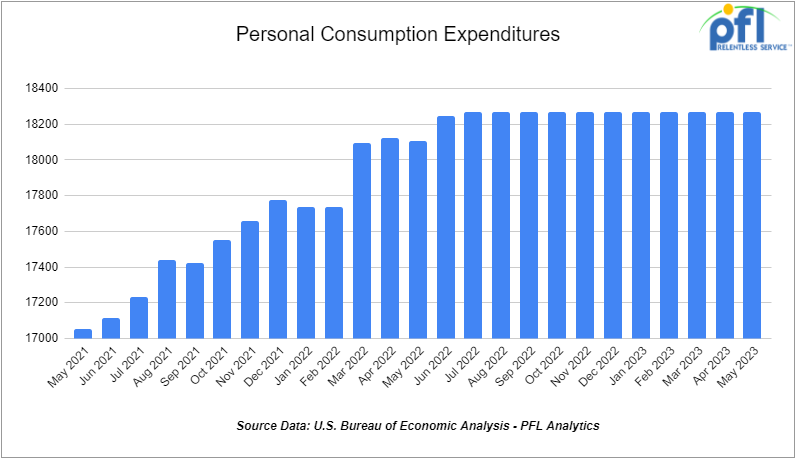
Consumer Spending
Consumer spending, representing around 70% of the U.S. economy, has shown a slowdown based on recent data. In May, total consumer spending only grew by a modest 0.1% compared to April, prior to adjusting for inflation, which is lower than the 0.6% increase observed in April over March. Adjusted for inflation, total spending declined slightly in May, marking the fifth decrease in the past seven months. Notably, spending on goods, particularly relevant for railroads, dropped by 0.5% in May compared to April, without accounting for inflation. Adjusted for inflation, the decline was 0.4%.
We have been extremely busy at PFL with return-on-lease programs involving rail car storage instead of returning cars to a shop. A quick turnaround is what we all want and need. Railcar storage in general has been extremely active. Please call PFL now at 239-390-2885 if you are looking for rail car storage, want to troubleshoot a return on lease scenario, or have storage availability. Whether you are a car owner, lessor or lessee, or even a class 1 that wants to help out a customer we are here to “help you help your customer!”
Leasing and Subleasing has been brisk as economic activity picks up. Inquiries have continued to be brisk and strong Call PFL Today for all your rail car needs 239-390-2885
Lease Bids
- 25, 33K 340W Pressure Tanks needed off of UP or BN in Midwest for Oct-March. Cars are needed for use in Propane service.
- 20-25, 30K 117 Tanks needed off of UP or BN in Illinois for 5 Years. Cars are needed for use in Ethanol service.
- 10, 30K 117 Tanks needed off of NS or CSX in Marcellus for Trip Lease. Cars are needed for use in C5 service.
- 100, 28.3K DOT 111/117 Tanks needed off of UP or BN in Midwest/Texas for 5 Years. Cars are needed for use in Veg Oils/Biodiesel service. Need to be Unlied
- 25-50, 33K 400W Pressure Tanks needed off of CN or CP in Canada for Short Term. Cars are needed for use in Propylene service.
- 50-100, 4550 Covered Hoppers needed off of UP or BN in Texas for 5 Years. Cars are needed for use in Grain service.
- 10, 33K 340W Pressure Tanks needed off of CN in LA for 1 Year. Cars are needed for use in Butane service.
- 25, 20.5K CPC1232 or 117J Tanks needed off of BNSF or UP in the west for 3-5 Year. Cars are needed for use in magnesium chloride service. SDS onhand
- 25-50, 25.5K 117J Tanks needed off of NS CSX in NorthEast for 5 Years. Cars are needed for use in Asphalt/Heavy Fuel Oil service.
- 25-50, 25.5K 117J, 117R, CPC 1232 Tanks needed off of UP or BN in Texas for 1-2 Years. Cars are needed for use in Asphalt service.
- 30-50, 33K 340W Pressure Tanks needed off of any class 1 in any location for 6-12 Months. Cars are needed for use in Propane service.
- 60-150, 30K 117J Tanks needed off of TYR, UP in Corpus Christi, TX for 1 year. Cars are needed for use in Diesel service.
- 100, 30K 117J Tanks needed off of CN in Detroit for 1 Year. Cars are needed for use in Refined Fuel service.
- 15, 28.3K 117J Tanks needed off of any class 1 in any location for 3 year. Cars are needed for use in Glycerin & Palm Oil service.
- up to 50, 31.8K 117J, 117R, CPC 1232 Tanks needed off of any class 1 in Texas or Ohio for 1-3 years. Cars are needed for use in Diesel/Gasoline service.
- 45, 3000 cf PDs Hoppers needed off of any class 1 in Texas for 3 years. Cars are needed for use in Any service.
- 30, 17K-20K 117J Tanks needed off of UP or BN in Midwest/West Coast for 3-5 Years. Cars are needed for use in Caustic service.
- 10, 286K 15.7K Tanks needed off of KCS in Texas for 1 Year. Cars are needed for use in Sulfuric Acid service. Needed Next few months
- 150, 23.5K DOT 111 Tanks needed off of any class 1 in LA for 2-3 Year. Cars are needed for use in Fluid service. Needed July
- 25-50, 32K 340W Pressure Tanks needed off of NS or CSX in Marcellus for 1-2 Years. Cars are needed for use in Propane service.
- 25-50, 30K DOT 111, 117, CPC 1232 Tanks needed off of CN or CP in WI, Sarnia for 1-2 Years. Cars are needed for use in Diesel service.
- 10, 30K DOT 111, 117, CPC 1232 Tanks needed off of UP or BN in Beaumont, Houston, Sunray for 6 Months. Cars are needed for use in Diesel service. Dirty to Dirty
- 10, 5200cf PD Hoppers needed off of UP in Colorado for 1-3 years. Cars are needed for use in Silica service. Call for details
- 30-40, 286K DOT 113 Tanks needed off of CN or CP/ UP in Canada/MM for 5 Years. Cars are needed for use in CO2 service. Q1
- 70, 32K 340W Pressure Tanks needed off of CP or CN in Edmonton for 3 Years. Cars are needed for use in Propane service.
- 200-300, 28.3K 117R or 117J Tanks needed off of CP or CN in Sarnia for 3 Years. Cars are needed for use in Fuel Oil service.
- 30, 30K DOT 111 Tanks needed off of UP in Texas for 1-3 Years. Cars are needed for use in Diesel service.
- 5-7, 28.3K 117R Tanks needed off of NS or CSX in NC for 1 Year. Cars are needed for use in UCO service.
- 25-50, 5000CF-5100CF Lined Hoppers needed off of BNSF, CSX, KCS, UP in Gulf LA for 3-10 years. Cars are needed for use in dry sugar service. 3 bay gravity dump
- 10, any capacity Stainless Steel Tanks needed off of any class 1 in Canada for 5-10 years. Cars are needed for use in Alcohol service.
- 30-50, 30K 117 Tanks needed off of any class 1 in Northeast or Midwest for 1 Year. Cars are needed for use in C5 service. Must have Magrods
- 100, 33K 340W Pressure Tanks needed off of CN in Canada for 3-5 Years. Cars are needed for use in Propane service.
- Up to 60, 5150cf Covered Hoppers needed off of CN, CSX, NS in the east or midwest for 3 years. Cars are needed for use in Fertilizer service. 3-4 hatch gravity dumps
- 20-30, 14k Any Tanks needed off of BNSF, UP in Texas for 1-3 Years. Cars are needed for use in HCl service. Call for more details
Sales Bids
- 1-2, Any DOT 111, 117, CPC 1232 Tanks needed off of any class 1 in Texas. Coiled and Insulated
- 45, 3000 cf PDs Hoppers needed off of any class 1 in Texas. Negotiable
- 20-25, 25.5K 117, DOT-111, CPC 1232 Tanks needed off of UP or BN in Texas. Cars are needed for use in Veg Oil service. Coiled and insulated
- 15, 30K 117, DOT-111, CPC 1232 Tanks needed off of UP or BN in Texas. Cars are needed for use in Veg Oil service.
- 2-4, 28K DOT 111 Tanks needed off of BNSF Preferred in Minnesota. Cars are needed for use in Biodiesel service. Coiled and insulated
- 100, Plate F Boxcars needed off of BN or UP in Texas.
- 200+, 5000cf Covered Hoppers needed off of any class 1 in various locations.
- 20-30, 3000 – 3300 PDs Hoppers needed off of BN or UP preferred in West. Cars are needed for use in Cement service. C612
- 10, 2770 Mill Gondolas needed off of any class 1 in St. Louis. Cars are needed for use in Cement service.
- 100, 15.7K DOT 111 Tanks needed off of CSX or NS in the east. Cars are needed for use in Molten Sulfur service.
- 30, 17K-20K DOT 111 Tanks needed off of UP or BN in Texas. Cars are needed for use in UAN service.
- 20, 2770 Mill Gondolas needed off of CSX in the northeast. Cars are needed for use in non-haz soil service. 52-60 ft
- 10, 4000 Open Hoppers needed off of CSX in the northeast. Cars are needed for use in scrap metal service. Open top hopper
- 10, 6400 Open Hoppers needed off of CSX in the northeast. Cars are needed for use in wood chip service. Open top hopper, flat bottom
Lease Offers
- 70, 25.5K, 117J Tanks located off of UP in Texas. Cars are clean Call for more information
- 30, 23.5K, DOT111 Tanks located off of UP or BN in Texas. Cars were last used in Clean / UAN.
- 25-100, 17.6K, DOT111 Tanks located off of UP or BN in Midwest. Cars were last used in Fertilizer / Corn Syurp. Free move available
- 20, 20k, DOT111 Tanks located off of CSX in GA. Cars are clean
- 2, 20K, DOT111 Tanks located off of UP in TX. Cars are clean
- 5, 20K, DOT111 Tanks located off of UP in TX. Cars were last used in Sulfuirc Acid. Free move available
- 108, 28.3K, 117R Tanks located off of All Class 1’s in St. Louis. Cars are clean
- 25, 28.3K, DOT111 Tanks located off of UP in Texas. Cars were last used in Biodiesel. Free move available. Dirty to dirty service.
- 47, 6500, Covered Hoppers located off of UP and BN in Iowa. Cars are clean
Sales Offers
- 100-200, 31.8K, CPC 1232 Tanks located off of BN in Chicago. Dirty/Clean
- 100, 28.3K, 117J Tanks located off of various class 1s in multiple locations.
- 110, 25.5K, DOT 111 Tanks located off of UP and BN in Moving. Dirty, Food Grade
Call PFL today to discuss your needs and our availability and market reach. Whether you are looking to lease cars, lease out cars, buy cars, or sell cars call PFL today at 239-390-2885
PFL offers turn-key solutions to maximize your profitability. Our goal is to provide a win/win scenario for all and we can handle virtually all of your railcar needs. Whether it’s loaded storage, empty storage, subleasing or leasing excess cars, filling orders for cars wanted, mobile railcar cleaning, blasting, mobile railcar repair, or scrapping at strategic partner sites, PFL will do its best to assist you. PFL also assists fleets and lessors with leases and sales and offers Total Fleet Evaluation Services. We will analyze your current leases, storage, and company objectives to draw up a plan of action. We will save Lessor and Lessee the headache and aggravation of navigating through this rapidly changing landscape.
PFL IS READY TO CLEAN CARS TODAY ON A MOBILE BASIS WE ARE CURRENTLY IN EAST TEXAS
Live Railcar Markets
| CAT | Type | Capacity | GRL | QTY | LOC | Class | Prev. Use | Offer | Note |
|---|