
“The biggest communication problem is we do not listen to understand. We listen to reply.”
— Stephen R. Covey
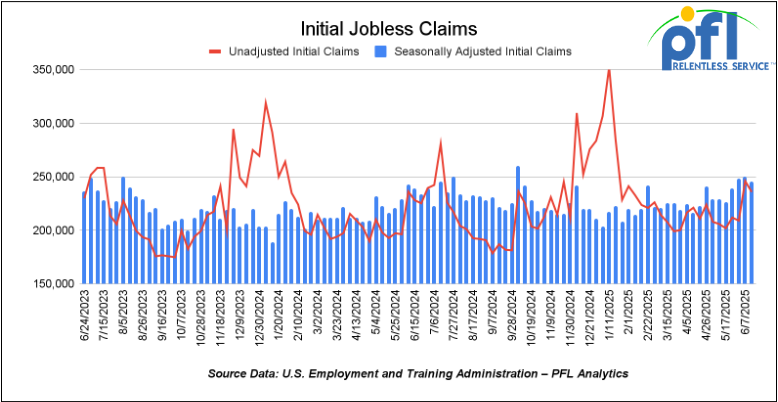
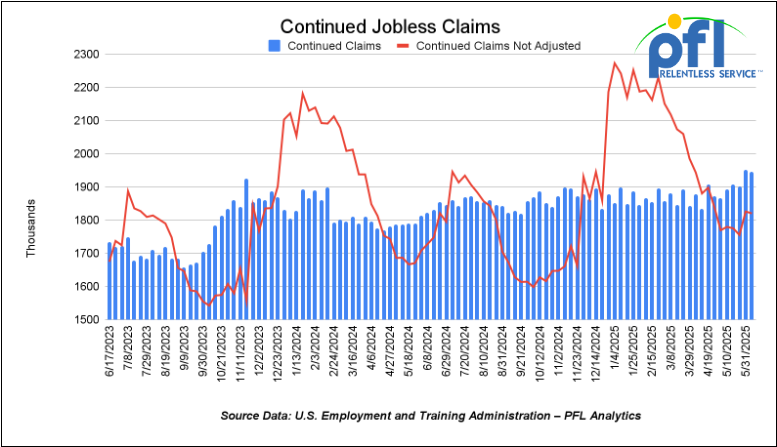
Jobs Update
- Initial jobless claims seasonally adjusted for the week ending June 14 came in at 245,000, down 5,000 people week over week week-over-week.
- Continuing jobless claims came in at 1.945 million people, versus the adjusted number of 1.951 million people from the week prior, down 6,000 people week-over-week.
Stocks closed mixed on Friday of last week and mixed week-over-week
The DOW closed higher on Friday of last week, up 35.16 points (0.08%), closing out the week at 42,206.82, up 9.03 points week-over-week. The S&P 500 closed lower on Friday of last week, down -13.03 points, and closed out the week at 5,967.84 down -9.13 points week-over-week. The NASDAQ closed lower on Friday of last week, down -98.86 points, and closed out the week at 19,447.41,up 40.58 points week-over-week.
In overnight trading, DOW futures traded lower and are expected to open at 42,561 this morning up 46 points from Friday’s close.
Crude oil closed lower on Friday of last week, but higher week-over-week.
West Texas Intermediate (WTI) crude closed down $0.21 per barrel (0.28%), to close at $74.93 per barrel on Friday of last week, but higher $1.95 per barrel week-over-week. Brent crude closed down $1.84 USD per barrel (-2.33%) on Friday of last week, to close at $77.01 per barrel, up $2.78 cents per barrel week-over-week.
One Exchange WCS (Western Canadian Select) for August delivery settled on Friday of last week at US$9.80 below the WTI-CMA (West Texas Intermediate – Calendar Month Average). The implied value was US$61.48 per barrel.
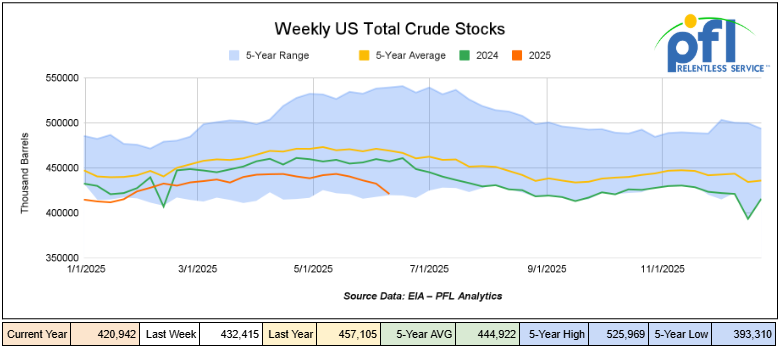
U.S. commercial crude oil inventories (excluding those in the Strategic Petroleum Reserve) a decrease of 11.5 million barrels week-over-week. At 420.9 million barrels, U.S. crude oil inventories are 10% below the five-year average for this time of year.
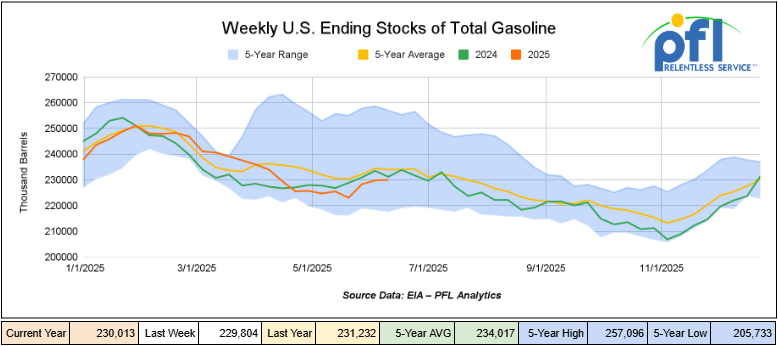
Total motor gasoline inventories increased by 200,000 barrels week-over-week and are 2% below the five-year average for this time of year.
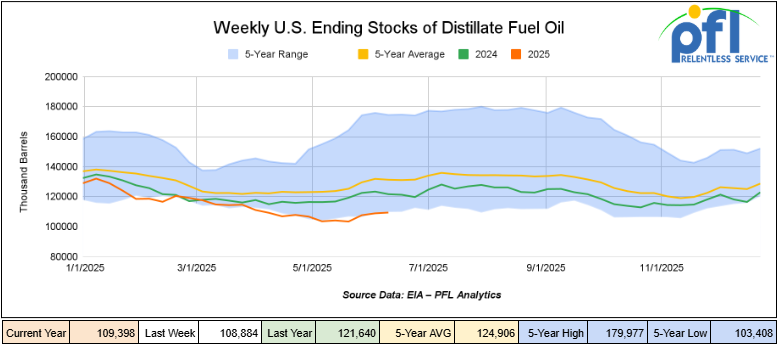
Distillate fuel inventories increased by 500,000 barrels last week and are 17% below the five-year average for this time of year.
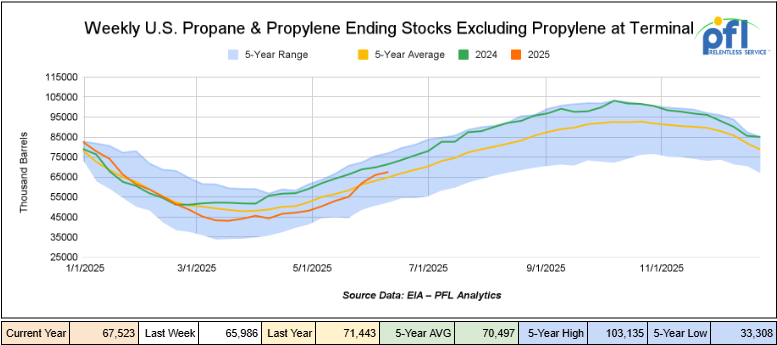
Propane/propylene inventories increased by 1.5 million barrels week-over-week and are 5% above the five-year average for this time of year.
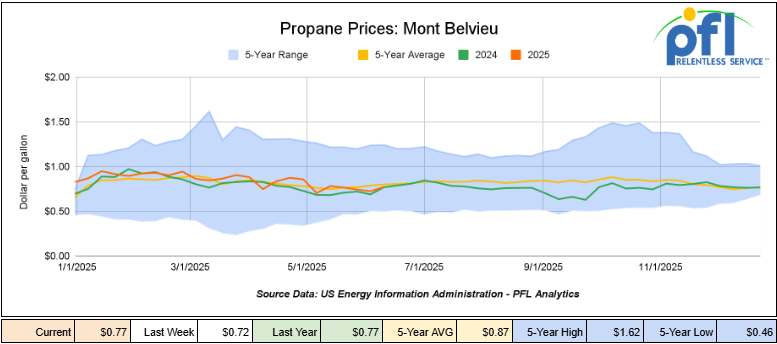
Propane prices closed at 77 cents per gallon on Friday of last week, up 5 cents per gallon week-over-week, but flat year-over-year.
Overall, total commercial petroleum inventories decreased by 6.6 million barrels during the week ending June 13th, 2025.
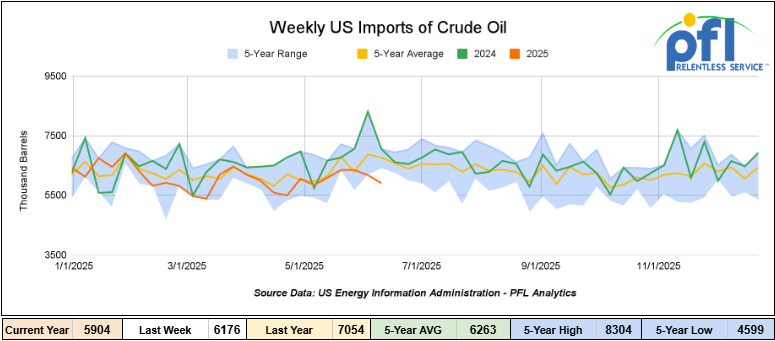
U.S. crude oil imports averaged 5.5 million barrels per day during the week ending June 13th, 2025, a decrease of 672,000 barrels per day week-over-week. Over the past four weeks, crude oil imports averaged 6.1 million barrels per day, 16.5% less than the same four-week period last year. Total motor gasoline imports (including both finished gasoline and gasoline blending components) averaged 960,000 barrels per day, and distillate fuel imports averaged 153,000 barrels per day during the week ending June 13th, 2025.
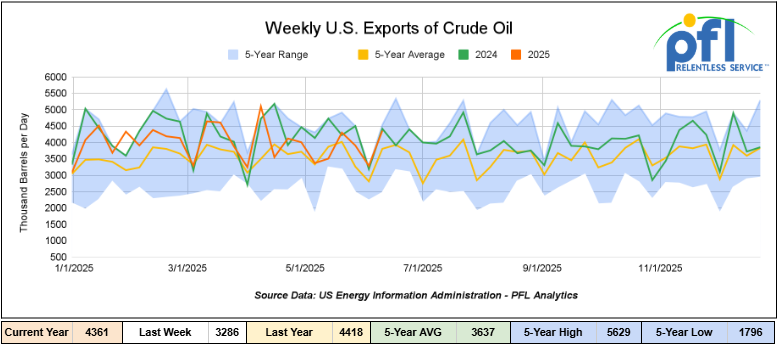
U.S. crude oil exports averaged 4.361 million barrels per day during the week ending June 13, 2025, an increase of 1.075 barrels per day week-over-week. Over the past four weeks, crude oil exports averaged 3.964 million barrels per day.
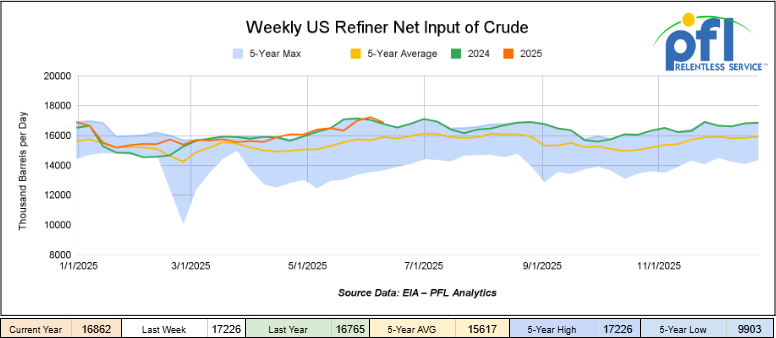
U.S. crude oil refinery inputs averaged 16.9 million barrels per day during the week ending June 13, 2025, which was 365 thousand barrels per day less week-over-week.
WTI is poised to open at $74.26, up 46 cents per barrel from Friday’s close.
North American Rail Traffic
Week Ending June 18, 2025.
Total North American weekly rail volumes were down (-4.55%) in week 25, compared with the same week last year. Total carloads for the week ending on June 18 were 320,749, up (1.95%) compared with the same week in 2024, while weekly intermodal volume was 315,196, down (-7.06%) compared to the same week in 2024.
8 of the AAR’s 11 major traffic categories posted year-over-year decreases. The largest decrease came from Forest Products, which was down (-14.23%), while the largest increase was from Grain, which was up (+3.69%).
In the East, CSX’s total volumes were down (-3.03%), with the largest decrease coming from Petroleum and Petroleum Products (-7.41%), while the largest increase came from Metallic Ores and Metals (+2.88%). NS’s volumes were up (+0.25%), with the largest increase coming from Petroleum and Petroleum Products (+24.94%), while the largest decrease came from Nonmetallic Minerals (-7.65%).
In the West, BN’s total volumes were down (-4.87%), with the largest increase coming from Other (+31.9%), while the largest decrease came from Coal (-35.51%). UP’s total rail volumes were down (-2.62%), with the largest increase coming from Coal (+15.6%), while the largest decrease came from Intermodal (-7.52%).
In Canada, CN’s total rail volumes were down (-15.06%) with the largest increase coming from Grain (+6.71%) while the largest decrease came from Intermodal (-37.8%). CPKCS’s rail volumes were down -20.59%, with the largest increase coming from Chemicals (+8.1%), while the largest decrease came from Forest Products (-69.02%).
Source Data: AAR – PFL Analytics
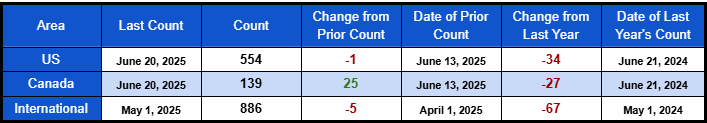
Rig Count
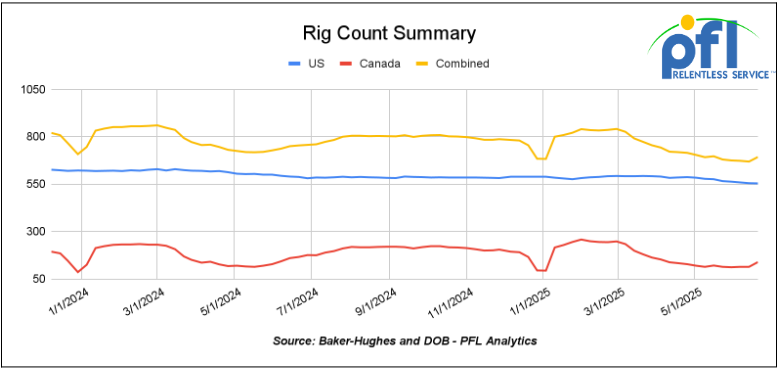
North American rig count was up by 24 rigs week-over-week. U.S. rig count was down -1 rigs week over week and down by -34 rigs year-over-year. The U.S. currently has 555 active rigs. Canada’s rig count was up 25 rigs week-over-week, but down by -27 rigs year-over-year. Canada currently has 139 active rigs. Overall, year-over-year, we are down by -61 rigs collectively.
North American Rig Count Summary
We are watching a few things out there for you:
We are watching the Middle East
As you know, over the weekend, the U.S. Struck Iran, taking out three nuclear sites in one of the most complicated military exercises carried out in modern military times. Iran immediately struck back at Israel and continues to do so. The two countries launched a fresh wave of strikes on each other overnight as Tehran’s top armed forces commander said the country “will never back down,” in a warning for the United States.
20 Israeli fighter jets struck Iranian military targets in Iran’s western city of Kermanshah and the capital, Tehran, according to an Israeli military official. The sites were reportedly used for missile storage and launching, satellite systems, and military radar sites, the source said. The Israel Defense Forces said the strikes took out “a number of surface-to-surface missile launch and storage sites aimed toward Israeli territory.” Israel also said it attacked six Iranian airports across the country overnight, destroying 15 fighter jets and helicopters.
Iran’s Foreign Minister is in Moscow today and said he will discuss Iran and Russia’s “common threats” in an upcoming meeting with President Vladimir Putin, according to Iranian state media. Additionally, Iran called for and received an emergency meeting to hear its case with the United Nations on Sunday, and called the American attacks on its infrastructure illegal.
We Are Watching Keyera
In a deal set to reshape Canada’s NGL landscape, Keyera Corp. announced last week that it is acquiring Plains All American’s Canadian NGL business for $5.15 billion in cash—one of the largest Canadian midstream transactions in years.
The acquisition gives Keyera coast-to-coast reach, a dominant position in NGL logistics, and expanded control over propane, butane, and condensate flows across Western Canada, Ontario, and into the U.S.
The Numbers:
- $5.15B cash purchase
- 193,000 bpd fractionation capacity
- 5.7 Bcf/d straddle gas processing (Empress hub)
- 23 million barrels of storage
- 1,500 + miles of pipelines
- Multiple rail and truck terminals
Keyera isn’t just buying assets – it’s buying position, optionality, and long-term margin stability. Over 70% of the post-deal margin will be tied to fee-for-service contracts, with nearly half under take-or-pay structures. It’s a strategic leap away from commodity exposure and toward locked-in cash flow.
Plains, meanwhile, exits the Canadian NGL space to double down on its U.S. crude oil focus.
Rail and Storage Ripple Effects
This deal will have consequences well beyond the balance sheets:
- Fort Saskatchewan: With control centralized under Keyera, expect changes to transload availability and switching dynamics.
- Ontario and U.S. corridors: Railcar flows could shift as downstream assets are integrated.
- West Coast exports: Keyera’s expanded tolling with AltaGas suggests more LPG heading to Asia—and potential pressure on car supply if demand spikes.
Strategic Advantage
This move positions Keyera to rival Pembina across the board. With infrastructure stretching from the Montney to Sarnia and export routes in both directions, the company is now a national NGL powerhouse and a core player in any long-haul LPG strategy.
What’s Next
- Summer 2025: Regulatory review and integration planning
- Fall 2025: Plains transitions operatorship
Q1 2026: Deal closes, $100M/year in expected synergies begin to unlock
We are watching our Ports
After months of intense import activity, spot ocean freight rates from Asia to the U.S. West Coast have fallen over 50% since early June. The Shanghai–West Coast rate dropped to around $5,025/FEU, down from highs above $10,000 earlier this year. The reason? Shippers pulled cargo forward to beat expected tariffs and that front-loaded demand is now tapering off.
Lower container volumes mean less freight moving inland by rail, as noted above in the latest and greatest intermodal numbers. This may not last. Tariff reviews and decisions are expected in July and August, and another import spike could quickly follow depending upon the outcome.
With lower intermodal volumes, shippers are using this moment to reposition equipment, secure storage, and get ahead of a possible next surge.
A few points to keep in mind:
- Non-Tank Car Railcar availability – easier to source now, but capacity may tighten quickly with another import surge.
- Storage-in-transit planning – we have seen loaded rail car storage a number of different commodities as shippers are hedging the best they can with increased volatility.
- West Coast port volumes – although traffic has softened could rebound sharply on tariff news.
- Fleet utilization – many are rebalancing to stay nimble but preparing and hopeful for a surge.
- Service velocity – with fewer bottlenecks, now is the time to move cars into strategic positions.
Stay tuned to PFL. We are watching this one closely and are here to work through any logistical problem you are facing in today’s ever-changing environment of uncertainty.
We are watching RINS and LCFS Credits
The EPA announced on Friday June 13 the new Renewable Volume Obligations (RVO) numbers. The numbers caught the market by surprise and is the highest level proposed since the program started –The proposal: 24.02 billion gallons in 2026 and 24.46 billion in 2027, up from 22.33 billion in 2025. D4 and D6 prices immediately responded. In an explosive session in RINS on Monday of last week, D4 RINS surged to close at $1.30 per RIN, up 15 cents per RIN from the previous Friday’s close. D6 RINS followed closely, and closed at $1.21 per RIN, up 13 and ½ cents per RIN from the previous Friday’s close.
By Friday of last week, the market settled down – D6 RINS closed out the day and the week at $1.08 per RIN, up ½ of a cent per RIN week-over-week. D4 RINS closed at $1.17 per RIN, up 2 cents per RIN week-over-week.

If finalized higher blending mandates = More renewable gallons = Greater rail and SIT use for ethanol and biodiesel = Increased demand for tank cars which are already tight due to costs of newbuilds, and retrofits will be required.
EPA’s proposal favors domestic production , pulling more barrels into the U.S. rail system. RIN traders are tracking these logistics moves closely as they align credit timing with physical flows. The BOHO spread has widened nearly 10¢, thanks to firmer soybean oil and heating oil futures.
Lawsuits and court challenges are certainly to follow. In related news, the EPA on Wednesday of last week published updated small refinery exemption (SRE) data, reporting that 20 new SRE petitions have been filed under the Renewable Fuel Standard during the past month. According to the agency, 189 SRE petitions are currently pending.
The newly filed SRE petitions include two filed for RFS compliance year 2019, two for RFS compliance year 2020, two for RFS compliance year 2021, four for RFS compliance year 2022, three for RFS compliance year 2023, and seven RFS compliance year 2024. CHS Laurel Refinery filed on SRE petition for its facility in Laurel, Montana, seeking a waiver of its 2024 RFS blending obligations. HF Sinclair Casper Refining filed three SRE petitions seeking waivers of the 2022, 2023 and 2024 blending obligations for its refinery in Casper, Wyoming. HF Sinclair Parco Refining, filed two SRE petitions seeking waivers of the 2022 and 2024 RFS blending obligations for its facility in Sinclair Wyoming. Meanwhile, HF Sinclair Wood Cross Refining filed one SRE petition seeking a waiver of the 2024 blending obligations for its facility in Woods Cross, Utah. Cross Oil Refining also filed a single SRE petition seeking a waiver of 2024 blending obligations for its refinery in Smackover, Arkansas. Suncor Denver East Refinery filed six SRE petitions seeking a waiver of the 2019, 2020, 2021, 2022, 2023 and 2024 blending obligations for its refinery in Commerce City, Colorado, while Suncor Denver West Refinery also filed six SRE petitions seeking a waiver of the 2019, 2020, 2021, 2022, 2023 and 2024 blending obligations for its facility in Commerce City, Colorado.
For more on the new proposed RVO and the impact it could have on your business, please call PFL today.
In other renewable news, on Friday of last week the U.S. Supreme Court sided with fuel producers that had opposed California’s standards for vehicle emissions and electric cars under a federal air pollution law, agreeing that their legal challenge to the mandates should not have been dismissed.
The justices in a 7-2 ruling that overturned a lower court’s decision to throw out a lawsuit initiated by Valero Energy, now sets a pathway for the case to be heard for fuel industry groups and refiners. The lower court had concluded that the plaintiffs lacked the required legal standing to challenge a 2022 U.S. Environmental Protection Agency decision under the direction of the Biden administration to let California set its own regulations. LCFS Credits in California have been on a steady decline due to increased renewable diesel production and refinery closures see below:

The California Air Resource Board (“CARB”) realizing that a decrease in the LCFS credit price is going to discourage investment in renewable fuels and the Green old deal is trying to increase those limits – pretty soon there wont be anymore refineries in the state and California is going to pay a dear price at the pump (if there is any of those left if things continue as is). There is certainly room for renewables. We love renewables – great for rail, great for farmers, great for fuel security and many more reasons but enough is enough time to be status quo and let things shake out and chill for a little while.
We are watching Class 1 Industry Headcount
Class I railroads employed 119,318 workers in the United States in May 2025, a -0.28% a decrease from April 2025’s count of 119,649 and a -2.61% year-over-year decrease from May 2024’s total of 122,518, according to Surface Transportation Board data.

Three of the six employment categories posted month-over-month increases between April and May 2025. These were Executives, officials, and staff assistants, up 1.27% to 7,963 workers; Maintenance of Way and Structures, up 0.83% to 29,088 workers; and Maintenance of Equipment and Stores, up 0.03% to 17,063 workers.
The categories that posted month-over-month decreases were Professional and Administrative, down -4.07% to 9,201 workers; Transportation (other than train and engine), down -0.92% to 4,979 workers; and Transportation (train and engine), down -0.47% to 51,024 workers.
Year-over-year, only one category posted an employment gain: Executives, officials, and staff assistants, up 0.59%.
Categories that registered year-over-year decreases in May 2025 were Professional and Administrative, down -7.10%; Maintenance of Way and Structures, down -0.55%; Maintenance of Equipment and Stores, down -4.28%; and Transportation (train and engine), down -3.06%.


We are Watching Key Economic Indicators
Industrial Output and Capacity Utilization
Manufacturing accounts for approximately 75% of total output. Manufacturing output in May was up 0.03% from April 2025.
Capacity utilization is a measure of how fully firms are using the machinery and equipment. Capacity utilization was down -0.10% from April to May.

Lease Bids
- 10, 2500CF Open Top Hoppers needed off of UP or BN in Texas for 5 years. Cars are needed for use in aggregate service. Need Rapid Discharge Doors
- 50, 5000CF Covered Hoppers needed off of UP or BN in Houston for 6 Month. Cars are needed for use in Fertilizer service. Needed ASAP
- 30-50, 6000cf Steel Hoppers needed off of CSX or NS in East for 5 Year. Cars are needed for use in petcoke service.
- 50, 23.5-25.5 DOT111 Tanks needed off of Any Class 1 in USA for 5 years. Cars are needed for use in Asphalt service.
- 20, 25.5k CPC 1232 Tanks needed off of UP, BN, CSX, NS in OK, TX, Northeast for 3 Year. Cars are needed for use in Asphalt service.
- 10, 30K 117R or 117J Tanks needed off of Any Class 1 in USA for 1 year. Cars are needed for use in Glycerin service.
- 15-20, 29K 117R Tanks needed off of NS or CSX in Ohio for 6-12 Months. Cars are needed for use in Ply Oil service.
- 20, 30K 117J Tanks needed off of UP or BN in Midwest for 5 Years. Cars are needed for use in Ethanol service.
- 100, 30K 117J Tanks needed off of BN in Montana for 2 years. Cars are needed for use in Crude service.
- 10, 25.5K Any Type Tanks needed off of CSX in Florida for 2 Years. Cars are needed for use in UCO service.
- 10, 25.5K Any Type Tanks needed off of Any Class 1 in Any Location for 3-12 months. Cars are needed for use in Asphalt service.
- 6, 30K 117R or 117J Tanks needed off of Any Class 1 in USA for 1 year. Cars are needed for use in Av Gas service.
- 10, 25.5K-30K 117R or 117J Tanks needed off of UP or BN in Texas for 1 year. Cars are needed for use in Dicyclopentadiene service.
- 70, 30K DOT 117R/ DOT 117J Tanks needed off of UP in Corpus Christi for 5 Year. Cars are needed for use in Gasoline service.
- 20, 28.3K 117J Tanks needed off of BN in Montana for 2 years. Cars are needed for use in Crude service.
Sales Bids
- 28, 3400CF Covered Hoppers needed off of UP BN in Texas. Cars are needed for use in Cement service. Cement Gates needed.
- 20, 17K DOT111 Tanks needed off of various class 1s in various locations. Cars are needed for use in corn syrup service.
Lease Offers
- 60, 4750, Covered Hoppers located off of UP or BN in Eads, CO. Cars are clean UP to 5 Years, 3 Hopper, Gravity Gate, Trough Hatches
- 100, 6250, Covered Hoppers located off of UP in US . Cars were last used in DDG. 1 Year term. Dirty to Dirty. Free move on UP.
- 50, 33K, 400W Pressure Tanks located off of All Class 1s in US and Canada. Cars were last used in Propane. Summer or Longer Lease Available.
- 50, 29K , DOT 111 Tanks located off of CN in Hamilton, ON. Cars were last used in Biodiesel. 1 year +
- 20-25, 30K, 117J Tanks located off of BNSF in West Texas. Cars were last used in Ethanol. 1 year minimum
- 24, 25.5K-30K, DOT 111 Tanks located off of UP or BN in Texas. Cars were last used in Base Oils. 1-2 Year
- 25-50, 19.6K, DOT 111 Tanks located off of UP in US. Cars were last used in Molases .
- 10, 30, 117R Tanks located off of CN in Wisconsin. Cars were last used in Gasoline. Multiyear
- 33, 30, 117R Tanks located off of UP in Gulf. Cars are clean Multiyear
- 50, 30, 117R Tanks located off of UP in Gulf. Cars were last used in Diesel. Multiyear
- 120, 29.8K, 117R/117J Tanks located off of CPKC in MN. Cars were last used in Ethanol.
- 50, 20K, DOT 111 Tanks located off of UP or BN in Wichita Falls, TX. Cars were last used in HCL.
- 50-100, 117R/117J Tanks located off of CN, CP, UP, CSXT in Various. Cars were last used in Biodiesel. Summer – 4 months
- 50-100, 117R/117J Tanks located off of CN, CP, UP, CSXT in Various. Cars were last used in Diesel . Summer – 4 months
Sales Offers
- 21, 50′, Plate C Boxcars located off of various class 1s in NM. End of Life
- 3, 50′, Plate C Boxcars located off of various class 1s in multiple locations. End of Life
- 27, 50′, Plate C Boxcars located off of various class 1s in PQ. End of Life
- 100-300, 3250, Covered Hoppers located off of various class 1s in multiple locations. Sand Cars
- 5, 2740, Mill Gondolas located off of various class 1s in NC. End of Life
- 1, 2260, Mill Gondolas located off of various class 1s in AL. End of Life
- 30, 2740, Mill Gondolas located off of various class 1s in multiple locations. End of Life
- 21, 2740, Mill Gondolas located off of various class 1s in WA. End of Life
- 15, 4750, Covered Hoppers located off of various class 1s in multiple locations. End of Life
- 5, 4750, Covered Hoppers located off of various class 1s in multiple locations. End of Life
- 50-100, 31.8K, CPC 1232 Tanks located off of UP or BN in TX. Requal Due in 2025
Call PFL today to discuss your needs and our availability and market reach. Whether you are looking to lease cars, lease out cars, buy cars, or sell cars call PFL today at 239-390-2885
Live Railcar Markets
| CAT | Type | Capacity | GRL | QTY | LOC | Class | Prev. Use | Offer | Note |
|---|
PFL will be at the Following Conferences

- Where: La Quinta, CA
- Attending: David Cohen (954-729-4774)
- Conference Website

- Where: Hyatt Regency Dallas in Dallas, TX
- Attending:Curtis Chandler (239.405.3365), David Cohen (954-729-4774), Brian Baker (239.297.4519), Cyndi Popov(403) 402-5043
- Conference Website