
“Do not wait to strike till the iron is hot; but make it hot by striking.” – William Butler Yeats
Jobs Update
- Initial jobless claims seasonally adjusted for the week ending June 7 came in at 248,000, flat week-over-week.
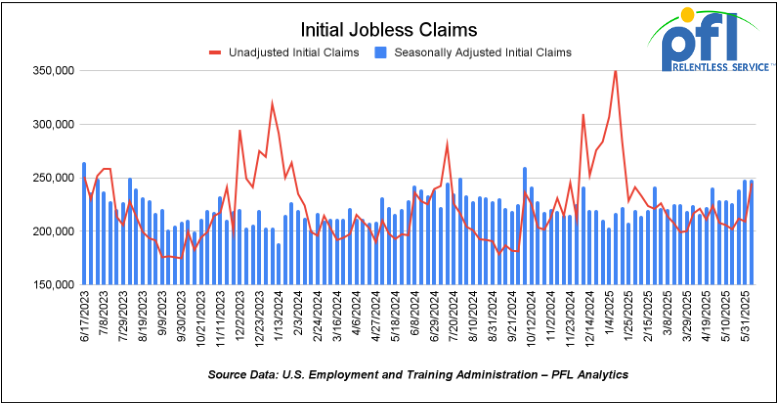
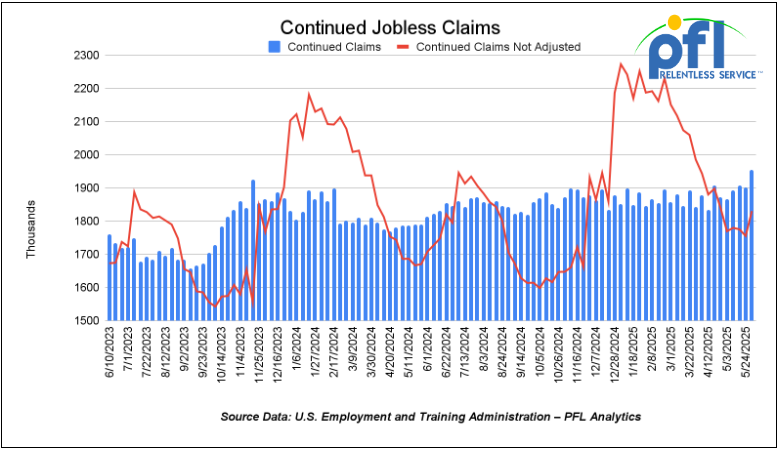
- Continuing jobless claims came in at 1.956 million people, versus the adjusted number of 1.902 million people from the week prior, up 54,000 people week-over-week.
Stocks closed lower on Friday of last week and lower week-over-week
Wall Street plummeted on Friday of last week, giving up all its gains for the week and ending in the red. The decline was almost single-handedly due to a sharp escalation between Israel and Iran, with both countries trading missile strikes and stoking concerns of an all-out war in the Middle East.
The DOW closed lower on Friday of last week, up -769.83 points (-1.79%), closing out the week at 42,197.79, down -565.09 points week-over-week. The S&P 500 closed lower on Friday of last week, down -68.29 points, and closed out the week at 5,976.97 down -239.39 points week-over-week. The NASDAQ closed lower on Friday of last week, down -23.39 points, and closed out the week at 19,406.83, down -123.12 points week-over-week.
In overnight trading, DOW futures traded higher and are expected to open at 42,357 this morning up 150 points from Friday’s close.
Crude oil closed higher on Friday of last week and higher week-over-week.
West Texas Intermediate (WTI) crude closed up $4.94 per barrel (7.62%), to close at $72.98 per barrel on Friday of last week and up $8.39 per barrel week-over-week. Brent crude closed up $4.87 USD per barrel (7.02%) on Friday of last week, to close at $74.23 per barrel, up $7.76 cents per barrel week-over-week.
One Exchange WCS (Western Canadian Select) for July delivery settled on Friday of last week at US$8.90 below the WTI-CMA (West Texas Intermediate – Calendar Month Average). The implied value was US$64.08 per barrel.
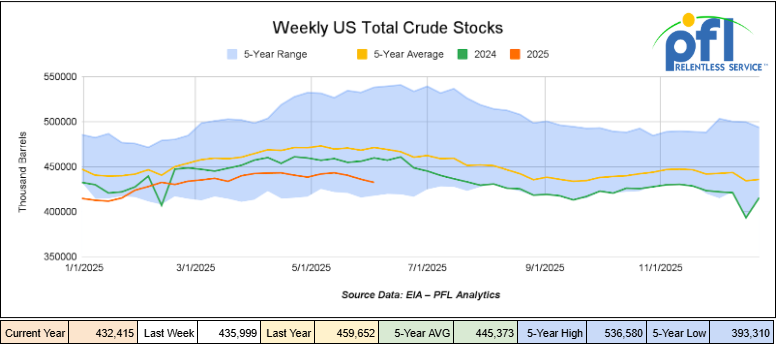
U.S. commercial crude oil inventories (excluding those in the Strategic Petroleum Reserve) decreased by 3.6 million barrels week-over-week. At 432.4 million barrels, U.S. crude oil inventories are 8% below the five-year average for this time of year.
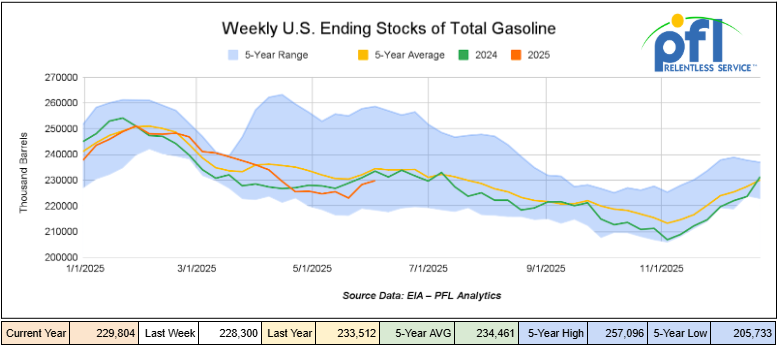
Total motor gasoline inventories increased by 1.5 million barrels week-over-week and are 2% below the five-year average for this time of year.
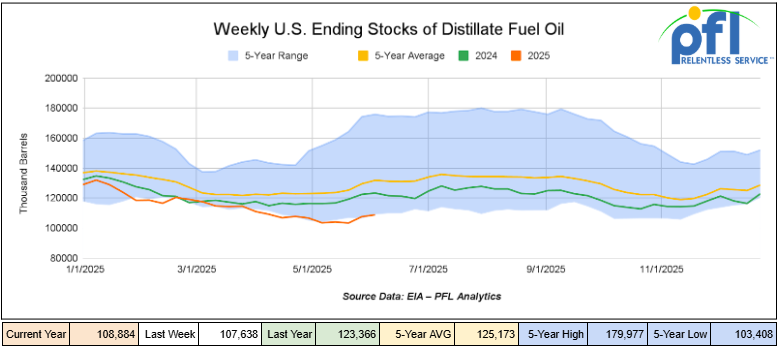
Distillate fuel inventories increased by 1.2 million barrels week-over-week and are 17% below the five-year average for this time of year.
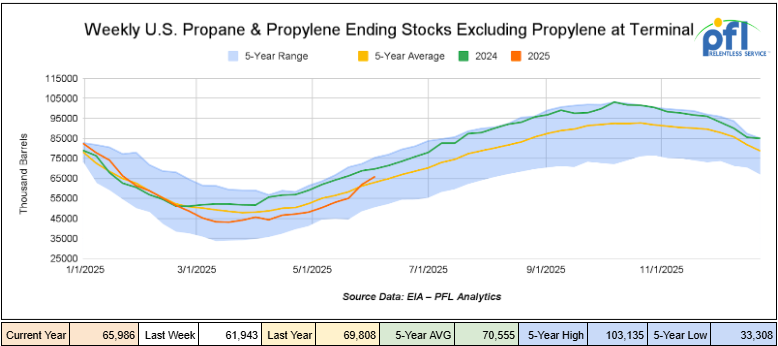
Propane/propylene inventories increased by 4 million barrels week-over-week and are 6% above the five-year average for this time of year.
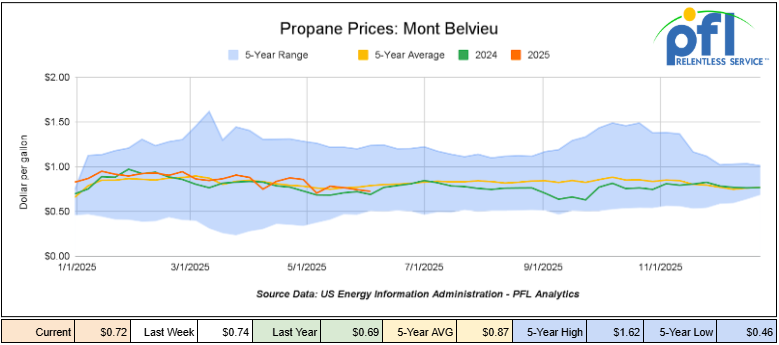
Propane prices closed at 72 cents per gallon on Friday of last week, down 2 cents per gallon week-over-week, but up 3 cents per gallon year-over-year.
Overall, total commercial petroleum inventories increased by 6.2 million barrels during the week ending June 6th, 2025.
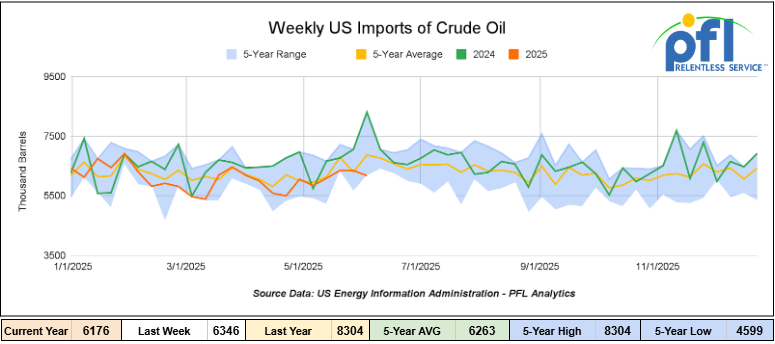
U.S. crude oil imports averaged 6.2 million barrels per day during the week ending June 6th, 2025, a decrease of 170,000 barrels per day week-over-week. Over the past four weeks, crude oil imports averaged 6.2 million barrels per day, 13.3% less than the same four-week period last year. Total motor gasoline imports (including both finished gasoline and gasoline blending components) averaged 914,000 barrels per day, and distillate fuel imports averaged 104,000 barrels per day during the week ending June 6th, 2025.
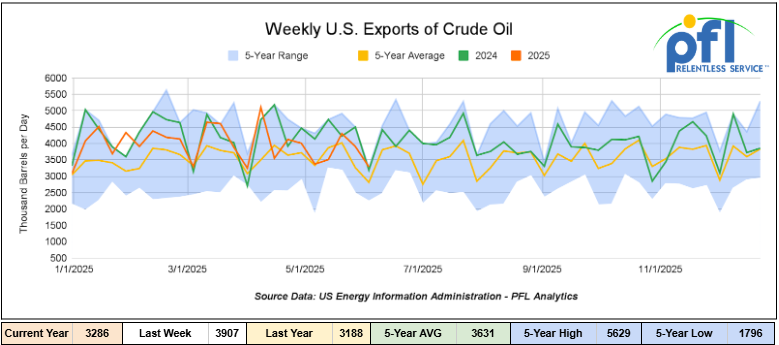
U.S. crude oil exports averaged 3.286 million barrels per day during the week ending June 6, 2025, a decrease of 621,000 barrels per day week-over-week. Over the past four weeks, crude oil exports averaged 3.750 million barrels per day.
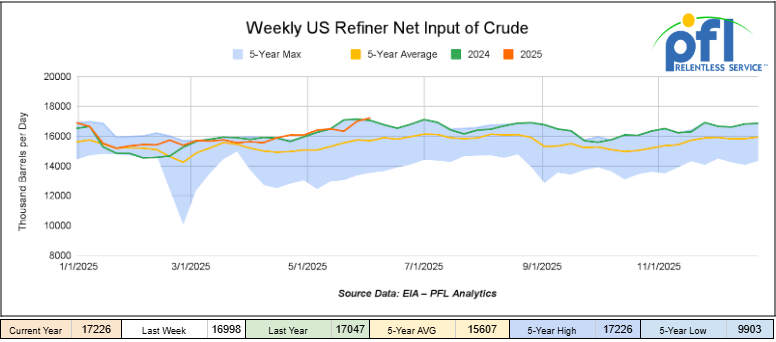
U.S. crude oil refinery inputs averaged 17.2 million barrels per day during the week ending June 6, 2025, which was 228,000 barrels per day more week-over-week.
WTI is poised to open at $72.50, down 48 cents per barrel from Friday’s close.
North American Rail Traffic
Week Ending June 11, 2025.
Total North American weekly rail volumes were down (-3.31%) in week 24, compared with the same week last year. Total carloads for the week ending on June 11 were 322,686, up (0.29%) compared with the same week in 2024, while weekly intermodal volume was 315,022, down (-6.74%) compared to the same week in 2024.
6 of the AAR’s 11 major traffic categories posted year-over-year decreases. The largest decrease came from Forest Products, which was down (-15.03%), while the largest increase was from Grain, which was up (+10.03%).
In the East, CSX’s total volumes were down (-2.26%), with the largest decrease coming from Metallic Ores and Metals(-17.73%), while the largest increase came from Grain (+23.09%). NS’s volumes were up (+1.09%), with the largest increase coming from Grain (+25.81%), while the largest decrease came from Chemicals (-5.55%).
In the West, BN’s total volumes were down (-7.31%), with the largest increase coming from Other (+19.95%), while the largest decrease came from Coal (-40.15%). UP’s total rail volumes were up (+0.92%), with the largest increase coming from Coal (+32.7%), while the largest decrease came from Petroleum and Petroleum Products (-7.4%).
In Canada, CN’s total rail volumes were down (-6.46%) with the largest increase coming from Grain (79.25%) while the largest decrease came from Coal (-40.15%). CPKCS’s rail volumes were down -20.11%, with the largest increase coming from Nonmetallic Minerals (23.43%) while the largest decrease came from Forest Products (-69.85%).
Source Data: AAR – PFL Analytics
Rig Count
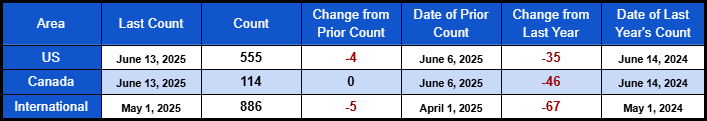
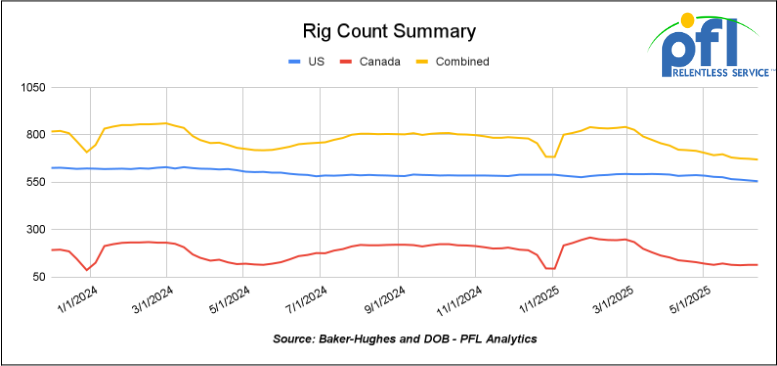
North American rig count was down by -4 rigs week-over-week. U.S. rig count was down -4 rigs week over week and down by -35 rigs year-over-year. The U.S. currently has 555 active rigs. Canada’s rig count was flat week-over-week, but down by -46 rigs year-over-year. Canada currently has 114 active rigs. Overall, year-over-year, we are down by -81 rigs collectively.
North American Rig Count Summary
We are watching a few things out there for you:
We are watching the Middle East
As you are aware, early Friday morning of last week, Israel launched a targeted strike on Iranian nuclear and military infrastructure, and Iran almost immediately retaliated and continues to do so. The impact fallout was immediate: stock markets crumbled, crude prices jumped, freight costs rose, and risk models across the energy and logistics sectors were reassessed.
PFL participated in the Dow Jones Risk & Research webinar on Friday afternoon of last week, “What Israel’s Attack on Iran Means for Business and Markets,” featuring leading analysts from OPIS, Oxford Analytica, and Dragonfly Intelligence. Combined with market data, here’s what you or your team needs to know:
1. Geopolitical Risk: Calculated Escalation, Not Full War:
- Experts believe Iran will not close the Strait of Hormuz, the global oil chokepoint, to avoid damaging its own interests.
- The U.S. was reportedly informed in advance but is publicly distancing itself. So far, no external powers are stepping into the conflict directly.
- Iran’s proxies will not get involved – too much risk for them.
Bottom Line: Global actors appear keen to limit this to a regional flashpoint, not a broader conflict zone but it will be up to Iran at the end of the day.
2. Oil Markets: Cost Rises with an Eye on Hormuz:
- Approximately 20 million barrels daily (~20% of global oil) transit the Strait of Hormuz – a fact markets flagged immediately.
- Oil prices surged ~6–14% intraday on Friday of last week, with Brent peaking near $78 and WTI touching $77 before settling in the mid-$70s.
- Analysts estimate a disruption of Hormuz trade could send prices soaring toward $140 per barrel.
- On Friday, there was no confirmed damage to Iranian oil infrastructure, but all that changed over the weekend as the largest natural gas field in the world was struck by an Israeli drone, halting production temporarily, and oil storage depots were also hit in Tehran. Tension remains high.
3. LNG: Quiet Response, But Vulnerable
- LNG flows, like oil, rely heavily on Hormuz – nearly 20% of global LNG uses that route.
- European natural gas prices jumped to a 10 – week high on Friday of last week, with more upside risk if conflict persists.
- Although less dramatic than oil, LNG exposure is real and could affect buyers worldwide if disruptions persist.
4. Freight & Logistics: Risk Premiums and Route Shifts:
- Freight operators are already weaving in risk premiums for vessels passing near the Gulf.
- Expect increased shipping costs for crude, LNG, containers, auto parts, and chemicals, especially with potential reroutes via Suez.
- The webinar consensus is: “Bullish on freight”—with surging bunker fuel and insurance costs front and center.
5. Chemicals & Commodities: Sourcing and Trade Flows Under Pressure:
- Polymer volumes may be rerouted or suspended due to regionally elevated risk.
- Benzene and derivatives could shift to western Saudi export hubs.
- Existing trade diversions, even from tariff changes, offer only limited insulation. Cost pressure is mounting.
6. Additional Risk Layers to Monitor:
- Cyber threats: Iranian cyberattacks are expected—reports already note interference with Israeli government apps.
- Shadow fleet tankers: Iran’s sanction-evasion fleet accounts for <5% of global oil trade—but could draw scrutiny and enforcement.
- China’s response: As a key trade partner of Iran, its next policy move could influence both the oil and export trajectory.
Final Take- What to Watch:
Israel’s June 13th strike on Iran was swift, but is ongoing; its ripple effects could stretch for weeks or months. Crude prices have spiked according to the experts, but anything can happen. Freight rates are climbing. Supply chains are shifting in real time. While this isn’t the start of a global conflict, it could mark the beginning of a more fragile and risk-exposed phase for global trade.
At PFL, we’re watching this situation unfold hour by hour. We’re in contact with our network, market sources, and logistics partners to keep clients informed and equipped to adapt.
We are watching Petroleum Carloads
The four-week rolling average of petroleum carloads carried on the six largest North American railroads rose to 27,762 from 27,618 which was an increase of +144 rail cars week-over-week. Canadian volumes were higher. CPKC’s shipments were higher by +9.0% week over week, CN’s volumes were higher by +13.0% week-over-week. U.S. shipments were mixed. The NS had the largest percentage increase and was up by +13.0%. The CN had the largest decrease and was down by -4.0%.
We are Watching Alberta – G7 Summit and the World Economic Forum
With the G7 Summit happening over the weekend and through Tuesday of this week in Kananaskis, Alberta, Canada, and World Economic Forum-affiliated events that took place in Calgary, Alberta, Canada last week, Alberta has taken center stage in global conversations about energy, infrastructure, and climate strategy. These high-profile gatherings have drawn attention not only to geopolitical priorities, but also to Canada’s evolving perceived role in balancing its left-wing environmental commitments at the same time trying to appease Western Canada with energy security and industrial growth.
The newly elected Canadian federal government used this platform to try to position Canada as a “clean and conventional energy superpower.” Alberta’s carbon capture efforts, LNG development, and growing relevance in critical minerals were all highlighted as key to that future. The message was: Canada’s path forward is not about choosing between traditional energy and clean tech – it’s about building both at the same time. It’s all chatter right now by the federal government, but we will see what happens.
What This Could Mean for Rail, Energy, and Industrial Stakeholders:
For those in rail, logistics, and energy infrastructure, these conversations are hopefully more than headlines and lip service, as we have seen from Canadian Federal Liberal leaders for the past 10 years but hopefully – they’re early indicators of real shifts in policy, investment, and operational efficiencies.
Key takeaways from the week include:
Carbon capture and storage (CCS) seems to be moving into the implementation phase if the Premier of Alberta gets her way. Projects like Alberta’s proposed CO₂ pipeline will require material movement, staging, and long-term logistical support.
- Critical minerals like lithium and potash should drive new demand for bulk transport, storage, and terminal services.
- Clean fuel strategies, including LNG, are pushing forward with a focus on global export readiness—relying on scalable, cross-border transportation networks. This is happening despite the Canadian Federal Government headwinds projects faced to get to this point, as reported in last week’s rail report.
- Scope 3 emissions (supply chain-related emissions) are under growing scrutiny. Rail’s significantly lower emissions profile compared to long-haul trucking puts it in a stronger position as companies face pressure from the Canadian Federal government to decarbonize their operations.
- Trade risks and carbon tariffs are pushing Canadian producers to double down on infrastructure and domestic reliability, making the case for secure, efficient transport systems even more urgent.
- The Alberta government and OPEC are aligned on a vision of the future that requires more investment in oil supply to ensure future demand is met and prices remain stable, OPEC Secretary General Haitham Al Ghais told the Global Energy Show audience in Calgary on Tuesday of last week.
They are also aligned on the need to decarbonize the oil supply while investing in new energy to meet future demand, Al Ghais said.
“We believe there is great potential to increase co-operation between Alberta and OPEC. We have a lot in common; we’re trying to reach the same objectives.”
Alberta and OPEC have a long history of collaborating on energy issues, stretching back to 1989, said Al Ghais. They also worked together during the pandemic to manage supplies.
OPEC expects oil demand will reach 120 million barrels per day by 2050, up from approximately 100 million barrels today, said Al Ghais, who attended the event at the invitation of Alberta Premier Danielle Smith.
OPEC and Alberta are aligned, he said, on the need to continue to invest to grow supply to keep costs affordable and stable.
“There is no peak in oil demand on the horizon,” he said, adding that over $17.4 trillion will need to be invested by 2050, or $640 billion annually, to meet forecasted demand.
He credited Alberta with being a global leader in CCUS (Carbon Capture, Utilization, and Storage) and said all OPEC members are also investing in the technology to decarbonize supply.
Canadian Industry voices at the Global Energy Show – including MEG Energy, E3 Lithium, and Alberta government officials – reinforced a shared theme: Canada cannot lead on energy transition, without maintaining the strength of its conventional resource base. At least the left agrees with the right on something!
- Without predictable policies and streamlined permitting, major energy and infrastructure projects won’t get built.
- If production is discouraged, companies won’t be able to reinvest in the technologies that support decarbonization.
- And, if Canada isn’t exporting lower-carbon alternatives like LNG to global markets, the global emissions problem doesn’t get solved – it just shifts somewhere else.
While PFL wasn’t directly involved in the G7 or WEF events, our Calgary-based office puts us close to the ground and even closer to the evolving needs of our customers. As infrastructure ramps up, fleet strategies tighten, and sustainability pressures grow, we’re focused on helping clients stay agile and ahead of the curve.
If you’d like to explore how these developments could impact your operations or logistics strategy, please call PFL today.
We are Watching Key Economic Indicators
Producer Price Index
In May 2025, the U.S. Producer Price Index (PPI) rose by 0.1% month over month, reversing a 0.2% decline in April. On an annual basis, wholesale inflation remained steady. Core PPI—which excludes food, energy, and trade services—increased by 0.1%, after a 0.1% drop the previous month. The increase was driven primarily by a 0.2% rise in goods prices, including a 0.1% increase in food – energy prices were flat month over month. Goods excluding food and energy rose 0.2%. Services prices rose 0.1%, supported by a 0.4% increase in trade margins, though transportation and warehousing declined by 0.2%. Prices for services excluding trade, transportation, and warehousing were unchanged.
The Consumer Price Index (CPI) increased by 0.1% month over month in May, easing from a 0.2% rise in April. Over the past 12 months, the all-items index rose 2.4% before seasonal adjustment, up slightly from 2.3% in April. Core CPI, which excludes food and energy, also rose 0.1% over the month, down from 0.2% in April, bringing the annual core inflation rate to 2.8%.

Lease Bids
- 10, 2500CF Open Top Hoppers needed off of UP or BN in Texas for 5 years. Cars are needed for use in aggregate service. Need Rapid Discharge Doors
- 50, 5000CF Covered Hoppers needed off of UP or BN in Houston for 6 Month. Cars are needed for use in Fertilizer service. Needed ASAP
- 30-50, 6000cf Steel Hoppers needed off of CSX or NS in East for 5 Year. Cars are needed for use in petcoke service.
- 50, 23.5-25.5 DOT111 Tanks needed off of Any Class 1 in USA for 5 years. Cars are needed for use in Asphalt service.
- 20, 25.5k CPC 1232 Tanks needed off of UP, BN, CSX, NS in OK, TX, Northeast for 3 Year. Cars are needed for use in Asphalt service.
- 10, 30K 117R or 117J Tanks needed off of Any Class 1 in USA for 1 year. Cars are needed for use in Glycerin service.
- 15-20, 29K 117R Tanks needed off of NS or CSX in Ohio for 6-12 Months. Cars are needed for use in Ply Oil service.
- 20, 30K 117J Tanks needed off of UP or BN in Midwest for 5 Years. Cars are needed for use in Ethanol service.
- 100, 30K 117J Tanks needed off of BN in Montana for 2 years. Cars are needed for use in Crude service.
- 10, 25.5K Any Type Tanks needed off of CSX in Florida for 2 Years. Cars are needed for use in UCO service.
- 10, 25.5K Any Type Tanks needed off of Any Class 1 in Any Location for 3-12 months. Cars are needed for use in Asphalt service.
- 6, 30K 117R or 117J Tanks needed off of Any Class 1 in USA for 1 year. Cars are needed for use in Av Gas service.
- 10, 25.5K-30K 117R or 117J Tanks needed off of UP or BN in Texas for 1 year. Cars are needed for use in Dicyclopentadiene service.
- 70, 30K DOT 117R/ DOT 117J Tanks needed off of UP in Corpus Christi for 5 Year. Cars are needed for use in Gasoline service.
- 20, 28.3K 117J Tanks needed off of BN in Montana for 2 years. Cars are needed for use in Crude service.
Sales Bids
- 28, 3400CF Covered Hoppers needed off of UP BN in Texas. Cars are needed for use in Cement service. Cement Gates needed.
- 20, 17K DOT111 Tanks needed off of various class 1s in various locations. Cars are needed for use in corn syrup service.
Lease Offers
- 60, 4750, Covered Hoppers located off of UP or BN in Eads, CO. Cars are clean UP to 5 Years, 3 Hopper, Gravity Gate, Trough Hatches
- 100, 6250, Covered Hoppers located off of UP in US . Cars were last used in DDG. 1 Year term. Dirty to Dirty. Free move on UP.
- 50, 33K, 400W Pressure Tanks located off of All Class 1s in US and Canada. Cars were last used in Propane. Summer or Longer Lease Available.
- 50, 29K , DOT 111 Tanks located off of CN in Hamilton, ON. Cars were last used in Biodiesel. 1 year +
- 20-25, 30K, 117J Tanks located off of BNSF in West Texas. Cars were last used in Ethanol. 1 year minimum
- 24, 25.5K-30K, DOT 111 Tanks located off of UP or BN in Texas. Cars were last used in Base Oils. 1-2 Year
- 25-50, 19.6K, DOT 111 Tanks located off of UP in US. Cars were last used in Molases .
- 10, 30, 117R Tanks located off of CN in Wisconsin. Cars were last used in Gasoline. Multiyear
- 33, 30, 117R Tanks located off of UP in Gulf. Cars are clean Multiyear
- 50, 30, 117R Tanks located off of UP in Gulf. Cars were last used in Diesel. Multiyear
- 120, 29.8K, 117R/117J Tanks located off of CPKC in MN. Cars were last used in Ethanol.
- 50, 20K, DOT 111 Tanks located off of UP or BN in Wichita Falls, TX. Cars were last used in HCL.
- 50-100, 117R/117J Tanks located off of CN, CP, UP, CSXT in Various. Cars were last used in Biodiesel. Summer – 4 months
- 50-100, 117R/117J Tanks located off of CN, CP, UP, CSXT in Various. Cars were last used in Diesel . Summer – 4 months
Sales Offers
- 21, 50′, Plate C Boxcars located off of various class 1s in NM. End of Life
- 3, 50′, Plate C Boxcars located off of various class 1s in multiple locations. End of Life
- 27, 50′, Plate C Boxcars located off of various class 1s in PQ. End of Life
- 100-300, 3250, Covered Hoppers located off of various class 1s in multiple locations. Sand Cars
- 5, 2740, Mill Gondolas located off of various class 1s in NC. End of Life
- 1, 2260, Mill Gondolas located off of various class 1s in AL. End of Life
- 30, 2740, Mill Gondolas located off of various class 1s in multiple locations. End of Life
- 21, 2740, Mill Gondolas located off of various class 1s in WA. End of Life
- 15, 4750, Covered Hoppers located off of various class 1s in multiple locations. End of Life
- 5, 4750, Covered Hoppers located off of various class 1s in multiple locations. End of Life
- 50-100, 31.8K, CPC 1232 Tanks located off of UP or BN in TX. Requal Due in 2025
Call PFL today to discuss your needs and our availability and market reach. Whether you are looking to lease cars, lease out cars, buy cars, or sell cars call PFL today at 239-390-2885
Live Railcar Markets
| CAT | Type | Capacity | GRL | QTY | LOC | Class | Prev. Use | Offer | Note |
|---|
PFL will be at the Following Conferences

- Where: La Quinta, CA
- Attending: David Cohen (954-729-4774)
- Conference Website

- Where: Hyatt Regency Dallas in Dallas, TX
- Attending:Curtis Chandler (239.405.3365), David Cohen (954-729-4774), Brian Baker (239.297.4519), Cyndi Popov(403) 402-5043
- Conference Website