“Success depends upon previous preparation and without such preparation, there is sure to be failure.” – Confucius
COVID 19 and Markets Update
In the United States, we currently have 2,135,309 confirmed COVID 19 cases and 117,426 confirmed deaths
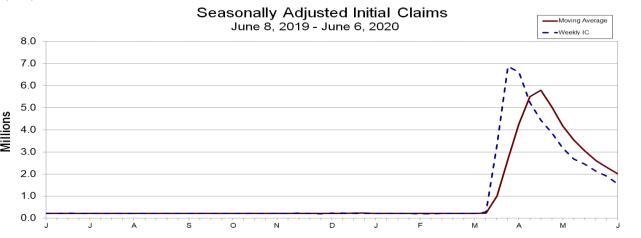
On Thursday of last week, according to the Labor Department, U.S. workers filed an additional 1.5 million jobless claims, bringing the total losses since the coronavirus pandemic to 44 million.

In a news release on June 10th by the Organization for Economic Co-operation and Development (OECD)it was said that the Global economy faces a tightrope walk to recovery from COVID-19. If a second outbreak occurs, world economic output is forecasted to plummet 7.6% this year, before climbing back 2.8% in 2021. At its peak, unemployment in the OECD economies would be more than double the rate prior to the outbreaks, with little recovery in jobs next year.
Even if a second wave of infections is avoided, global economic activity is expected to fall by 6% in 2020 and OECD unemployment to climb to 9.2% from 5.4% in 2019.
The economic impact of strict and relatively lengthy lockdowns in Europe will be particularly harsh. Euro area GDP is expected to plunge by 11 ½% this year if a second wave breaks out, and by over 9% even if a second hit is avoided, while GDP in the United States will take a hit of 8.5% and 7.3% respectively, and Japan 7.3% and 6%. Emerging economies such as Brazil, Russia and South Africa, meanwhile, face particular challenges of strained health systems, adding to the difficulties caused by a collapse in commodity prices, and their economies plunging by 9.1%, 10%, and 8.2% respectively in case of a double hit scenario, and 7.4%, 8% and 7.5% in case of a single hit. China’s and India’s GDPs will be relatively less affected, with a decrease of 3.7% and 7.3% respectively in case of a double hit and 2.6% and 3.7% in case of a single hit.
The DOW surged on Friday closing up 477.37 points (or 1.9%) to close out the week at 25,605.54 after a dramatic sell off just the day before where the DOW lost 1,861 points on the day. For the week, the Dow and S&P 500 lost 5.5% and 4.7%, respectively, while the Nasdaq shed 2.3%. All three major indexes notched their worst week since March 20. In overnight trading, DOW futures traded lower and as of the writing of this report is expected to open down 658 points.
West Texas Intermediate (WTI) crude for July delivery closed down $0.08 per barrel, to settle at $36.26 a barrel on the New York Mercantile Exchange on Friday of last week. Oil just had its worst week since April, snapping a six week winning streak. Chinese Coronavirus resurgence fears remain a real concern for oil markets after causing unprecedented demand destruction throughout March and April.
Brent crude futures settled up $0.18, US$38.23 per barrel on Friday of last week.
Oil is lower in overnight trading and as of the writing of this report, WTI is poised to open at $35.33 down 93 cents per barrel from Friday’s close.
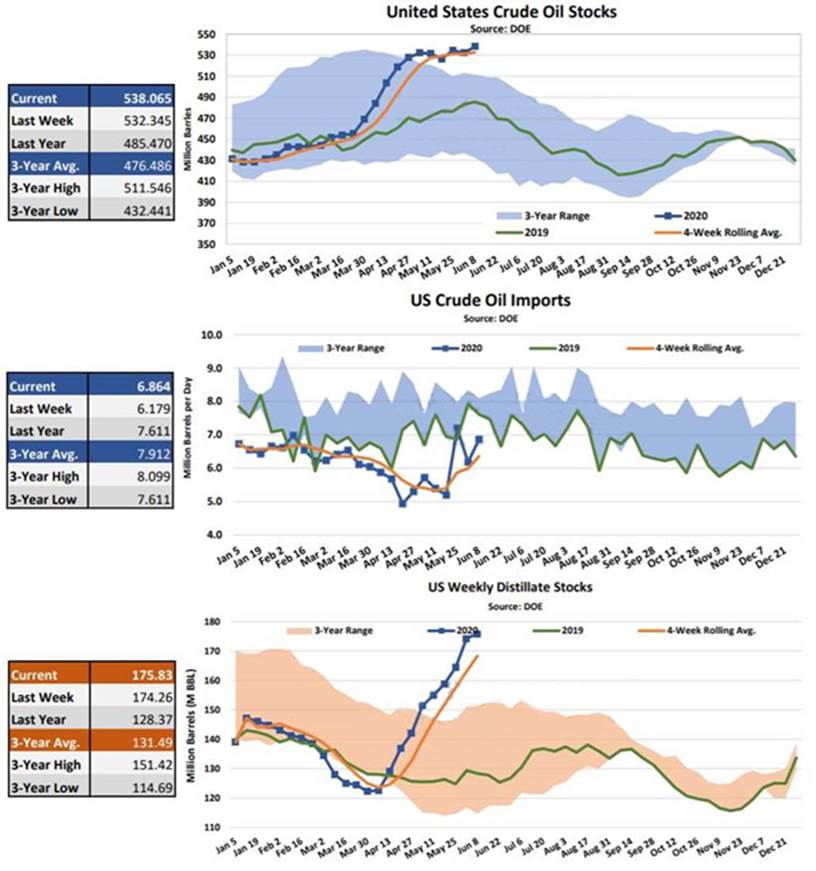
Crude Oil inventories continue to build in the US reaching multi year highs as a swath of Saudi Tankers hit the US. See US Crude oil and refined product Inventory Charts below:
US Crude and Refined Product Inventories

We have been extremely busy at PFL with return on lease programs and railcar storage. Please call PFL now at 239-390-2885 if you are looking for rail car storage or have storage availability.
U.S. Traders are beginning to unwind floating storage for both refined products and crude, which will compete with new exports out of the U.S. trying to find a home potentially leading to a backup in supplies leaving the country in the days to come adding to onshore inventory levels.
Crude by rail woes are continuing. The four week moving average of petroleum carloads fell from 24,470 to 20,042 week over week. U.S. operators were mostly lower and Canadian volumes were also lower amid unfavorable basis differentials against WTI and the cost to get the crude to the gulf coast. WSC versus WTI closed at -$8.30 per barrel on Friday.
North American Railcar Volume
Total North American rail volumes were down 15.4% year over year in week 23 (U.S. -15.6%, Canada -14.0%, Mexico -18.5%), resulting in quarter to date volumes that are down 19.0% and year to date volumes that are down 11.7% (U.S. -13.1%, Canada -7.6%, Mexico -9.8%). 10 of the AAR’s 11 major traffic categories posted year over year declines with the largest decreases coming from intermodal (-9.8%), coal (-29.3%), motor vehicles & parts (-41.7%) and metallic ores & metals (-26.7%).
In the East, CSX’s total volumes were down 20.0%, with the largest decreases coming from coal (-49.6%), intermodal (-11.2%) and motor vehicles & parts (-54.5%). NS’s total volumes were down 20.7%, with the largest decreases coming from coal (-62.5%), intermodal (-8.1%), motor vehicles & parts (-35.9%) and metals & products (-35.2%).
In the West, BN’s total volumes were down 13.8%, with the largest decreases coming from intermodal (-9.9%), coal (-13.8%) and petroleum (-43.3%). UP’s total volumes were down 19.6%, with the largest decreases coming from intermodal (-14.8%), motor vehicles & parts (-61.6%), coal (-24.1%), chemicals (-17.4%), stone sand & gravel (-29.4%) and petroleum (-45.4%).
In Canada, CN’s total volumes were down 18.3% with the largest decreases coming from intermodal (-11.4%), petroleum (-45.9%), motor vehicles & parts (-52.1%), stone sand & gravel (-64.1%) and metallic ores (-17.5%). RTMs were down 23.4%. CP’s total volumes were down 8.3%, with the largest decreases coming from petroleum (-51.0%), motor vehicles & parts (-48.2%) and stone sand & gravel (-70.7%). The largest increase came from grain (+19.8%). RTMs were down 7.8%.
KCS’s total volumes were down 16.7%, with the largest decreases coming from intermodal (-14.8%) and motor vehicles & parts (-58.8%).
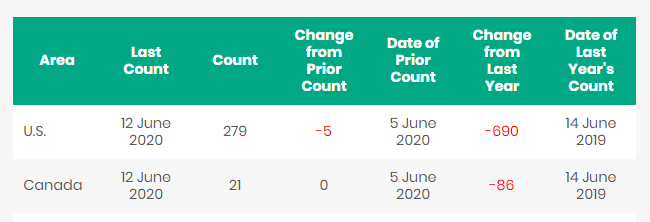
North America rig count continues to deteriorate and is down 5 rigs week over week with the U.S. losing 5 rigs this week (oil rigs down seven to 199, gas rigs up two to 78, and miscellaneous rigs unchanged at two). Canada was flat week over week. Year over year we are down 776 rigs collectively. Canada now has 21 rigs nationwide operating utilizing 4% of the countries capacity and the U.S. has 279 rigs now operating.
North American Rig Count Summary

Railcar Markets
PFL is offering: : Various tank cars for lease with dirty to dirty service including, nitric acid, gasoline, diesel, crude oil and LPG services – terms negotiable short and long term opportunities available. Clean and new cars are available for longer term leases. Much wanted pre pandemic C02 cars are now available for lease get them while you can. Sand cars, Box cars, coal cars and hoppers. A number of cars are available for sale.
PFL is seeking: 100 DOT 117s R’s or J’s for gasoline service – need in Port Arthur for 2 months with a two months option, 150 CPC1232 Cars for Diesel service delivered Houston on the UP for 1 year, 10 CPC 1232 or other for Industrial Alcohol use in Indiana off the NS for 6 months lessee would take ethanol cars clean them use for Industrial service and deliver the cars back to you with industrial alcohol heals, 5 CPC 1232 or other for Ethanol use in MN for 6 months.
Call PFL today to discuss your needs and our availability and market reach. Whether you are looking to lease cars, lease out cars, buy cars or sell cars call PFL today 239-390-2885
PFL offers turn-key solutions to maximize your profitability. Our goal is to provide a win/win scenario for all and we can handle virtually all of your railcar needs. Whether it’s loaded storage, empty storage, subleasing or leasing excess cars, filling orders for cars wanted, mobile railcar cleaning, blasting, mobile railcar repair, or scraping at strategic partner sites, PFL will do its best to assist you. We also assist fleets and lessors with leases and sales and offer Total Fleet Evaluation Services. We will analyze your current leases, storage, and company objectives to draw up a plan of action. We will save Lessor and Lessee the headache and aggravation of navigating through this rapidly changing landscape.
PFL IS READY TO CLEAN CARS TODAY ON A MOBILE BASIS. WE HAVE JUST COMPLETED A JOB IN THE EAST TEXAS
Live Railcar Markets
| CAT | Type | Capacity | GRL | QTY | LOC | Class | Prev. Use | Clean | Offer | Note |
|---|
