“The final test of a leader is that he leaves behind him in other men the conviction and the will to carry on.”
Walter Lippmann
Jobs Update
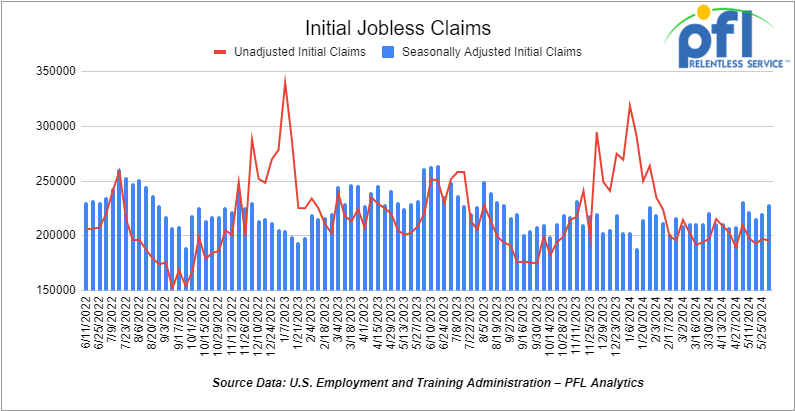
- Initial jobless claims seasonally adjusted for the week ending June 1st, 2024 came in at 229,000, up 8,000 people week-over-week.
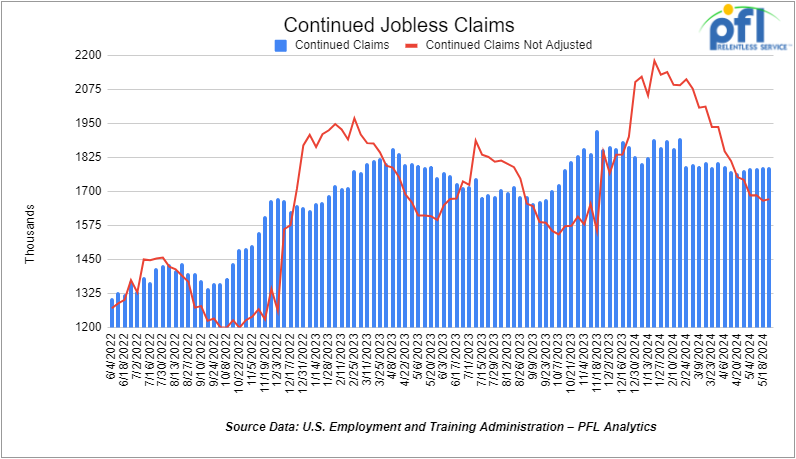
- Continuing jobless claims came in at 1.792 million people, versus the adjusted number of 1.79 million people from the week prior, up 2,000 people week-over-week.
Stocks closed lower on Friday of last week, but higher week over week
The DOW closed lower on Friday of last week, down -87.18 points (-0.22%), closing out the week at 38,798.99, up 112.67 points week-over-week. The S&P 500 closed lower on Friday of last week, down -5.97 points (-0.11%), and closed out the week at 5,346.991, up 69.48 points week-over-week. The NASDAQ closed lower on Friday of last week, down -40 points (-0.24%), and closed out the week at 17,133.13 up 398.11 points week-over-week.
In overnight trading, DOW futures traded lower and are expected to open at 38,732 this morning down 125 points.
Crude oil closed lower on Friday of last week – lower week over week.
WTI traded lower -$0.02 per barrel (-0.03%) on Friday of last week, to close at $75.53 per barrel, down -$1.46 per barrel week-over-week. Brent traded down -US$0.26 per barrel (-0.31%) to close at US$79.62 per barrel on Friday of last week, down -US$2 per barrel week-over-week.
One Exchange WCS (Western Canadian Select) for July delivery settled Friday at US$13.10 below the WTI-CMA (West Texas Intermediate – Calendar Month Average). The implied value was US$62.00 per barrel.
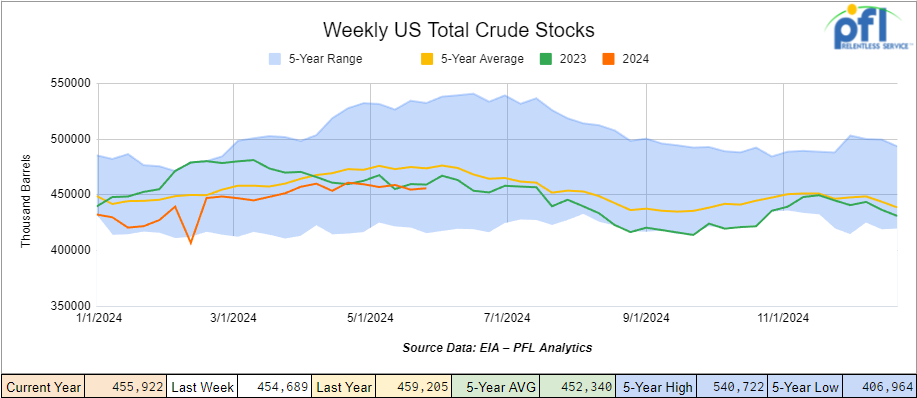
U.S. commercial crude oil inventories (excluding those in the Strategic Petroleum Reserve) increased by 1.2 million barrels week-over-week. At 455.9 million barrels, U.S. crude oil inventories are 4% below the five-year average for this time of year.
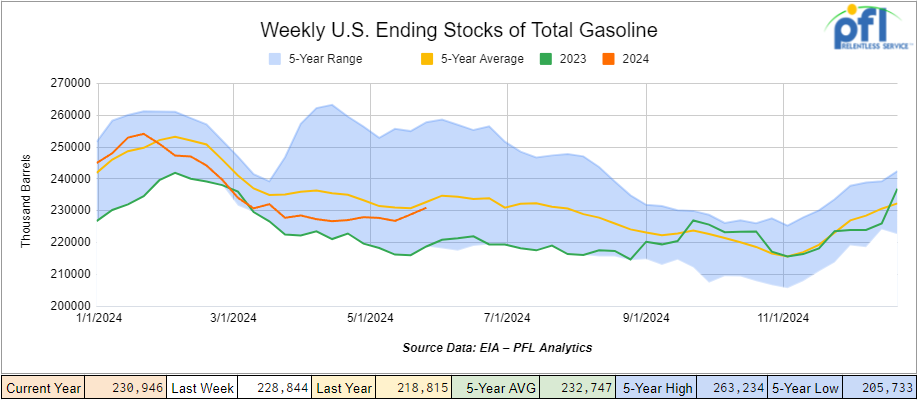
Total motor gasoline inventories increased by 2.1 million barrels week-over-week and are 1% below the five-year average for this time of year.
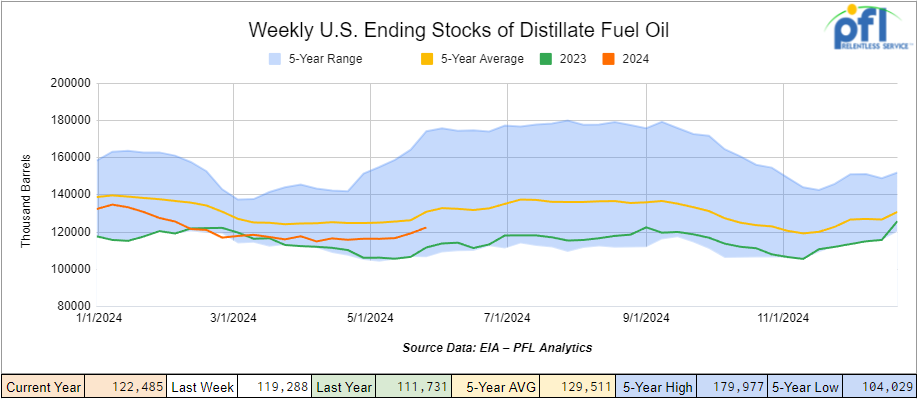
Distillate fuel inventories increased by 3.2 million barrels week-over-week and are 7% below the five-year average for this time of year.
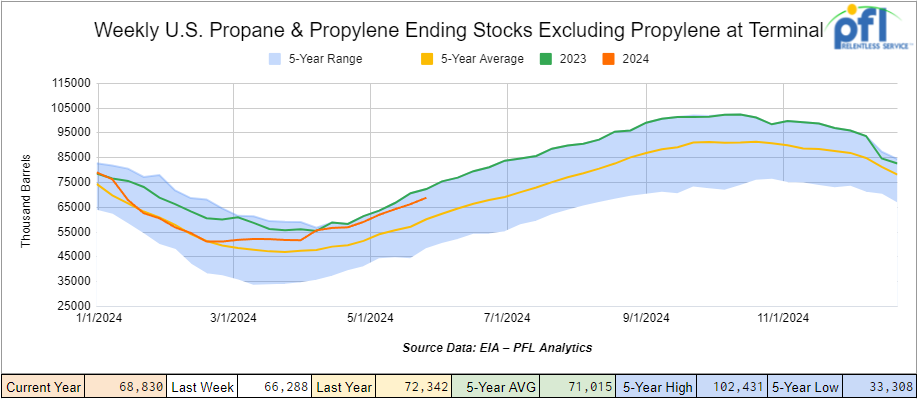
Propane/propylene inventories increased by 2.5 million barrels week-over-week and are 14% above the five-year average for this time of year.
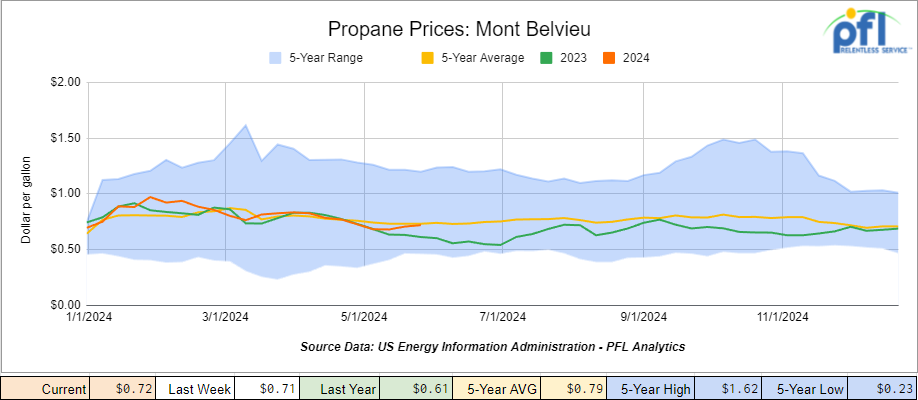
Propane prices closed at 72 cents per gallon, up 1 cent week-over-week and up 11 cents year-over-year.
Overall, total commercial petroleum inventories increased by 13.5 million barrels during the week ending May 31st, 2024.
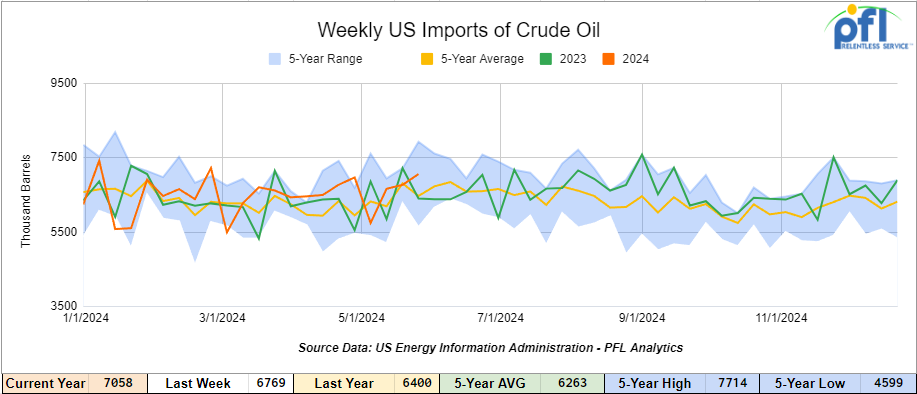
U.S. crude oil imports averaged 7.1 million barrels per day during the week ending May 31st, 2024, an increase of 289,000 barrels per day week-over-week. Over the past four weeks, crude oil imports averaged 6.8 million barrels per day, 3.5% more than the same four-week period last year. Total motor gasoline imports (including both finished gasoline and gasoline blending components) averaged 699,000 barrels per day, and distillate fuel imports averaged 142,000 barrels per day during the week ending May 31st, 2024.
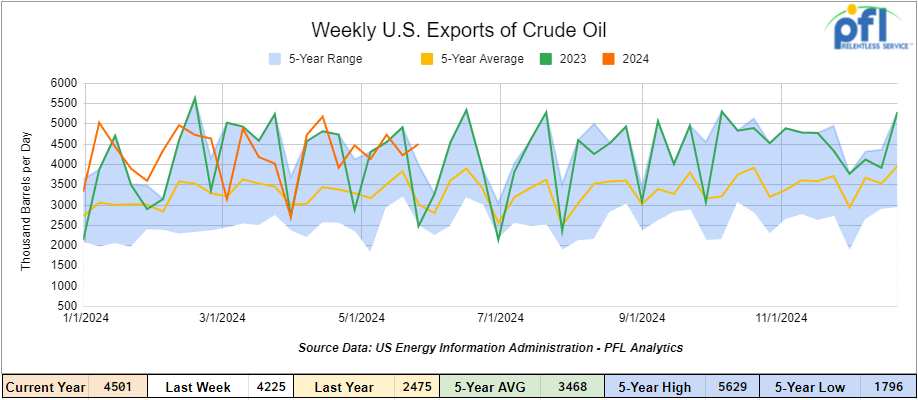
U.S. crude oil exports averaged 4.501 million barrels per day for the week ending May 31st, 2024, an increase of 276,000 barrels per day week-over-week. Over the past four weeks, crude oil exports averaged 4.398 million barrels per day.
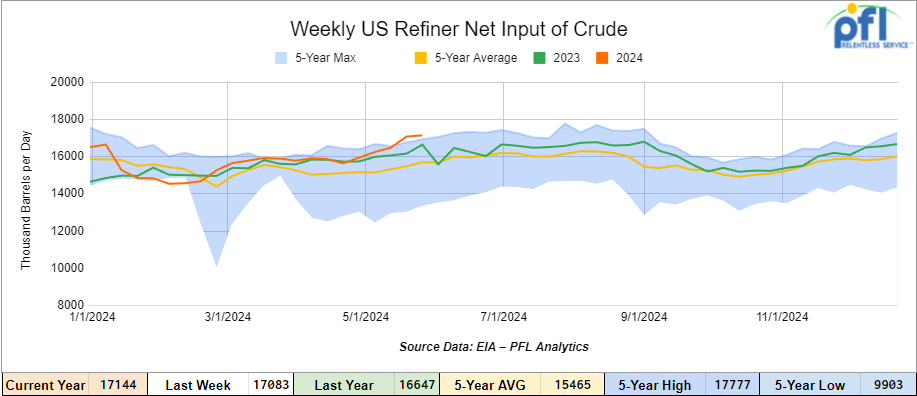
U.S. crude oil refinery inputs averaged 17.1 million barrels per day during the week ending May 31, 2024, which was 61,000 barrels per day more week-over-week.
WTI is poised to open at $75.62, up 9 cents per barrel from Friday’s close.
North American Rail Traffic
Week Ending June 5th, 2024.
Total North American weekly rail volumes were up (2.72%) in week 23, compared with the same week last year. Total carloads for the week ending on June 6th were 325,344, down (-3.13%) compared with the same week in 2023, while weekly intermodal volume was 308,720, up (+9.7%) compared to the same week in 2023. 8 of the AAR’s 11 major traffic categories posted year-over-year decreases. The most significant decrease came from Coal, which was down (-16.24%). The most significant increase came from Grain which was up (+14.31%).
In the East, CSX’s total volumes were down (-0.28%), with the largest decrease coming from Grain (-23.11%) while the largest increase came from Petroleum and Petroleum Products (15.43%). NS’s volumes were up (7.21%), with the largest increase coming from Intermodal Units (+14.06%) while the largest decrease came from Grain (-21.05%).
In the West, BN’s total volumes were up (6.57%), with the largest increase coming from Grain (38.34%) while the largest decrease came from Coal, down (-26.83%). UP’s total rail volumes were down (0.99%) with the largest decrease coming from Nonmetallic Minerals, down (-27.02%) while the largest increase came from Grain which was up (+15.85%).
In Canada, CN’s total rail volumes were up (3.25%) with the largest decrease coming from Grain, down (-29.85%) while the largest increase came from Coal, up (+18.48%). CP’s total rail volumes were up (3.96%) with the largest increase coming from Grain (+97.22%) while the largest decrease came from Coal, down (-54.82%).
KCS’s total rail volumes were down (-10.91%) with the largest decrease coming from Coal (-25.09%) and the largest increase coming from Motor Vehicles and Parts (+98.92%).
Source Data: AAR – PFL Analytics
Rig Count
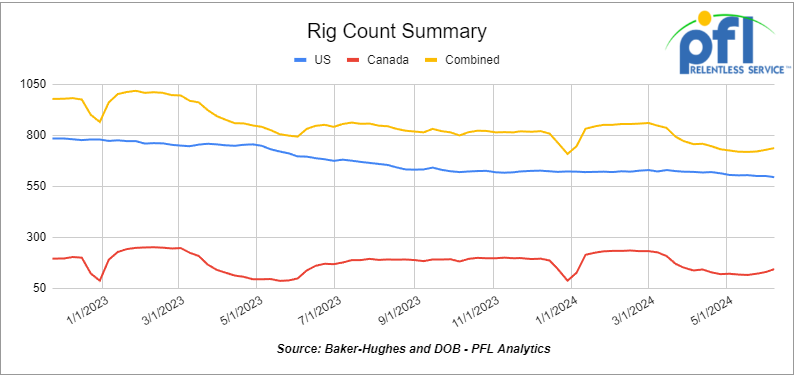
North American rig count was up by 9 rigs week-over-week. U.S. rig count was down by 6 rigs week-over-week, and down by -101 rigs year-over-year. The U.S. currently has 594 active rigs. Canada’s rig count was up by 15 rigs week-over-week, and up by 7 rigs year-over-year. Canada’s overall rig count is 143 active rigs. Overall, year-over-year, we are down -94 rigs collectively.
International rig count was down by -25 rigs month over month and down 12 rigs year over year. Internationally there are 953 active rigs.
North American Rig Count Summary

A few things we are watching:
We Continue to watch Potential Rail Strikes in Canada
In the latest – CN on Thursday of last week announced the company has formally offered the Teamsters Canada Rail Conference (TCRC) to enter into binding arbitration.
This process has a mutually agreed upon independent arbitrator settle the labor dispute by evaluating the demands of each side and deciding on the terms of the new collective agreement, CN officials said in a press release.
The TCRC has rejected all offers put to them and has now rejected a voluntary arbitration process, they said. CN initially attempted to change the collective agreement to improve work-life balance for employees and productivity through scheduling and hourly wages. Currently, engineers and conductors do not work on a schedule and are paid on a legacy miles-based system.
As the union declined to negotiate substantively on that matter, CN made a simplified offer to the union in May that continued to be aligned with government guidelines on work and rest and achieved some productivity gains, CN officials said. The union rejected this offer as well.
All offers align with the latest government regulations and Duty and Rest Period Rules (DRPR). Implemented in May 2023, DRPR specifically defines the requirements related to hours of work and rest periods for employees who are in positions designated critical to safe railway operations. Claiming they are unsafe is false, CN officials said.
Last week, CN and other parties took part in a case management conference organized by the Canada Industrial Relations Board (CIRB) to discuss the minister of labor’s request for clarity on the continuation of activities during a work stoppage. As part of this review process, the parties had until May 31 to submit replies to the CIRB. The CIRB has now extended that deadline to June 14 and has asked that specific themes identified in the submissions filed by stakeholders be addressed in the replies.
The CIRB has not yet indicated how long it will take to make a decision, and neither a strike nor a lockout can happen until then. A strike or lockout is unlikely to happen before mid-to-late July, CN officials said.
TCRC represents about 6,000 conductors, conductor trainees, yard coordinators, and locomotive engineers across CN’s network in Canada.
We are watching Petroleum Carloads
The four-week rolling average of petroleum carloads carried on the six largest North American railroads fell to 27,866 from 29,287, which was a loss of -1,421 rail cars week-over-week. Canadian volumes were lower. CPKC’s shipments fell by -8% week over week, and CN’s volumes were lower by -2.7% week-over-week. U.S. shipments were lower across the board. The UP had the largest percentage decrease and was down by -19.5%.
Is Free Speech a thing of the Past in Canada for the Oil and Gas Sector?
It certainly seems to be! Bill C-59 passed by the Federal Government of Canada House of Commons amongst other things, targets energy company’s communication with the public. Alberta’s oil-rich Provincial Premier (our equivalent of Governor of a state here in the U.S.) Danielle Smith is fighting back.
Alberta Premier Danielle Smith and a provincial minister are knocking on a federal move that they say hamstrings energy companies when communicating their work on environmental performance.
Smith spoke at the Inventures event by Alberta Innovates in Calgary in a discussion moderated by Martha Hall Findlay, director at the School of Public Policy, University of Calgary last week.
Previously, Hall Findlay served as Chief Sustainability Officer and Chief Climate Officer for Suncor Energy Inc.
“There were some last-minute amendments to the Federal Budget Implementation Act to make it illegal for energy companies to talk about their environmental performance, which is bananas because it’s our energy companies that are at the forefront of doing some of these amazing environmental innovations,” Smith told the audience.
Earlier, Alberta’s Minister of Environment and Protected Areas Rebecca Schulz released a statement on Bill C-59.
“In February, federal NDP MP Charlie Angus introduced a bill that threatened fines and jail time for Canada’s oil and gas industry if they tried to defend their record on the environment,” it reads.
“A few months later, through last-minute amendments to Bill C-59, MP Charlie Angus has managed to sneak his bill in through the back door. ”She continued to say: “ … the bill will clear the way for environmental activists to sue oil and gas companies over “misleading environmental benefits.’”
According to Schulz’s statement, environmental activists will be able to bring claims against oil and gas companies under so-called ‘anti-greenwashing provisions.’ In other words, they will have to prove green initiatives, be fined and executives could even go to jail.
“Companies that wish to defend their environmental record will have to prove that their claims can be substantiated by an ‘internationally recognized methodology,’ a vague and undefined phrase that creates needless uncertainty for businesses,” she added.
In a further attack against Oil and Gas companies here in the U.S., environmental groups filed notice on Wednesday of last week to sue Suncor Energy Inc. under the U.S. Clean Air Act for repeated air pollution violations at its Commerce City, Colorado, refinery. Commerce City near Denver has Colorado’s only refinery, processing 98,000 bbls of oil per day.
The organizations, represented by environmental law non-profit Earthjustice, said they will bring a civil suit against Calgary-based Suncor over more than 1,000 emission violations that Earthjustice said Suncor reported to the state of Colorado between January 2019 and December 2023.
“If someone was given 1,000 speeding tickets, we’d take away their license,” said Margaret Kran-Annexstein, director of Colorado Sierra Club, one of the groups that intends to sue Suncor.
Ian Coghill, a senior attorney with Earthjustice, said the groups are seeking civil penalties from Suncor and to deter the refinery from further air pollution violations.
“The state has taken action against Suncor but it doesn’t seem to have changed anything,” Coghill said. “What we’re looking for is to hold Suncor accountable and find meaningful deterrents to bring Suncor into compliance.”
Coghill said the maximum penalty for every day of violation under the Clean Air Act is up to $121,000 and the suit is alleging 9,000 days of violations. That adds up to $121 million!
In February the state of Colorado fined Suncor $10.5 million for violating air pollution laws between 2019 and 2021.
We are Watching Some Key Economic Indicators
Purchasing Managers Index (PMI)
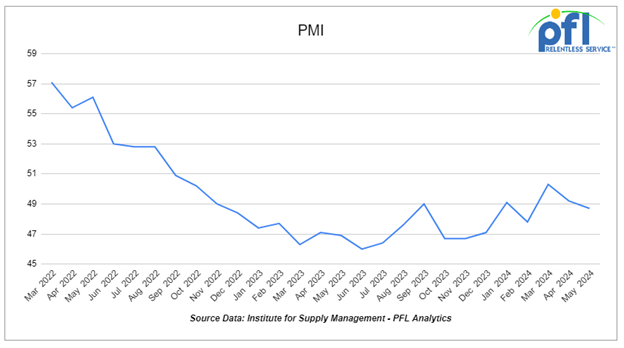
The Institute for Supply Management releases two PMI reports – one covering manufacturing and the other covering services. These reports are based on surveys of supply managers across the country and track changes in business activity. A reading above 50% on the index indicates expansion, while a reading below 50% signifies contraction, with a faster pace of change the farther the reading is from 50.
The overall Manufacturing PMI was 47.4% in December, up from 46.7% in November and October. The index has been relatively flat throughout 2023, with December marking the 14th straight month it’s been below 50%. The new orders subindex in December was 47.1%, down from 48.3% in November.
The Manufacturing PMI in May was 48.7%, down from 49.2% in April and 50.3% in March. March had been the first time it was above 50% in 16 months. After a second month of contraction territory, it appears the creep into expansion in March was an anomaly. The drop in the new orders subindex in May was even more substantial, from 49.1% in April to 45.4% in May — the lowest it’s been in a year. The prices subindex, production subindex, and order backlog subindexes also all fell in May.
The Services PMI, the service sector’s answer to the Manufacturing PMI, was 53.8% in May, up from 49.4% in April. The new orders subindex rose from 52.2% in April to 54.1% in May. The business activity subindex jumped even further, up 10.3 percentage points to 61.2% in May. The U.S. services sector is much larger than its manufacturing counterpart, and the Services PMI typically has a higher reading than the Manufacturing PMI.
Industrial Output & Capacity Utilization
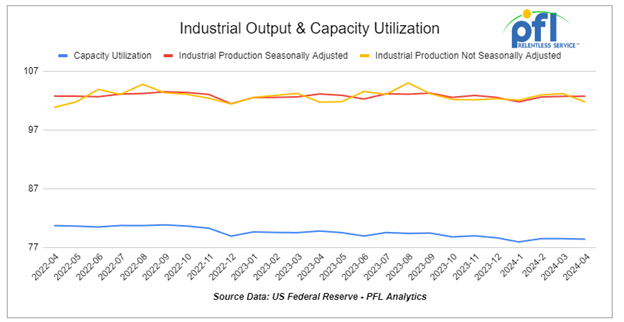
According to preliminary and seasonally adjusted data from the Federal Reserve, total U.S. industrial output in April 2024 was flat compared to March 2024 and down 0.4% from April 2023 This follows a 0.1% gain in March 2024 over February 2024. For the past two years, there has been very little movement one way or another in total output.
Manufacturing accounts for approximately 75% of total output. In April 2024, manufacturing output was down a preliminary 0.3% from March 2024, following a downwardly revised 0.2% gain in March. Over the past two years, manufacturing output has trended slightly down (see the line in the top left chart below). Manufacturing output in April 2024 was down a preliminary 0.5% from April 2023.
Some industry sectors saw output gains in April and some saw declines. Iron, steel, paper, and nonmetallic minerals saw output gains in April; motor vehicles and parts, petroleum refining, wood products, agricultural chemicals, and grain mill products saw declines. Mining output (including oil and gas extraction) fell a preliminary 0.6% in April from March, it is the fifth decline in the past seven months. It’s been trending down so far this year after trending slightly higher most of 2023. Utility output varies with the weather; it was up 2.8% in April from March.
Capacity utilization is a measure of how fully firms are using the machinery and equipment — was down slightly in April from March.
U.S Unemployment
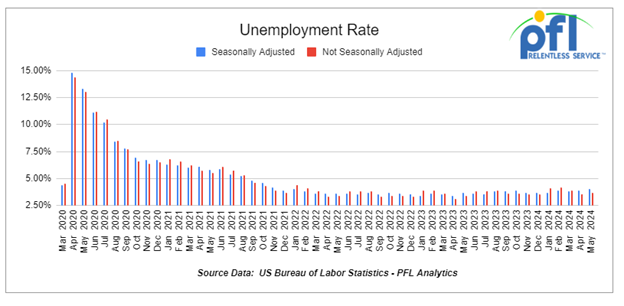
According to the Bureau of Labor Statistics (BLS), a preliminary 272,000 net new jobs were created in May 2024, better than what most economists expected. Job gains in March and April 2024 were revised slightly down. The big jobs gain is contrary to some other recent economic indicators that seem to be pointing to a slowing economy.
According to the BSL so far this year, net new job gains have totaled 1.24 million.
The official unemployment rate was 4.0% in May, up 0.1% month over month.
Consumer Confidence
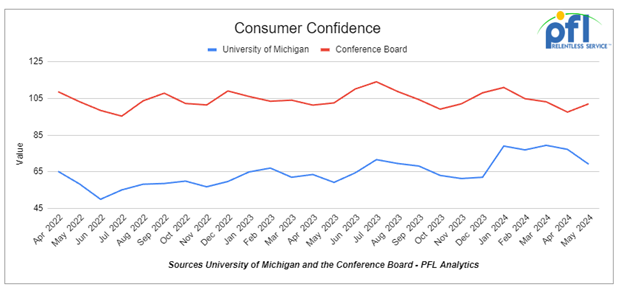
The Conference Board’s Index of Consumer Confidence rose to 102 in May from 97.5 in April. The May increase in the Conference Board index was the first in four months.
The index of consumer sentiment from the University of Michigan declined from 77.2 in April to 69.1 in May.
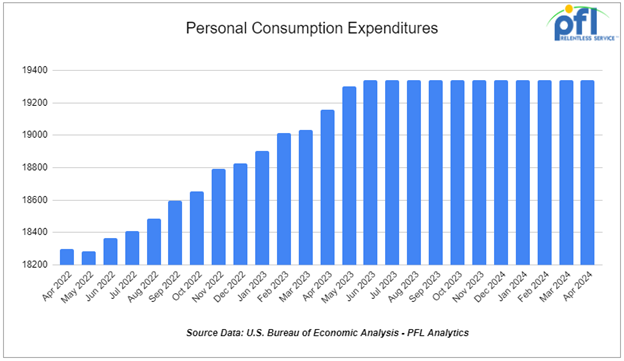
Consumer Spending
Total consumer spending adjusted for inflation fell a preliminary 0.1% in April 2024 from March, following a 0.4% gain in March and a 0.3% gain in February. Year-over-year total spending was up 2.6% in April 2024.
Inflation-adjusted spending on goods fell a preliminary 0.4% in April, its third decline in the first four months of 2024. Inflation-adjusted spending on services rose 0.1% in April, its eighth straight month-to-month gain. Not adjusted for inflation, total spending rose 0.2% in April from March, down from 0.7% the prior month.
Lease Bids
- 20, 4750’s Thru Hatch Covered Hoppers needed off of UP BN in USA West for 3 years. Cars are needed for use in Fertilizer service.
- 100-200, 5200 Covered Hoppers needed off of UP, BNSF in Gulf area for 1-2 years. Cars are needed for use in Petcoke service. Open to smaller cube or longer term
- 250, 4000 Rapid Hoppers needed off of BNSF in TX IL for 5 years. Cars are needed for use in Coal service. in rotary/rapid cars with the electric dumping shoe
- 4, 6260 Covered Hoppers needed off of CSX in Bostick, NC for 2-4 Years. Cars are needed for use in Polypropene Pellets service.
- 25-50, 5000CF-5100CF Covered Hoppers needed off of BNSF, CSX, KCS, UP in Gulf LA for 3-10 years. Cars are needed for use in Dry sugar service. 3 bay gravity dump, Hempel 37700
- 25, 3230 PD Hoppers needed off of NS or CSX in Ohio for 5 years. Cars are needed for use in Flyash service.
- 10, 2500CF Open Top Hoppers needed off of UP or BN in Texas for 5 years. Cars are needed for use in aggregate service. Need Rapid Discharge Doors
- 50-100, 4550 Covered Hoppers needed off of UP or BN in Texas for 5 years. Cars are needed for use in Grain service.
- 10, 5200cf PD Hoppers needed off of UP in Colorado for 1-3 years. Cars are needed for use in Silica service. Call for details
- 100, 15.5K DOT 111 Tanks needed off of Any Class 1 in USA for 1-3 Years. Cars are needed for use in Molten Sulfur service.
- 50, 30K 117 Tanks needed off of BNSF or UP in TX for 3-6 Months. Cars are needed for use in Crude service. will look at smaller cars. Prefer short term would look at longer term. Domestic use only
- 20, 25.5k CPC 1232 Tanks needed off of UP or BN in Ok, TX for 3 Year. Cars are needed for use in Asphalt service.
- 100, 25.5K DOT 111 Tanks needed off of Any Class 1 in Texas for 3 Years +. Cars are needed for use in Asphalt service.
- 30, 29K 117J Tanks needed off of BN or CN in Houston or Edmonton for 1-2 Year. Cars are needed for use in Biodiesel service.
- 200-400, 30K DOT 111 Tanks needed off of UP or BN in Houston for 2 Year. Cars are needed for use in Gas/Diesel service. 1-2 Year
- 10, 25.5K-28.3K DOT 111 Tanks needed off of UP or BN in Houston for 2 Year. Cars are needed for use in Resin service.
- 10, 28.3K 117J Tanks needed off of UP or BN in Texas for 3 Year.
- 25-30, 23.5K or 25.5K Dot 111 or CPC 1232 Tanks needed off of UP or BN in TX, OK, or AR for 3-5 Years. Cars are needed for use in Asphalt service. Needed ASAP., Lined or Unlined. Splash Load
- 100, 30K Dot 111, CPC 1232, DOT 117R, DOT 117J Tanks needed off of CP or CN in Edmonton for 1 Year. Cars are needed for use in Diesel service.
- 80, 30K 117R or 117J Tanks needed off of UP in Nebraska for 12 Months. Cars are needed for use in Ethanol service.
- 100, 30K Dot 111 or CPC 1232 Tanks needed off of UP or BN in New Orleans/Pasadena for 6-12 Months. Cars are needed for use in Gasoline/Diesel service.
- 80, 29k 117R or 117J Tanks needed off of Any Class 1 in Kentucky for 1-5 Years. Cars are needed for use in Crude service.
- 50, 19k DOT111 Tanks needed off of UP or BN in Nevada or CA for 1 year. Cars are needed for use in Sulfuric Acid service. March or April
- 8, 28-30K Any Tanks needed off of UP BN in Texas and Gulf for 5 years. Cars are needed for use in Chlorobenzene service. Need Magrods
- 14, 23.5K DOT111 Tanks needed off of UP in Morrilton, AR for 1 year. Cars are needed for use in Turpentine service.
- 10, 30k any Tanks needed off of UP BN in Texas for 1 year plus. Cars are needed for use in Fuel Oil service.
- 25, 20.5K CPC1232 or DOT117J Tanks needed off of BNSF or UP in the west for 3-5 years. Cars are needed for use in Magnesium chloride service. SDS onhand
- 15, 28.3K DOT117J Tanks needed off of any class 1 in any location for 3 years. Cars are needed for use in Glycerin & Palm Oil service.
- 30, 17K-20K DOT117J Tanks needed off of UP or BN in Midwest/West Coast for 3-5 years. Cars are needed for use in Caustic service.
- 150, 23.5K DOT111 Tanks needed off of any class 1 in LA for 2-3 years. Cars are needed for use in Fluid service. Needed July
- 10, 30K 117R or 117J Tanks needed off of Any Class 1 in USA for 1 year. Cars are needed for use in Glycerin service.
- 25, 30K 117R Tanks needed off of in for 2-3 Year. Cars are needed for use in Condensate service.
- 50, 23.5-25.5 DOT111 Tank s needed off of Any Class 1 in USA for 5 years. Cars are needed for use in Asphalt service.
- 200, 30K Any Tanks needed off of UP or BN in Texas for RD. Cars are needed for use in Dirty service.
Sales Bids
- 100-150, 3400CF Covered Hoppers needed off of UP BN in Texas. Cars are needed for use in Sand service.
- 10, 2770 Mill Gondolas needed off of any class 1 in St. Louis. Cars are needed for use in Cement service.
- 20, 2770-3400 Mill Gondolas needed off of any class 1 in South Texas. Cars are needed for use in scrap metal service.
- 20-30, 3000 – 3300 PD Hoppers needed off of BN or UP preferred in West. Cars are needed for use in Cement service. C612
- 20-30, Open Top Hoppers needed off of NS or CSX in Northeast. Cars are needed for use in aggregate service. Gravity dump
- 5, 23,5K DOT 111 Tanks needed off of any class 1 in Texas. Negotiable
- 20, 17K DOT111 Tanks needed off of various class 1s in various locations. Cars are needed for use in corn syrup service.
- 100, 15.7K DOT111 Tanks needed off of CSX or NS in the east. Cars are needed for use in Molten Sulfur service.
- 30, 17K-20K DOT111 Tanks needed off of UP or BN in Texas. Cars are needed for use in UAN service.
- 2-4, 28K DOT111 Tanks needed off of BNSF Preferred in Minnesota. Cars are needed for use in Biodiesel service. Coiled and insulated
- 5, 30K DOT 111 Tanks needed off of in US. Cars are needed for use in Fuels service.
Lease Offers
- 200-500, 5200, Covered Hoppers located off of CN and NS in Moving on CN and NS. Cars were last used in Grain. Lease available until Fall.
- 50, ~5400, Covered Hoppers located off of NS, IORY in MI. Cars were last used in bean meal. 1 year+
- 53, 2 containers, Flats Double-stack rail transports located off of KCS in Texas. Cars are clean Lease or sell. (Intermodal Container)
- 15, 33K, 340W Pressure Tanks located off of All Class Ones in North America. Cars were last used in Propane/Butane. Up to 1 year.
- 100+, 29K, 117R Tanks located off of All Class Ones in St Louis. Cars were last used in Veg Oils. Up to 4 Years
- 100+, 29K, 117J Tanks located off of All Class Ones in St Louis. Cars were last used in Veg Oils. Returned by end of 2026
- 100, 30K, 117J Tanks located off of UP or BN in Texas. Cars were last used in Ethanol. Up to 1 year. Must go into ethanol service.
- 200, 25.5K, 117J Tanks located off of CPKC in Moving. Cars were last used in Crude. 6-12 Months
- 5, 25.5K, DOT 111 Tanks located off of UP in Kansas. Cars were last used in Veg Oils. 2 Year Term
Sales Offers
- 20, Refer Boxcars located off of UP in ID.
- 24, 5300CF, Plate C Boxcars located off of NS or CSX in Southeast.
- 19, 4400, Rotary Gondolas located off of UP and BN in California and Wyoming.
- 100-300, 3400, Covered Hoppers located off of various class 1s in multiple locations. Sand Cars
- 100, 28.3K, DOT117J Tanks located off of various class 1s in multiple locations.
- 7, 30K, DOT 111 Tanks located off of UP in TX, CA, NM.
Call PFL today to discuss your needs and our availability and market reach. Whether you are looking to lease cars, lease out cars, buy cars, or sell cars call PFL today at 239-390-2885
Live Railcar Markets
| CAT | Type | Capacity | GRL | QTY | LOC | Class | Prev. Use | Clean | Offer | Note |
|---|
