
“Far and away the best prize that life has to offer is the chance to work hard at work worth doing. “
-Theodore Roosevelt
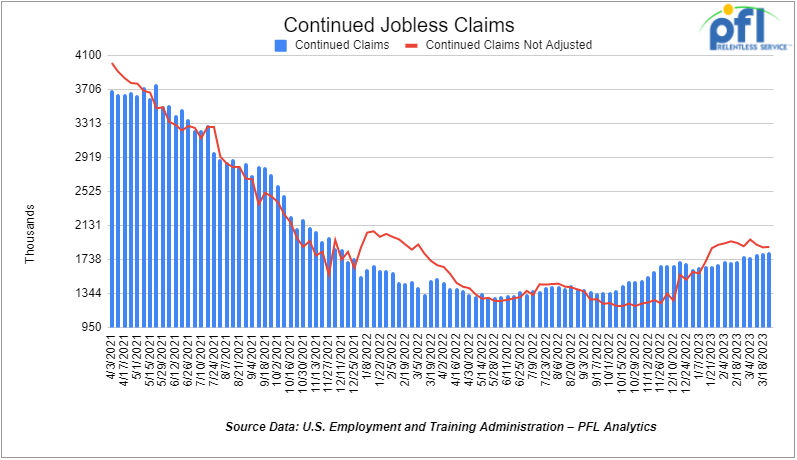
Jobs Update
- Initial jobless claims for the week ending April 1st, 2023 came in at 228,000, down -18,000 people week-over-week.
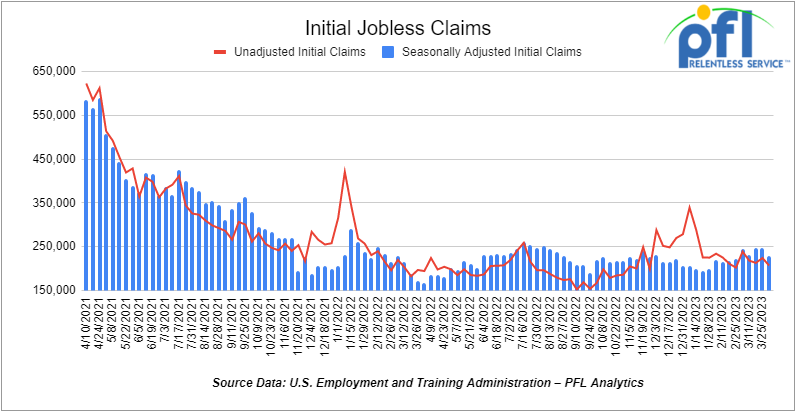
- Continuing jobless claims came in at 1.823 million people, versus the adjusted number of 1.817 million people from the week prior, up 6,000 people week over week.
Stocks closed higher on Friday of last week and mixed week over week
The DOW closed higher on Friday of last week, up 2.57 points (+0.01%), closing out the week at 33,485.29 up 211.14 points week over week. The S&P 500 closed higher on Friday of last week, up 91.09 points (+0.76%), and closed out the week at 4,105.02, down -4.29 points week over week. The NASDAQ closed higher on Friday of last week, up +14.64 points (+0.36%), and closed the week at 12,07.96, down -133.95 points week over week.
In overnight trading, DOW futures traded higher and are expected to open at 33,666 this morning up +7 points.
WTI closed higher on Friday of last week and up week over week
WTI traded up $0.09 per barrel (0.1%) to close at $80.70 per barrel on Friday of last week, and up $5.03 per barrel week over week. Brent traded up $0.13 per barrel (0.2%) on Friday of last week, to close at US$85.12 per barrel, up US$5.23 per barrel week over week.
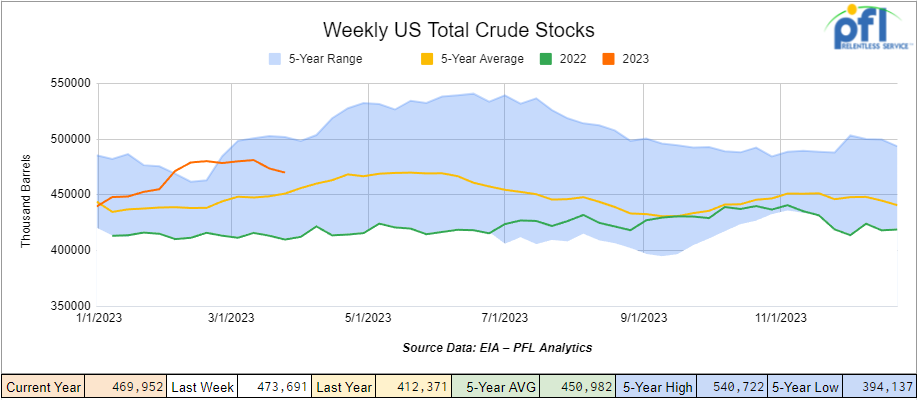
U.S. commercial crude oil inventories (excluding those in the Strategic Petroleum Reserve) decreased by 3.7 million barrels week over week. At 470 million barrels, U.S. crude oil inventories are 4% above the five-year average for this time of year.
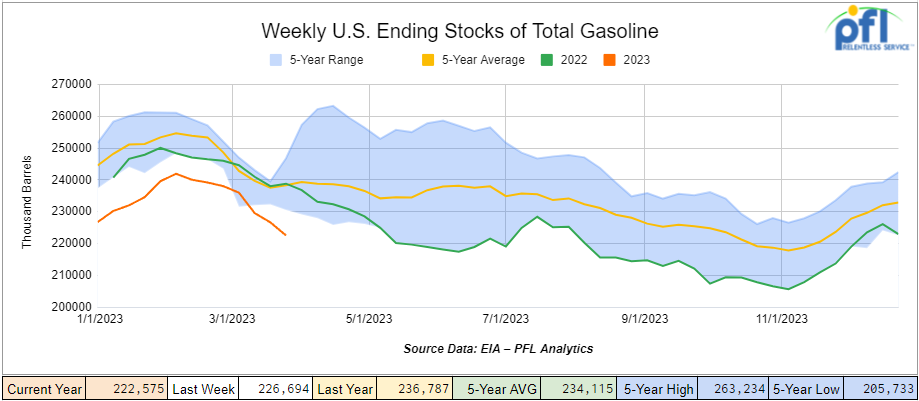
Total motor gasoline inventories decreased by 4.1 million barrels from week over week and are 7% below the five-year average for this time of year.
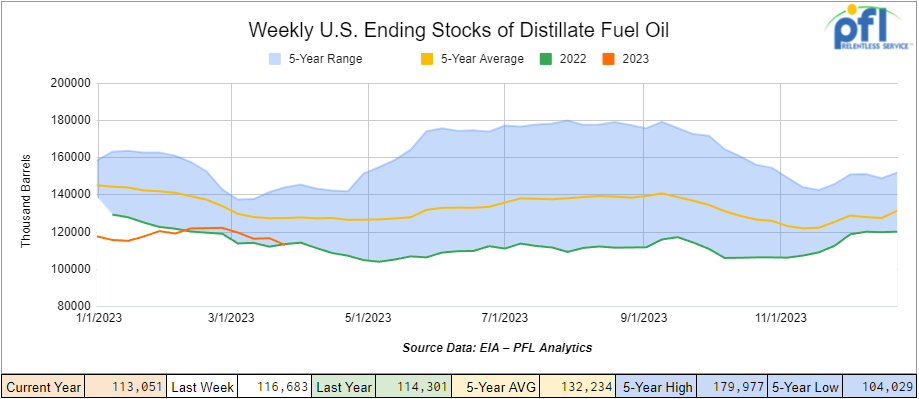
Distillate fuel inventories decreased by 3.6 million barrels week over week and are 12% below the five year average for this time of year.
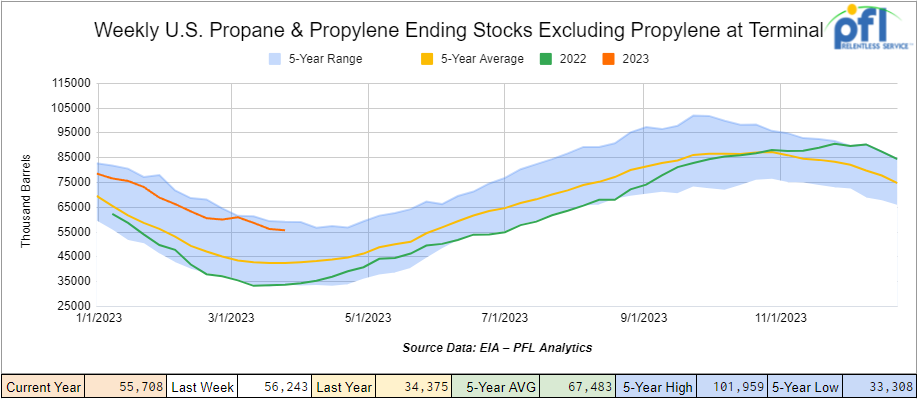
Propane/propylene inventories decreased by 500,000 barrels week over week and are 31% above the five year average for this time of year.
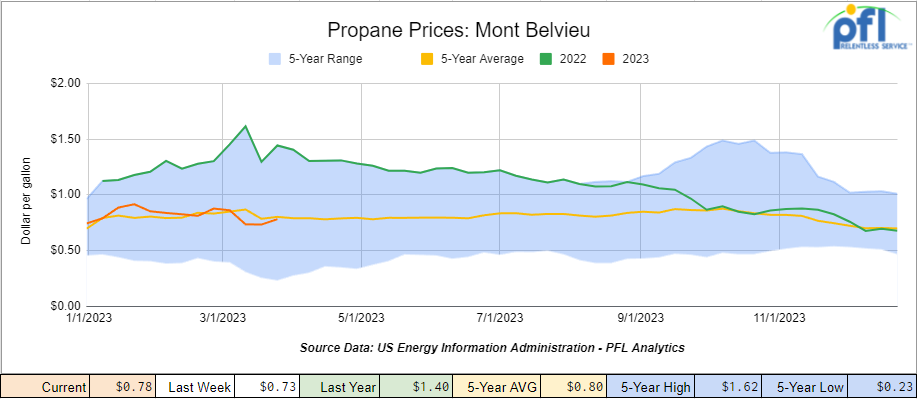
Propane gained 5 cents per gallon week over week, closing at 78 cents a gallon, down 62 cents per gallon year over year.
Overall, total commercial petroleum inventories decreased by 11 million barrels during the week ending March 31st, 2023.
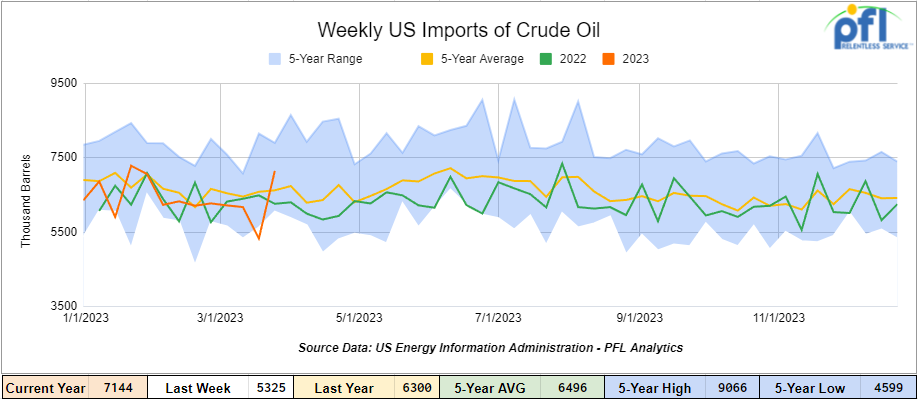
U.S. crude oil imports averaged 7.1 million barrels per day during the week ending March 31st, 2023, an increase of 1.8 million barrels per day week over week. Over the past four weeks, crude oil imports averaged 6.2 million barrels per day, 2.3% less than the same four-week period last year. Total motor gasoline imports (including both finished gasoline and gasoline blending components) averaged 713,000 barrels per day, and distillate fuel imports averaged 115,000 barrels per day during the week ending March 31st, 2023.
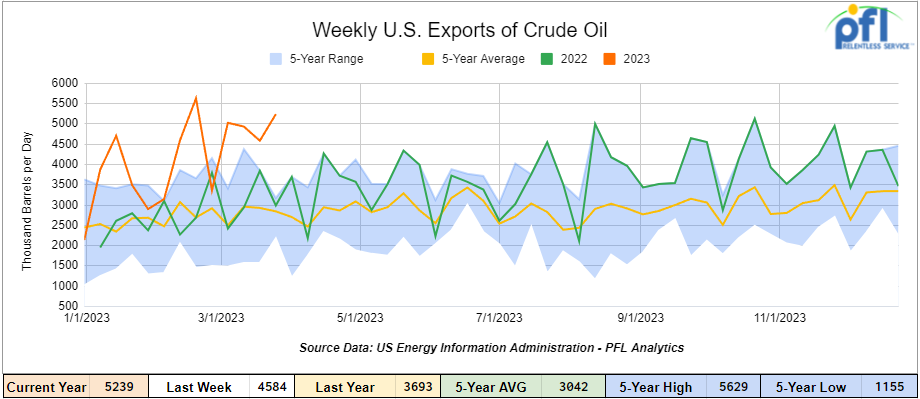
U.S. crude oil exports averaged 5.239 million barrels per day for the week ending March 31st, 2023, an increase of 655,000 barrels per day week over week. Over the past four weeks, crude oil exports averaged 4.946 million barrels per day.
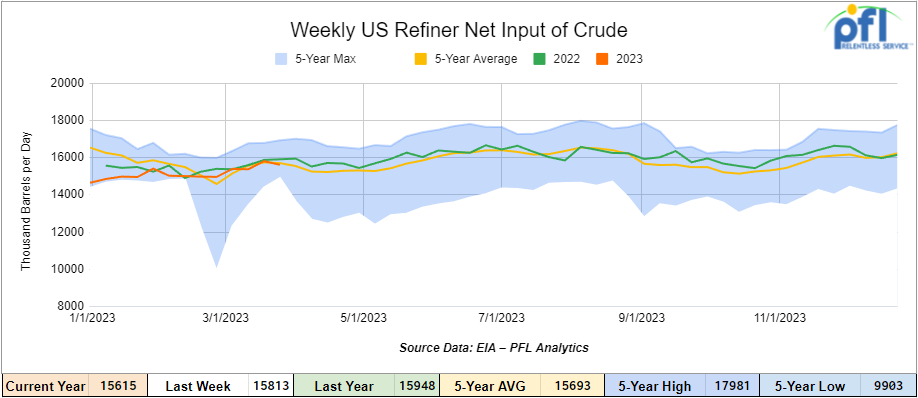
U.S. crude oil refinery inputs averaged 15.6 million barrels per day during the week ending March 31, 2023 which was 198,000 barrels per day less week over week.
As of the writing of this report, WTI is poised to open at $80.94 up $0.24 per barrel from Monday’s close.
North American Rail Traffic
Week Ending April 5th, 2023.
Total North American weekly rail volumes were down (-7.82%) in week 13 compared with the same week last year. Total carloads for the week ending on April 5th were 350,451, down (-1.57%) compared with the same week in 2022, while weekly intermodal volume was 294,631, down (-14.28%) compared to the same week in 2022. 7 of the AAR’s 11 major traffic categories posted year-over-year decreases with the most significant decrease coming from Grain (-14.80%). The largest increase was from Petroleum and Petroleum Products (+8.91%).
In the east, CSX’s total volumes were down (-7.58%), with the largest decrease coming from Intermodal (-14.27%) and the largest increase from Metallic Ores and Minerals (+11.54%). NS’s volumes were down (-4.13%), with the largest decrease coming from Coal (-8.96%) and the largest increase from Other (+9.06%).
In the West, BN’s total volumes were down (-13.09%), with the largest decrease coming from Intermodal (-23.06%), and the largest increase coming from Motor Vehicles and Parts (+17.59%). UP’s total rail volumes were down (-2.53%) with the largest decrease coming from Other (-27.34%) and the largest increase coming from Petroleum and Petroleum Products (+22.92%).
In Canada, CN’s total rail volumes were down (-9.37%) with the largest increase coming from Coal (+19.88%) and the largest decrease coming from Intermodal (-26.85%). CP’s total rail volumes were down (-20.33%) with the largest decrease coming from Grain (-55.21%) and the largest increase coming from Motor Vehicles and Parts (+84.69%).
KCS’s total rail volumes were down (-12.43%) with the largest decrease coming from Other (-34.18%) and the largest increase coming from Grain (+26.63%).
Source Data: AAR – PFL Analytics
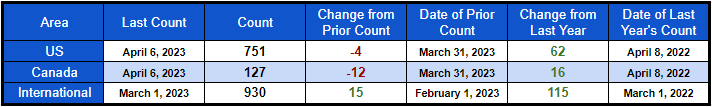
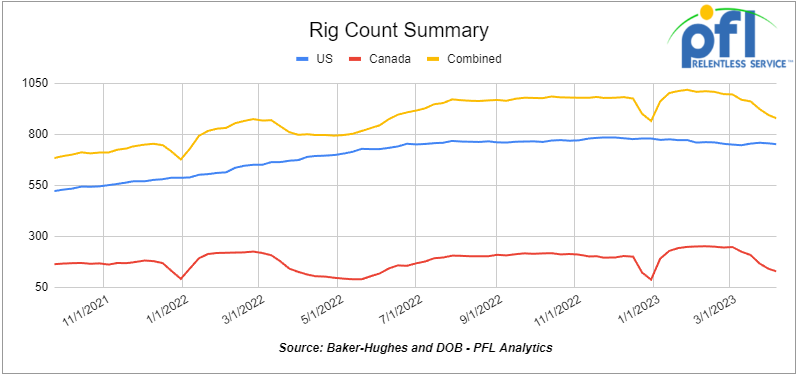
Rig Count
North American rig count was down by -16 rigs week over week. U.S. rig count was down -4 rigs week over week and up by +62 rigs year over year. The U.S. currently has 751 active rigs. Canada’s rig count was down by -12 rigs week-over-week and up by +16 rigs year over year. Canada’s overall rig count is 127 active rigs. Overall, year over year, we are up +78 rigs collectively.
International rig count which is reported monthly, was up by 15 rigs month-over-month and up 115 rigs year-over-year. Internationally there are 930 active rigs.
North American Rig Count Summary
A few things we are keeping an eye on
We are watching Petroleum Carloads
The four-week rolling average of petroleum carloads carried on the six largest North American railroads fell to 23,885 from 24,106, which was a loss of -221 rail cars week-over-week. Canadian volumes were mixed; CN’s shipments increased by +0.6% week over week, and CP’s volumes were lower by -17.7% week over week. U.S. shipments were also mixed. The BN had the largest percentage decrease and was down by -4.8% week over week. The NS had the largest percentage increase and was up by 8.1% week over week.
Here We Go Again – Another Veto by Joe Targeted on The Oil Patch
While Washington blames Oil Companies for not drilling and adding capacity and claim that they or Russia are responsible for high energy prices to the general public, behind the scene he is doing everything he can do to curb domestic energy growth. These latest moves continue to hurt energy prices, domestic jobs, and America’s Energy independence overall.
A congressional resolution that would have nullified an expansive Clean Water Act regulatory policy was vetoed on Thursday of last week by President Biden. The Biden administration’s approach to determining the jurisdiction of the Clean Water Act poses complications for oil and gas exploration, production, and pipeline plans as well as projects in many other industries. It is similar to the working definition of Clean Water Act jurisdiction used by the Obama administration.
“The 2023 revised definition of ‘Waters of the United States’ carefully sets the bounds for which bodies of water are protected under the Clean Water Act,” Biden said in his veto message to Congress. “It provides clear rules of the road that will help advance infrastructure projects, economic investments, and agricultural activities—all while protecting water quality and public health.”
In a nutshell, it seems that EPA and the Corps of Engineers tried to tie Clean Water Act jurisdiction to the commerce clause of the US Constitution, a clause that gives the federal government supremacy in regulating interstate commerce. Litigation has been ongoing, but at the end of the day the Feds want control over “waters of the United States.” The bill passed by Congress was to limit Washington’s involvement and reduce litigation.
The Washington mindset is having implications on Natural gas here in the U.S as the court stops the completion of the Mountain Valley Pipeline again that started construction 9 years ago. The court last week threw out the gas pipeline’s West Virginia water permit. The company building the long-delayed natural gas pipeline has lost a key water permit after a federal appeals court ruled that West Virginia didn’t adequately assess the impact of building the Mountain Valley Pipeline across streams and wetlands. Siding with environmental groups, the court said Monday of last week the state Department of Environmental Protection’s justifications for its 2021 water quality certification were “deficient,”. The 303-mile (487-kilometer) pipeline across rugged mountainsides in West Virginia and Virginia — which is mostly finished — would transport natural gas drilled from the Utica and Marcellus shale formations in Ohio and Pennsylvania. Legal battles have delayed completion for years, as environmental groups say construction has led to violations of regulations meant to control erosion and sedimentation. There is some hope for Natural Gas as Texas is commissioning $10 billion of expenditures for Natural gas-fired cogeneration to shore up its electrical grid and Freeport, the country’s second-largest LNG facility is back up and running at 100% capacity. Natural gas is important to U.S. energy security and plentiful, environmentally friendly and cheap! Natural gas closed at $2.011 per MMBTU on Thursday of last week down 14.1 cents per MMBTU day over day.
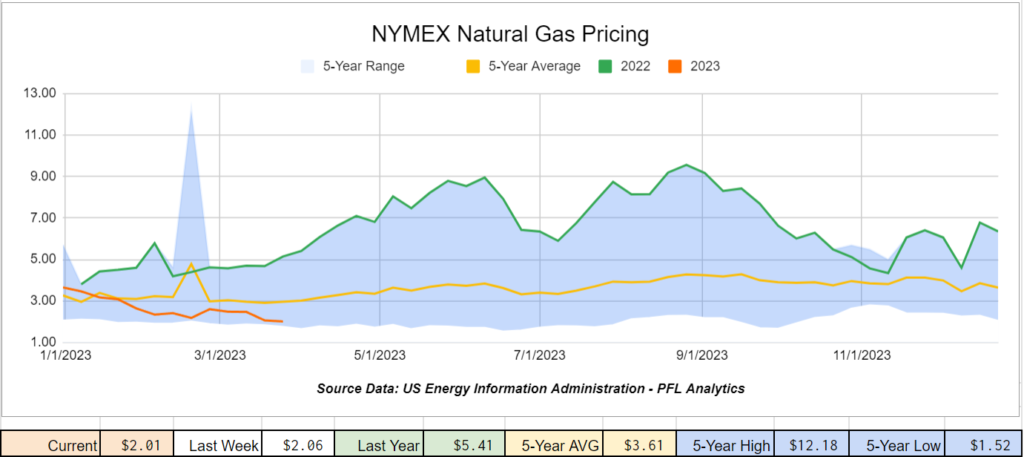
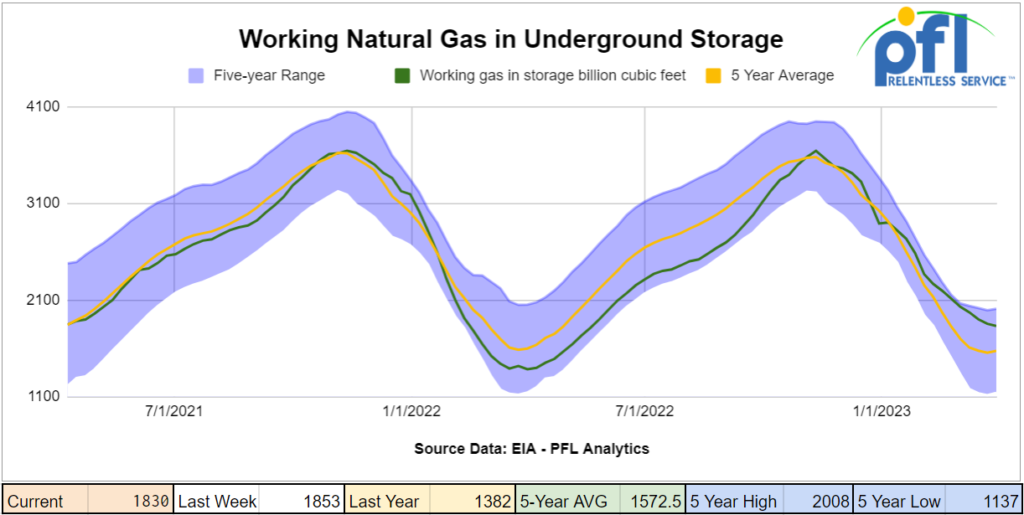
Working gas in storage is almost 500 bcf above the five-year average for this time of year and as we head into the shoulder months we are going to start to build inventory quickly. We as a nation need to start burning it! The more Natgas we use and consume the better it is for railing LPG’s such as propane.
Russian Oil Always Finds a Home and makes its way through the system data shows
Record high imports of crude oil from Russia in fiscal 2022-23 helped India’s refiners boost exports of diesel and jet fuel to Europe as the continent shunned Russian products, preliminary ship-tracking data from Kpler and Vortexa showed.
Access to cheap Russian crude has boosted output and profits at Indian refineries, enabling them to export refined products competitively to Europe and take bigger market share.
Europe typically imported an average of 154,000 barrels per day (bpd) of diesel and jet fuel from India before Russia’s invasion of Ukraine.
That increased to 200,000 bpd after the European Union banned Russian oil products imports from Feb. 5, Kpler data showed.
India’s imports of Russian crude in March rose for the seventh straight month to end the fiscal year as the top supplier to India, displacing Iraq for the first time, the data showed.
Indian refiners, which rarely bought Russian oil previously due to high transport costs, imported 970,000-981,000 bpd of it in 2022/23, accounting for more than a fifth of overall imports at 4.5-4.6 million bpd, Kpler and Vortexa data showed.
We are Watching Some Key Economic Indicators
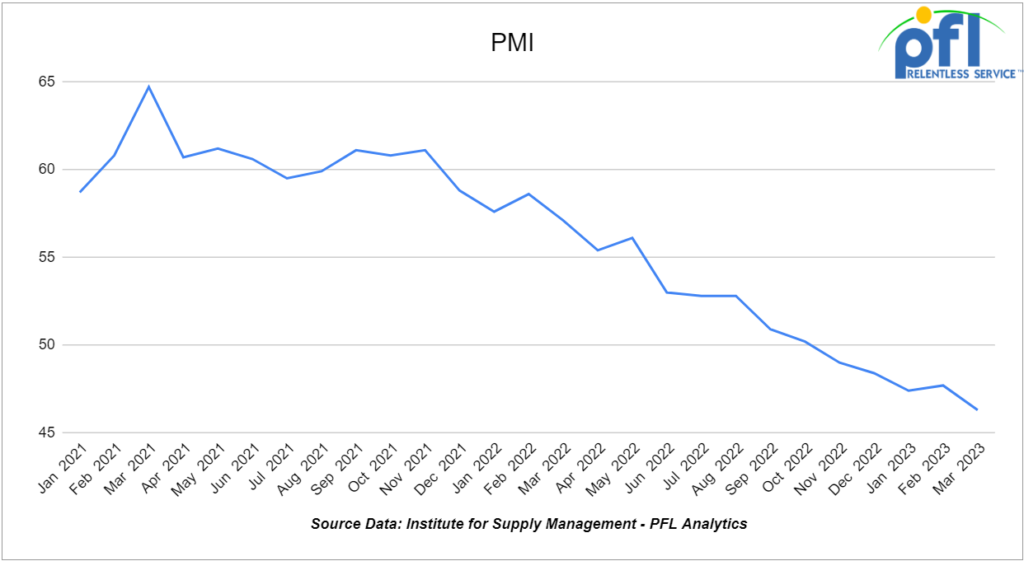
Purchasing Managers Index (PMI)
The Institute for Supply Management releases two PMI reports – one covering manufacturing and the other covering services. These reports are based on surveys of supply managers across the country and track changes in business activity. A reading above 50% on the index indicates expansion, while a reading below 50% signifies contraction, with a faster pace of change the farther the reading is from 50.
In March, the PMI decreased to 46.3% from February’s 47.7%, marking the six consecutive month of readings below 50%. Erasing the small month-over-month increase (+.03%) from February which was the only increase we have seen in the last seven months. Meanwhile, the new orders component also decreased from 47.0% in February to 44.3% in March.
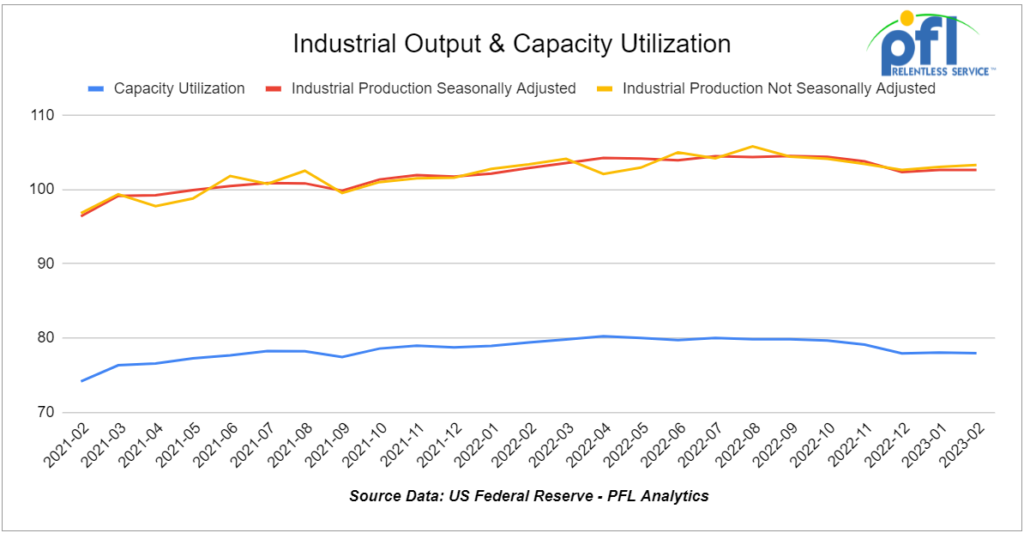
Industrial Output & Capacity Utilization
The Federal Reserve reported that total U.S. industrial output was flat in February 2023 from January 2023, while manufacturing output was up a fraction. Both output measures were below where they were in mid-2022, reflecting broad declines since then. Total output was down 0.2% in February 2023 from February 2022, its first year-over-year decline in two years. Year-over-year manufacturing output was down 1.0%, its second decline in the past three months.
Industries important to railroads, including paper, iron and steel, wood products, and grain mill products, have seen output generally fall over the past year. Motor vehicles are one of the few industries with output that’s trended higher.
The overall industrial capacity utilization rate was 78.0% in February, the same as in January and well below its most recent peak of 80.2% in April 2022. Capacity utilization for manufacturing was 77.6% in February, well below its recent peak seven of 80.0% in April 2022. Capacity utilization for manufacturing has fallen from one month to the next in seven of the past 10 months.
Each quarter the National Association of Manufacturers (NAM) surveys its membership. In the Q1 2023 survey, released March 27, 74.7% of respondents said they had a somewhat or very positive outlook for their company. That’s up from 68.9% in Q4 2022 but down from 75.6% in Q3 2022. Half of respondents said they expect a recession in 2023. Most of the rest are uncertain; fewer than 15% think the economy will avoid a recession this year. In Q1 2023, 56% of respondents said supply chain challenges were a primary business challenge, down from 88% a year ago.
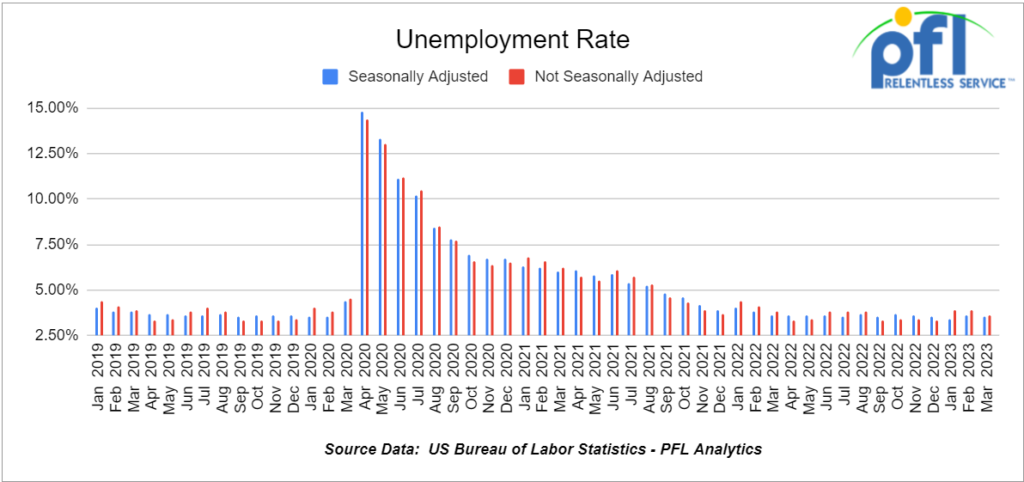
U.S. Unemployment Rate
In March, a preliminary and seasonally adjusted 236,000 net new jobs were created, according to the Bureau of Labor Statistics. That’s down from 326,000 in February; the fewest since December 2020 (though some other months since then were close); and in line with what most economists expected.
The official unemployment rate fell to 3.5% in March from 3.6% in February. It’s been in that general range for the past year.
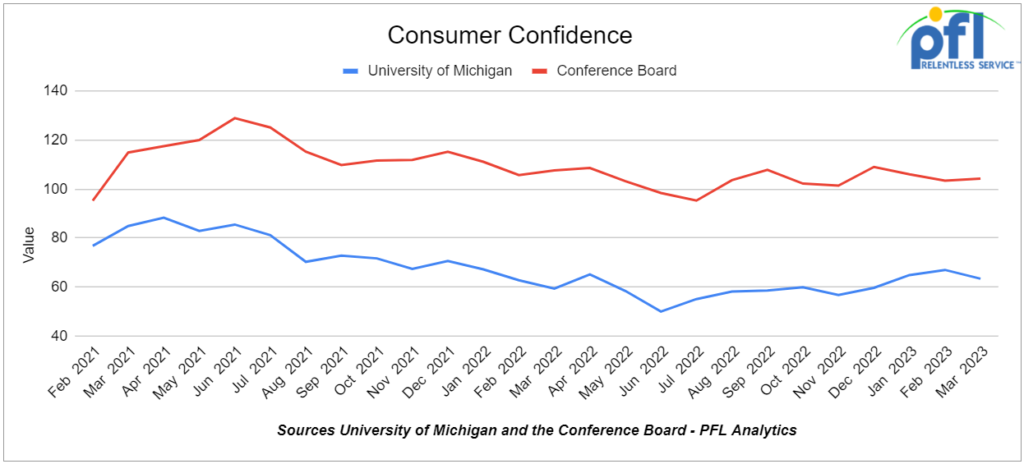
Consumer Confidence
The Conference Board’s Index of Consumer Confidence rose slightly in March to 104.2, up from 103.4 in February. Its most recent low was 95.3 in July 2022.
In a press release, the Conference Board said the Present Situation Index fell slightly in March while the Expectations Index rose. The Conference Board cautions, however, that for 12 of the last 13 months (including March), the Expectations Index has been at a level that often signals a recession within a year. Meanwhile, the index of consumer sentiment from the University of Michigan fell in March to its lowest point this year. March was the third consecutive month in which the Michigan index went one way and the Conference Board index went the other way.
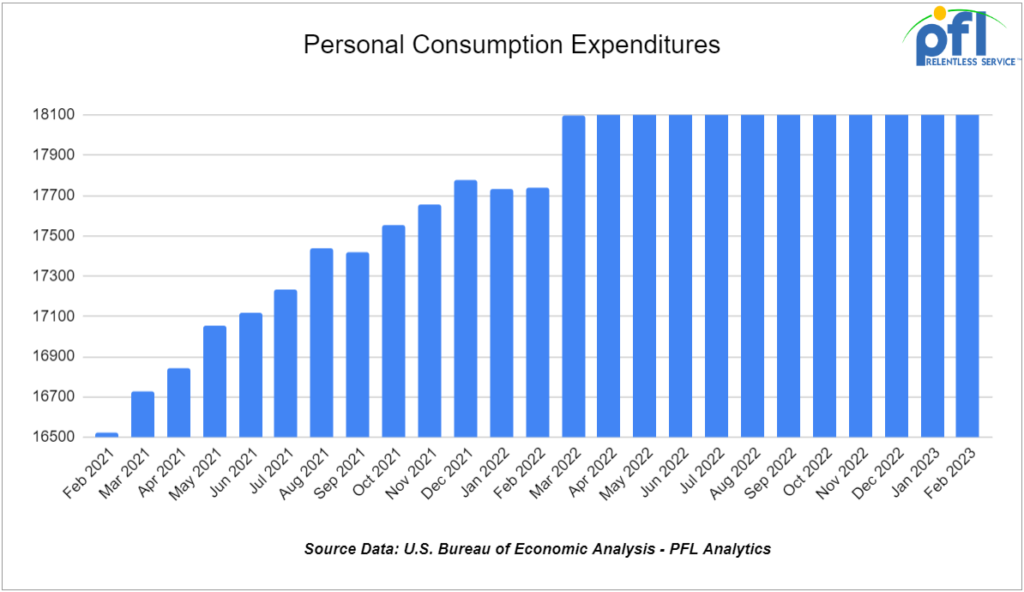
Consumer Spending
Consumer spending is sending mixed signals: it’s not clear what it’s doing or where it’s headed. Total spending not adjusted for inflation finished 2022 with a -0.2% decline in November and a miniscule increase in December. Prior to that, spending gains had been good (the average monthly gain for the rest of 2022 was 0.7%). In January came consumer spending surged by 2.0%.
In February, total consumer spending was up by 0.2% and suggests January may have been a fluke. Moreover, spending on goods, which is more important to railroads than spending on services, rose a negligible 0.03% in February. Adjusted for inflation, total spending actually fell 0.1% in February, the third inflation-adjusted decline in the past four months.
We have been extremely busy at PFL with return-on-lease programs involving rail car storage instead of returning cars to a shop. A quick turnaround is what we all want and need. Railcar storage in general has been extremely active. Please call PFL now at 239-390-2885 if you are looking for rail car storage, want to troubleshoot a return on lease scenario, or have storage availability. Whether you are a car owner, lessor or lessee, or even a class 1 that wants to help out a customer we are here to “help you help your customer!”
Leasing and Subleasing has been brisk as economic activity picks up. Inquiries have continued to be brisk and strong Call PFL Today for all your rail car needs 239-390-2885
Lease Bids
- 30, 17K-20K 117J Tanks needed off of UP or BN in Midwest/West Coast for 3-5 Years. Cars are needed for use in Caustic service.
- 20, 28.3K DOT 111, 117, CPC 1232 Tanks needed off of any class 1 in Bakersfield, CA for Month to Month. Cars are needed for use in Biodiesel service.
- 10, 286K 15.7K Tanks needed off of KCS in Texas for 1 Year. Cars are needed for use in Sulfuric Acid service. Needed Next few months
- 150, 23.5K DOT 111 Tanks needed off of any class 1 in LA for 2-3 Year. Cars are needed for use in Fluid service. Needed July
- 25-50, 32K 340W Pressure Tanks needed off of NS or CSX in Marcellus for 1-2 Years. Cars are needed for use in Propane service.
- 25-50, 30K DOT 111, 117, CPC 1232 Tanks needed off of CN or CP in WI, Sarnia for 1-2 Years. Cars are needed for use in Diesel service.
- 25-50, 30K DOT 111, 117, CPC 1232 Tanks needed off of any class 1 in Chicago for 1-2 Months. Cars are needed for use in Diesel service.
- 100, 30K DOT 111, 117, CPC 1232 Tanks needed off of any class 1 in Texas for 1 Year. Cars are needed for use in West Texas Sour service.
- 25-50, 25.5K CPC1232 or 117J Tanks needed off of UP or BN in any location for 3-5 Years. Cars are needed for use in Heavy Fuel Oil service.
- 40, 30K 117R or 117J Tanks needed off of CP in MN for 2 Years. Cars are needed for use in Ethanol service.
- 10, 5200cf PD Hoppers needed off of UP in Colorado for 1-3 years. Cars are needed for use in Silica service. Call for details
- 30-40, 286K DOT 113 Tanks needed off of CN or CP/ UP in Canada/MM for 5 Years. Cars are needed for use in CO2 service.
- 70, 32K 340W Pressure Tanks needed off of CP or CN in Edmonton for 3 Years. Cars are needed for use in Propane service.
- 200-300, 28.3K 117R or 117J Tanks needed off of CP or CN in Sarnia for 3 Years. Cars are needed for use in Fuel Oil service.
- 30, 30K DOT 111 Tanks needed off of UP in Texas for 1-3 Years. Cars are needed for use in Diesel service.
- 5-7, 28.3K 117R Tanks needed off of NS or CSX in NC for 1 Year. Cars are needed for use in UCO service.
- 25-50, 5000-5100 Lined Hoppers needed off of BNSF, CSX, KCS, UP in Gulf LA for 3-10 years. Cars are needed for use in dry sugar service. 3 bay gravity dump
- 25-50, 25.5K 117J Tanks needed off of NS CSX in NorthEast for 5 Years. Cars are needed for use in Asphalt/Heavy Fuel Oil service.
- 10-20, 20-25 CPC 1232 or 117J Tanks needed off of UP CN in Illinois for 3-5 years. Cars are needed for use in Liquid feed service.
- 100-150, 4000CF Covered Hoppers needed off of UP BN in Texas for Purchase or 5 years. Cars are needed for use in Aggregate service.
- 25, 30K 117Rs or Js Tanks needed off of UP or BN in Texas for 1-2 Years. Cars are needed for use in Diesel service.
- 25, 340W Pressure Tanks needed off of UP or BN in Texas for 1-2 Years. Cars are needed for use in Propane service.
- 25, 30K 117Rs or Js Tanks needed off of Any Class One in Midwest for 2-3 years. Cars are needed for use in Ethanol service.
- 10, any capacity Stainless Steel Tanks needed off of any class 1 in Canada for 5-10 years. Cars are needed for use in Alcohol service.
- 50-100, 25.5K CPC1232 or 117J Tanks needed off of any class 1 in any location for 5 Years. Cars are needed for use in Veg Oil service. Unlined
- 30-50, 30K 117 Tanks needed off of any class 1 in Northeast or Midwest for 1 Year. Cars are needed for use in C5 service. Must have Magrods
- 10-12, 340W Pressure Tanks needed off of UP in Utah to Cali for 1 year. Cars are needed for use in propane service. Needs them in April 2023
- 10-20, 340W Pressure Tanks needed off of CN or CP in Canada for 6 months to 1 year. Cars are needed for use in Propylene service. Immediate
- 100, 33K 340W Pressure Tanks needed off of CN in Canada for 3-5 Years. Cars are needed for use in Propane service.
- 25, 20.5K CPC1232 or 117J Tanks needed off of BNSF or UP in the west for 1-3 years. Cars are needed for use in magnesium chloride service. SDS onhand
- 10-100, 20K CPC1232 or 117J Tanks needed off of BNSF, CN or UP in the south or midwest for 5 years. Cars are needed for use in Urea Ammonium Nitrate service. CN Miss, BN Oklahoma, UP LA and Iowa- Must be lined
- 10, 50-60 footers Plate F Boxcars needed off of CN and UP or BNSF in Texas in Tennessee & Houston for 1 year. Cars are needed for use in Barium Sulfate service. Requires double door boxcars.
- Up to 60, 5150cf Covered Hoppers needed off of CN, CSX, NS in the east or midwest for 3 years. Cars are needed for use in Fertilizer service. 3-4 hatch gravity dumps
- 40, 2400cf Gondolas needed off of various class 1s in Indiana for 6 Months. Cars are needed for use in Rock service. Call for details
- 20-30, 14k Any Tanks needed off of BNSF, UP in Texas for 1-3 Years. Cars are needed for use in HCl service. Call for details
Sales Bids
- 20-25, 25.5K 117, DOT-111, CPC 1232 Tanks needed off of UP or BN in Texas. Cars are needed for use in Veg Oil service. Coiled and insulated
- 15, 30K 117, DOT-111, CPC 1232 Tanks needed off of UP or BN in Texas. Cars are needed for use in Veg Oil service.
- 16, Covered Hoppers needed off of UP or BN in Texas. 60′ Box cars with plug door
- 2-4, 28K Tanks needed off of BNSF Preferred in Minnesota. Cars are needed for use in Biodiesel service. Coiled and insulated
- 100, Plate F Boxcars needed off of BN or UP in Texas.
- 20, 2770 Mill Gondolas needed off of CSX in the northeast. Cars are needed for use in non-haz soil service. 52-60 ft
- 8, Hoppers needed off of various class 1s in various locations. Cars are needed for use in Plastic Pellet service.
- 10, 4000 Hoppers needed off of CSX in the northeast. Cars are needed for use in scrap metal service. Open top hopper
- 20-30, 3000 – 3300 PDs Hoppers needed off of BN or UP preferred in any location, but prefers the west. Cars are needed for use in Cement service. C612
- 20, 17K Tanks needed off of various class 1s in various locations. Cars are needed for use in corn syrup service.
- 100, 15.7K DOT 111 Tanks needed off of CSX or NS in the east. Cars are needed for use in Molten Sulfur service.
- 30, 17K-20K DOT 111 Tanks needed off of UP or BN in Texas. Cars are needed for use in UAN service.
- 30-40, 30K 117, DOT-111, CPC 1232 Tanks needed off of in . Cars are needed for use in CO2 & Ethanol service.
Lease Offers
- 100-200, 31.8, 1232 Tanks located off of BN in Chicago. Cars are clean Sale or Lease
- 70, 25.5K, 117J Tanks located off of UP in Texas. Cars are clean Call for information
- 50, 31.8K, CPC1232 Tanks located off of various class 1s in Texas. Cars were last used in Diesel. Call for information
- 150, 30K, DOT111 Tanks located off of various class 1s in various locations. Cars were last used in Ethanol. Call for information
- 100, 6400CF, Covered Hoppers located off of NS or CSX in NY. Cars are clean Brand New available for Sublease for 6-7 Months
- 30, 23.5K, DOT 111 Tanks located off of UP or BN in Texas. Cars were last used in Clean/UAN.
- 25-100, 17.6K, Dot 111 Tanks located off of UP or BN in Midwest. Cars were last used in Fertilizer/Corn Syurp. Free Move
- 20, 20k, Dot 111 Tanks located off of CSX in GA. Cars are clean
- 2, 20K, Dot 111 Tanks located off of UP in TX. Cars are clean
- 5, 20K, Dot 111 Tanks located off of UP in TX. Cars were last used in Sulfuirc Acid. Free Move
- 108, 28.3K, 117R Tanks located off of CN in Canada. Cars were last used in Crude. Free Move, Dirty to Dirty
Sales Offers
- 100, 28.3K, 117J Tanks located off of various class 1s in multiple locations. Clean
- 100, 30K, DOT 111 Tanks located off of various class 1s in multiple locations. Clean
- 100-200, 31.8K, CPC 1232` Tanks located off of BN in Chicago. Sale or Lease
Call PFL today to discuss your needs and our availability and market reach. Whether you are looking to lease cars, lease out cars, buy cars or sell cars call PFL today at 239-390-2885
PFL offers turn-key solutions to maximize your profitability. Our goal is to provide a win/win scenario for all and we can handle virtually all of your railcar needs. Whether it’s loaded storage, empty storage, subleasing or leasing excess cars, filling orders for cars wanted, mobile railcar cleaning, blasting, mobile railcar repair, or scrapping at strategic partner sites, PFL will do its best to assist you. PFL also assists fleets and lessors with leases and sales and offers Total Fleet Evaluation Services. We will analyze your current leases, storage, and company objectives to draw up a plan of action. We will save Lessor and Lessee the headache and aggravation of navigating through this rapidly changing landscape.
PFL IS READY TO CLEAN CARS TODAY ON A MOBILE BASIS WE ARE CURRENTLY IN EAST TEXAS
Live Railcar Markets
| CAT | Type | Capacity | GRL | QTY | LOC | Class | Prev. Use | Offer | Note |
|---|