
“The greatest teacher I know is the job itself.” – James Cash Penney
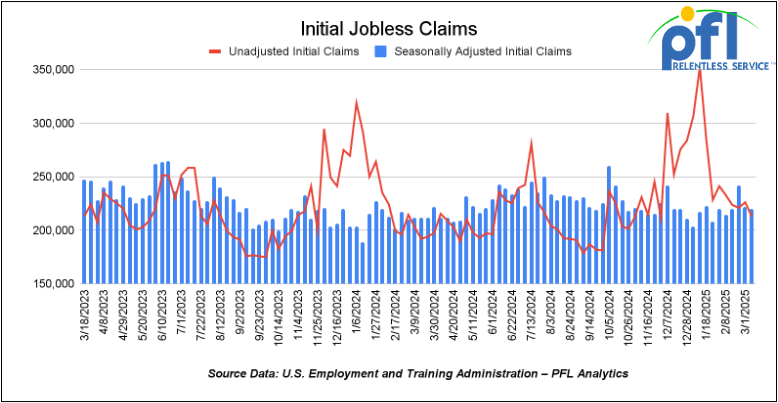
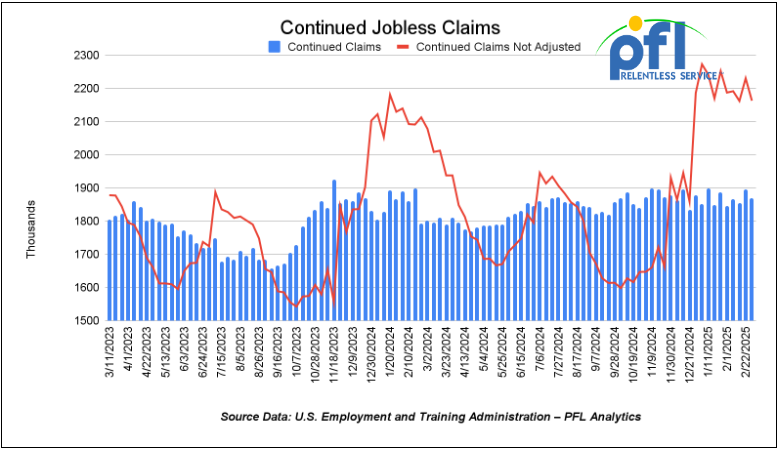
Jobs Update
- Initial jobless claims seasonally adjusted for the week ending March 8th came in at 220,000, down -2,000 people week-over-week.
- Continuing jobless claims came in at 1.87 million people, versus the adjusted number of 1.897 million people from the week prior, down -27,000 people week-over-week.
Stocks closed higher on Friday of last week, but lower week over week
The DOW closed higher on Friday of last week, up 674.62 points (1.65%) and closing out the week at 41,488.19, down -1,313.53 points week-over-week. The S&P 500 closed higher on Friday of last week, up 117.42 points, and closed out the week at 5,638.94, down -131.26 points week-over-week. The NASDAQ closed higher on Friday of last week, up 451.07 points (2.48%), and closed out the week at 17,754.09, down -442.14 points week-over-week.
In overnight trading, DOW futures traded lower and are expected to open at 41,393 this morning, down -117 points.
Crude oil closed higher on Friday of last week, but mixed week over week.
West Texas Intermediate (WTI) crude closed up $0.69 per barrel (1%), to close at $67.18 per barrel on Friday of last week, down -$0.24 per barrel week over week. Brent traded up $0.70 USD per barrel (1%) on Friday of last week, to close at $70.58 per barrel, up $3.16 per barrel week-over-week.
One Exchange WCS (Western Canadian Select) for April delivery settled on Friday of last week at US$10.55 below the WTI-CMA (West Texas Intermediate – Calendar Month Average). The implied value was US$55.59 per barrel.
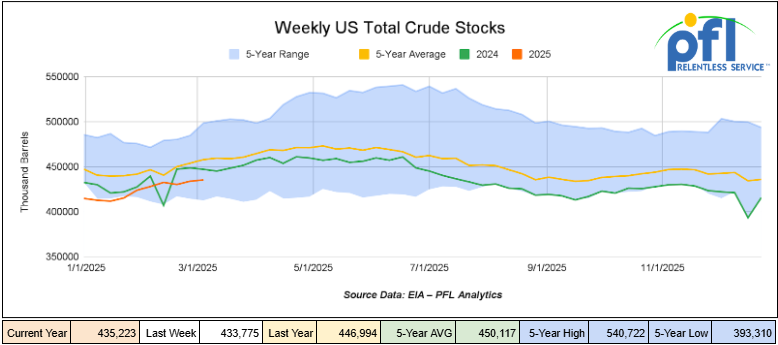
U.S. commercial crude oil inventories (excluding those in the Strategic Petroleum Reserve) increased by 1.4 million barrels week-over-week. At 435.2 million barrels, U.S. crude oil inventories are 5% below the five-year average for this time of year.
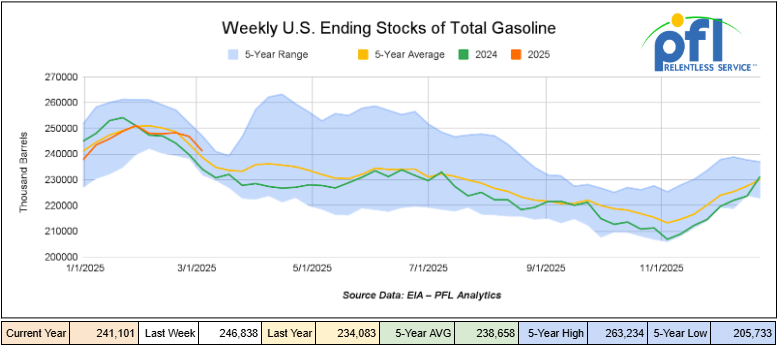
Total motor gasoline inventories decreased by 5.7 million barrels week-over-week and are 1% above the five-year average for this time of year.
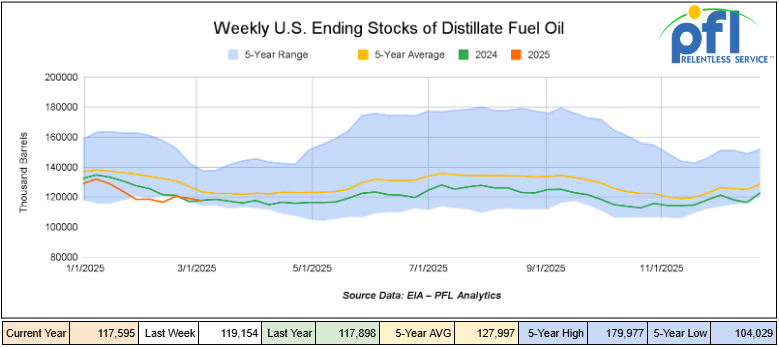
Distillate fuel inventories decreased by 1.6 million barrels week-over-week and are 5% below the five-year average for this time of year.
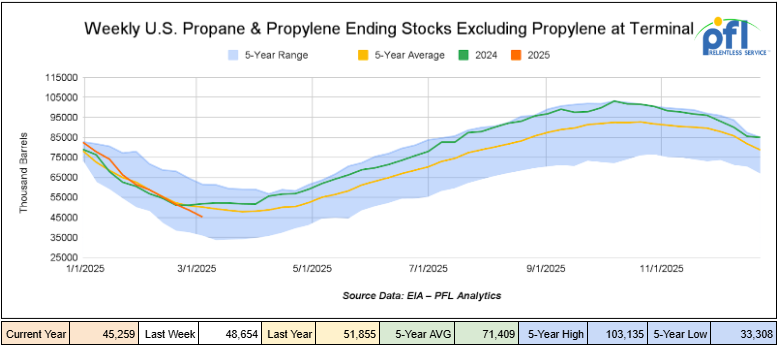
Propane/propylene inventories decreased by 3.4 million barrels week-over-week and are 10% below the five-year average for this time of year.
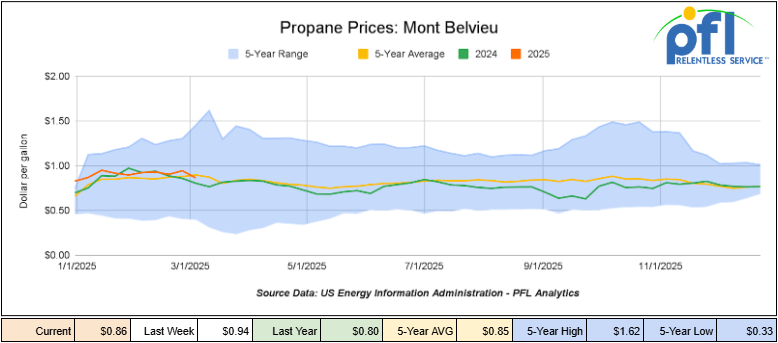
Propane prices closed at 86 cents per gallon on Friday of last week, down 8 cents per gallon week-over-week, and up 6 cents per gallon year-over-year.
Overall, total commercial petroleum inventories decreased by 6 million barrels during the week ending March 7th, 2025.
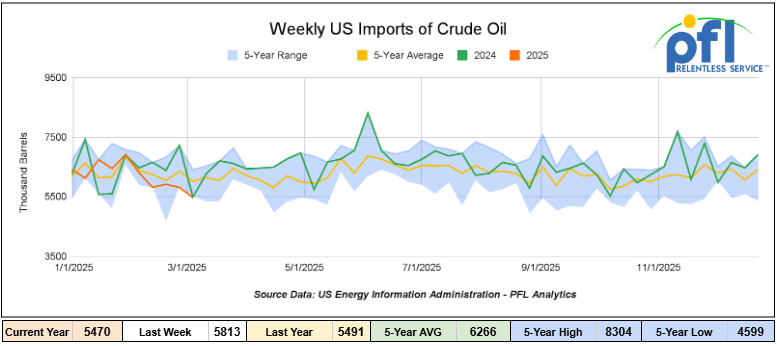
U.S. crude oil imports averaged 5.5 million barrels per day during the week ending March 7th, 2025, decreased by 343,000 barrels per day week-over-week. Over the past four weeks, crude oil imports averaged 5.8 million barrels per day, 10.6% less than the same four-week period last year. Total motor gasoline imports (including both finished gasoline and gasoline blending components) averaged 578,000 barrels per day, and distillate fuel imports averaged 249,000 barrels per day during the week ending March 7th, 2025.
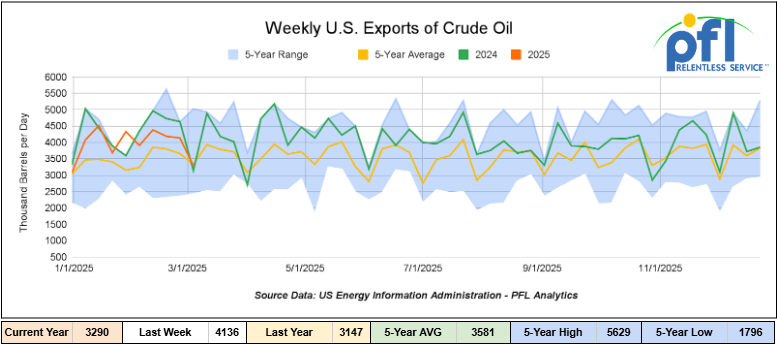
U.S. crude oil exports averaged 3.29 million barrels per day during the week ending March 7th, 2025, a decrease of 846,000 barrels per day week-over-week. Over the past four weeks, crude oil exports averaged 3.999 million barrels per day.
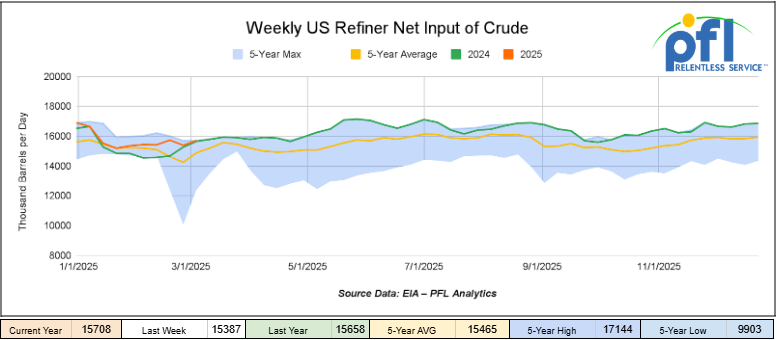
U.S. crude oil refinery inputs averaged 15.7 million barrels per day during the week ending March 7, 2025, which was 321,000 barrels per day more week-over-week.
WTI is poised to open at $68.03, up 85 cents per barrel from Friday’s close.
North American Rail Traffic
Week Ending March 12, 2025.
Total North American weekly rail volumes were up (3.87%) in week 11, compared with the same week last year. Total carloads for the week ending on March 12 were 346,954, up (1.95%) compared with the same week in 2024, while weekly intermodal volume was 345,554, up (5.86%) compared to the same week in 2024.
7 of the AAR’s 11 major traffic categories posted year-over-year increases. The largest increase came from Grain which was up (14.82%) while the largest decrease was from Metallic Ores and Metals which was down (-4.58%)
In the East, CSX’s total volumes were up (1.58%), with the largest decrease coming from Coal (-11.79%) while the largest increase came from Grain (16.64%). NS’s volumes were up (5.97%), with the largest increase coming from Grain (2023%) while the largest decrease came from Farm Products (-2.26%).
In the West, BN’s total volumes were up (3.52%), with the largest increase coming from Motor Vehicles and Parts (19.87%) while the largest decrease came from Nonmetallic Minerals (-14.58%). UP’s total rail volumes were up (7.27%), with the largest increase coming from Grain (36.46%), while the largest decrease came from Petroleum and Petroleum Products (-16.16%).
In Canada, CN’s total rail volumes were down (-6.12%) with the largest increase coming from Coal, up (+44.44%), while the largest decrease came from Intermodal (-25.37%). CP’s total rail volumes were up (0.17%) with the largest increase coming from Chemicals (+39.12%), while the largest decrease came from Other (-32.79%).
KCS’s total rail volumes were up (7.54%) with the largest increase coming from Other (+25.37%), while the largest decrease came from Chemicals (-12.84%).
Source Data: AAR – PFL Analytics
Rig Count
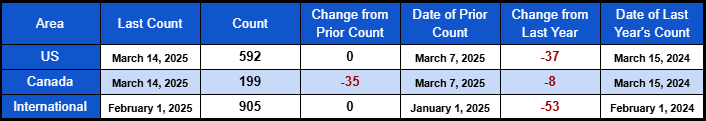
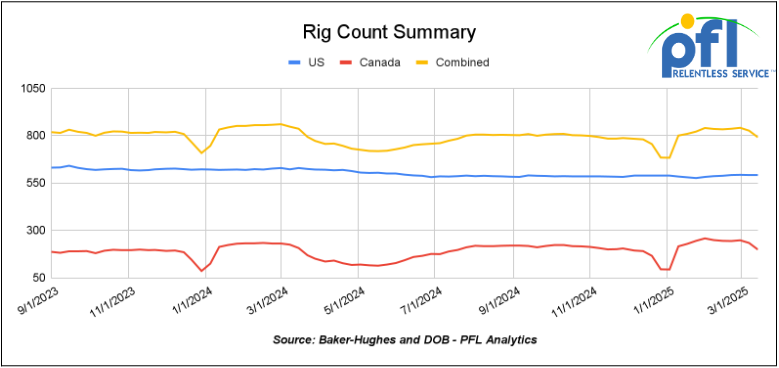
North American rig count was down by -35 rigs week-over-week. U.S. rig count was flat week over week, but down by -37 rigs year-over-year. The U.S. currently has 592 active rigs. Canada’s rig count was down -35 rigs week-over-week and down by -8 rigs year-over-year, and Canada’s overall rig count is 199 active rigs. Overall, year over year we are down by -45 rigs collectively.
North American Rig Count Summary
A few things we are watching:
North America Can Be an Energy Superpower, But Canada Needs To Be Self-Sufficient. Mike Rose From Tourmaline weighs in.
President and Chief Executive Officer Mike Rose from Tourmaline Oil Corp. wants more pipelines to displace Ontario’s imports and expand the distribution of Canadian energy. Mike delivered a keynote speech and participated in a question-and-answer session at last week’s Society of Petroleum Engineers Canadian Energy Technology Conference and Exhibition in Calgary.
He wants to make North America an Energy Superpower and believes that President Trump sees it the same way and believes tariffs will work themselves out.
According to Rose, the U.S. and Canada can jointly lead the world in lower-emissions hydrocarbon exports and ensure its allies are supplied in the “energy-hungry world.”
He then detailed steps Canada can take to ensure it can be completely self-sufficient and “evolve into that superpower on our own.”
In terms of oil, it starts with delivering energy east. He admits that’s easier said than done, “but we still import (1.25) million barrels a day down the St. Lawrence into Quebec.”
“But build that pipeline, and we’re energy self-sufficient,” Rose continued.
In terms of gas, it’s about displacing the roughly 1.5 bcf/d that Ontario presently gets from the Marcellus formation.
“There is room in the (TC Energy Corporation) Mainline to actually do that now,” said Rose, calling gas development particularly exciting.
“We think we can grow total basin production by 50 percent from where we are today.”
From there, Rose said: “You’ll have to extend it straight south to the Gulf, and that’s to feed that complex that’s going from 12 bcf/d to 25 bcf/d. At the same time, their main supply basins will be tipping.
“It’s all there for the taking,” he continued.
- Rose said that Canada can be shipping LNG off all three coasts (including Hudson Bay);
- NeeStaNan is an Indigenous-led project aimed at a multi-product utility corridor, including natural gas, connecting Alberta, Saskatchewan and Manitoba to tidewater on Hudson’s Bay.
Enbridge is bullish and expects significant oilsands supply growth over the next decade and is forecasting a jump in oilsands production. They are incrementally increasing capacity on their Mainline system to deliver additional supply to the U.S. Gulf Coast, president of liquids pipelines Colin Gruending said at the company’s Capital Day event in New York last week.
“We are bullish on Western Canada and have been for a long time,” Gruending said.
“The consensus view is 700,000 barrels per day of growth in the next 10 years. We think it will be one million barrels per day.”
Oil sand production is resilient, has low decline rates and low sustaining capital costs, and is able to weather any market storms.
According to Gruending, the current trade dispute with the U.S. is unlikely to have a long-term impact as U.S. refiners would struggle to find new supply sources and Canadian producers would be challenged finding new demand centers given egress constraints.
If the U.S. has a goal of “energy dominance,” as articulated by President Donald Trump, it is going to need all the Canadian supply available.
Longer term, Enbridge expects to see more “Canadian heavy getting exported off the Gulf Coast to the world,” he said.
The company has approximately $4 billion in growth projects underway to move more heavy oil out of the Western Canadian Sedimentary Basin (“WCSB”). It has up to 300,000 bbls/d of potential expansion opportunities on the Mainline. See below:

Source: Enbridge – PFL Analytics
We are watching Petroleum Carloads
The four-week rolling average of petroleum carloads carried on the six largest North American railroads rose to 28,449 from 28,289 which was an increase of 160 rail cars week-over-week. Canadian volumes were lower. CPKC’s shipments were lower by -0.2% week over week, CN’s volumes were lower by -3.8% week-over-week. U.S. shipments were mostly lower. The UP had the largest percentage decrease and was down by -3.7%. The CSX had was the sole gainer and was up by +6.8%.
We are Watching the Constitution Pipeline
Well, folks, the Trump Administration is revisiting the Constitution Pipeline, a long-debated natural gas project that could have major implications for energy prices and the freight rail industry. Originally proposed to transport natural gas from Pennsylvania to New York and New England, the pipeline was stopped in 2020 due to environmental opposition. Now, with renewed political support, the project is back in the spotlight and is expected to break ground this year.
Key Developments
- February 2025 – The Trump Administration signals support for restarting the pipeline, citing economic and energy security benefits.
- March 14, 2025 – Williams Cos, the company behind the project, states they are open to moving forward if federal approvals are granted.
- March 14, 2025 – New York Governor Kathy Hochul and President Donald Trump met at the White House to discuss the Constitution Pipeline. The meeting was called “productive,” but no agreements were made.
Supporters of the pipeline argue that the pipeline will:
- Expand energy supply in the Northeast, reducing dependency on imported fuels.
- Lower natural gas prices for consumers and businesses. New England, Connecticut and New York have some of the highest energy prices in the world because of a lack of pipeline connectivity.
- Create jobs and stimulate economic growth.
- Reduce reliance on rail and truck transport for natural gas and LPG shipments.
However, environmental groups and some state officials remain opposed, citing concerns over ecological impact and land use. Williams Cos has stated they will not proceed without strong state-level support, despite the Trump Administration’s backing.
The new pipeline would link gas fields in Pennsylvania to Schoharie County, stretching 124 miles through New York’s Southern Tier and western Catskills regions. From there, it would connect to existing pipelines that would carry the natural gas throughout New England. The capacity of the pipeline will be 650,000 million cubic feet per day (0.65 bcf per day).
Constitution Pipeline Proposed Route

Source: Williams – PFL Analytics
Natural Gas:
In other Natural gas news last week at CERAWeek 2025 hosted by S&P Global, energy leaders made one thing clear: natural gas is not just a short-term fix—it’s here to stay. Once considered a temporary solution on the way to renewables, it is now seen as a key part of the long-term energy mix. This shift could affect not only power grids and industries but also how energy moves across North America.
Natural gas has long been valued for being efficient, reliable, and widely available. It helps keep power grids stable, reduces emissions compared to coal (although clean burning coal plants can be built), and supports industries that can’t depend on renewables. Natural Gas demand growing, especially abroad, the U.S. has a chance to expand its role as a top energy supplier by increasing LNG exports, improving pipelines and building more pipelines here in the U.S., and upgrading current infrastructure.
This shift is already changing transportation. Railroads, a key part of the U.S. supply chain, are handling more shipments of natural gas, petrochemicals and LPG’s. There’s also growing interest in moving LNG by rail – a topic that had been stalled over safety concerns but is now apparently back on the table. We don’t think it makes any economic sense – cars are way too expensive, and the infrastructure needed at loading and unloading does not make sense – could be a pipe dream for some! Rail would benefit; however, the more natural gas produced the more LPG’s that are produced that will and can move on rail.
Railroads are also looking again at LNG and compressed natural gas (CNG) powered locomotives. While they’ve tested natural gas engines before, they haven’t been widely adopted. But with rising fuel costs and a push for lower emissions, the idea is gaining some traction. If LNG or CNG locomotives prove cost-effective, they could become a bigger part of freight rail’s future.
Looking beyond rail, investment in natural gas infrastructure is reshaping ports, highways, and supply chains. As the U.S. focuses on strengthening its energy security and making better use of its natural resources, natural gas is set to remain a major part of the energy landscape.
We are Watching Key Economic Indicators
Producer Price Index (“PPI”) Consumer Price Index (“CPI”)
In February 2025, the U.S. PPI remained unchanged month over month, following a 0.6% increase in January. On an annual basis, the PPI rose 3.2%, down from 3.7% in January, indicating a slight easing in wholesale inflation.
The CPI increased by 0.2% month over month, a slowdown from the 0.5% rise observed in January. This brought the annual inflation rate to 2.8%, down from 3.0% in January. Core CPI, which excludes food and energy, also rose by 0.2% over the month, leading to an annual core inflation rate of 3.1%

Lease Bids
- 10, 2500CF Open Top Hoppers needed off of UP or BN in Texas for 5 years. Cars are needed for use in aggregate service. Need Rapid Discharge Doors
- 25, 3230 PD Hoppers needed off of NS or CSX in Ohio for 5 years. Cars are needed for use in Flyash service.
- 100, 5200 Covered Hoppers needed off of UP or BN in Northwest for 6 month. Cars are needed for use in Pet Coke service. Roud Hatch, Bottom Outlet Doors
- 100, 4750 Covered Hoppers needed off of UP or BN in Texas for 1-5 Years. Cars are needed for use in Petcoke service.
- 50, 23.5-25.5 DOT111 Tanks needed off of Any Class 1 in USA for 5 years. Cars are needed for use in Asphalt service.
- 20, 25.5k CPC 1232 Tanks needed off of UP, BN, CSX, NS in OK, TX, Northeast for 3 Year. Cars are needed for use in Asphalt service.
- 10, 30K 117R or 117J Tanks needed off of Any Class 1 in USA for 1 year. Cars are needed for use in Glycerin service.
- 15-20, 29K 117R Tanks needed off of NS or CSX in Ohio for 6-12 Months. Cars are needed for use in Ply Oil service.
- 30-50, 23.5K Any Type Tanks needed off of any class 1 in any location for 1-5Years. Cars are needed for use in Glycols service.
- 10, Any Size Stainless Steel DOT111 Tanks needed off of UP or BN in TX for 1-5 Years. Cars are needed for use in Refined Products service.
- 100, 30K 117J Tanks needed off of UP or BN in Midwest for 5 Years. Cars are needed for use in Diesel service. Needed in Jan
- 10, 30K 117R Tanks needed off of CSX or NS in Southeast for 6 Months. Cars are needed for use in Crude service. Needed in Jan
- 20, 28K 117J Tanks needed off of CSX or NS in Midwest for 12 Months. Cars are needed for use in Crude service. Needed in Jan
- 50, 30K 117R/117J Tanks needed off of CSX in Northeast for 5 Year. Cars are needed for use in Refined Fuels service.
- 12, 28.3K Any Type Tanks needed off of UP or BN in Houston for 2Year. Cars are needed for use in Lube Oil service.
- 20, 30K 117J Tanks needed off of UP or BN in Midwest for 5 Years. Cars are needed for use in Ethanol service.
- 100, 30K 117J Tanks needed off of BN in Montana for 2 years. Cars are needed for use in Crude service.
- 10, 25.5K Any Type Tanks needed off of CSX in Florida for 2 Years. Cars are needed for use in UCO service.
- 10, 25.5K Any Type Tanks needed off of Any Class 1 in Any Location for 3-12 months. Cars are needed for use in Asphalt service.
- 20, GP Tanks needed off of various class 1s in various locations for 1-5 years.
Sales Bids
- 28, 3400CF Covered Hoppers needed off of UP BN in Texas. Cars are needed for use in Cement service. Cement Gates needed.
- 20, 17K DOT111 Tanks needed off of various class 1s in various locations. Cars are needed for use in corn syrup service.
Lease Offers
- 60, 4750, Covered Hoppers located off of UP or BN in Eads, CO. Cars are clean UP to 5 Years, 3 Hopper, Gravity Gate, Trough Hatches
- 50, 33K, 400W Pressure Tanks located off of All Class 1s in Chicago. Cars were last used in Propylene. 1 Year Term
- 50, 29K , DOT 111 Tanks located off of CN in Hamilton, ON. Cars were last used in Biodiesel. 1 year +
- 39, 30K, 117R Tanks located off of CN, NS, CSX in Detroit. Cars were last used in Diesel. 5 Years; Mid 2029 Return
- 20-25, 30K, 117J Tanks located off of BNSF in West Texas. Cars were last used in Ethanol. 1 year minimum
- 24, 25.5K-30K, DOT 111 Tanks located off of UP or BN in Texas. Cars were last used in Base Oils. 1-2 Year
Sales Offers
- 21, 50′, Plate C Boxcars located off of various class 1s in NM. End of Life
- 3, 50′, Plate C Boxcars located off of various class 1s in multiple locations. End of Life
- 27, 50′, Plate C Boxcars located off of various class 1s in PQ. End of Life
- 100-300, 3250, Covered Hoppers located off of various class 1s in multiple locations. Sand Cars
- 5, 2740, Mill Gondolas located off of various class 1s in NC. End of Life
- 1, 2260, Mill Gondolas located off of various class 1s in AL. End of Life
- 30, 2740, Mill Gondolas located off of various class 1s in multiple locations. End of Life
- 21, 2740, Mill Gondolas located off of various class 1s in WA. End of Life
- 15, 4750, Covered Hoppers located off of various class 1s in multiple locations. End of Life
- 5, 4750, Covered Hoppers located off of various class 1s in multiple locations. End of Life
- 50-100, 31.8K, CPC 1232 Tanks located off of UP or BN in TX. Requal Due in 2025
Call PFL today to discuss your needs and our availability and market reach. Whether you are looking to lease cars, lease out cars, buy cars, or sell cars call PFL today at 239-390-2885
Live Railcar Markets
| CAT | Type | Capacity | GRL | QTY | LOC | Class | Prev. Use | Offer | Note |
|---|
PFL will be at the Following Conferences

- Where: La Quinta, CA
- Attending: David Cohen (954-729-4774)
- Conference Website

- Where: Hyatt Regency Dallas in Dallas, TX
- Attending:Curtis Chandler (239.405.3365), David Cohen (954-729-4774), Brian Baker (239.297.4519), Cyndi Popov(403) 402-5043
- Conference Website