
“The shoe that fits one person pinches another; there is no recipe for living that suits all cases.”
Carl Jung
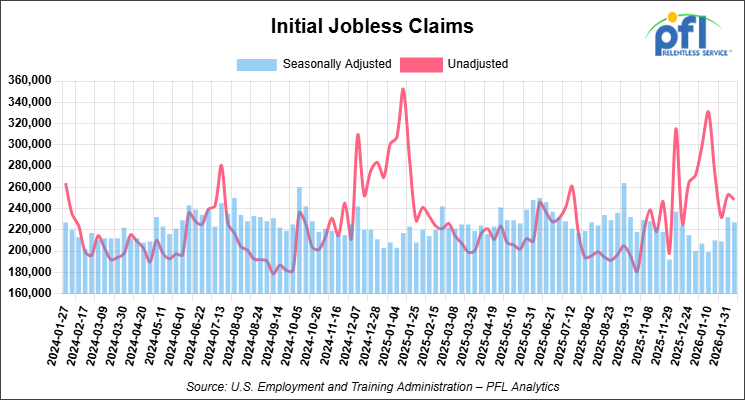
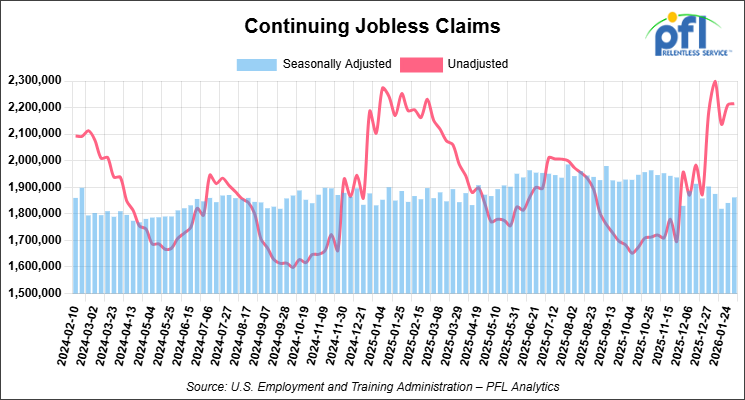
Jobs Update
- Initial jobless claims seasonally adjusted for the week ending February 7, 2026 came in at 227,000, versus the adjusted number of 232,000 people from the week prior, down 5,000 people week over week.
- Continuing jobless claims came in at 1,862,000, versus the adjusted number of 1,841,000 people from the week prior, up 21,000 week-over-week.
Stocks closed mixed on Friday of last week and lower week-over-week
The DOW closed higher on Friday of last week, up 48.95 points (0.10%), closing out the week at 49,500.93, down -614.74 points week-over-week. The S&P 500 closed higher on Friday of last week, up 3.41 points (0.05%), and closed out the week at 6,836.17, down -96.13 points week-over-week. The NASDAQ closed lower on Friday of last week, down -50.48 points (-0.22%), and closed out the week at 22,546.67, down -484.54 points week-over-week.
In overnight trading, DOW futures traded higher and are expected to open at 49,486 this morning, down 83 points from Friday’s close.
Crude oil closed higher on Friday of last week, but lower week-over-week
West Texas Intermediate (WTI) crude closed up +5 cents per barrel (0.1%), to close at $62.89 on Friday of last week, but down -66 cents week-over-week. Brent crude closed up +23 cents per barrel (0.3%), to close at $67.75, and down -30 cents week-over-week.
One Exchange WCS (Western Canadian Select) for March delivery settled on Friday of last week at US$15.80 below the WTI-CMA (West Texas Intermediate – Calendar Month Average). The implied value was US$46.79 per barrel.
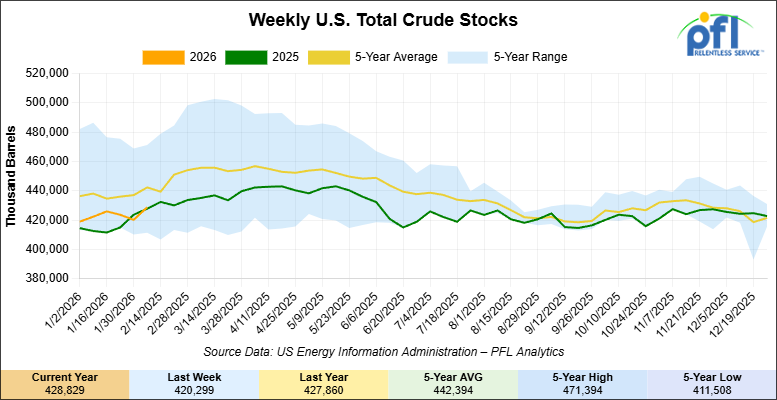
U.S. commercial crude oil inventories (excluding those in the Strategic Petroleum Reserve) increased by 8.5 million barrels week-over-week. At 428.8 million barrels, U.S. crude oil inventories are 3% below the five-year average for this time of year.
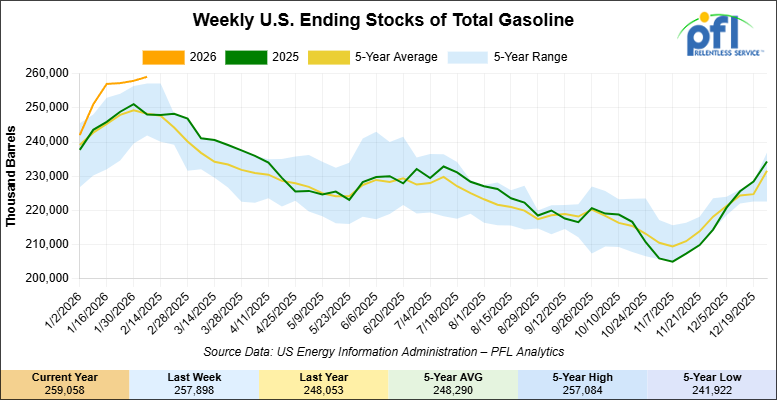
Total motor gasoline inventories increased by 1.2 million barrels week-over-week and are 4% above the five-year average for this time of year.
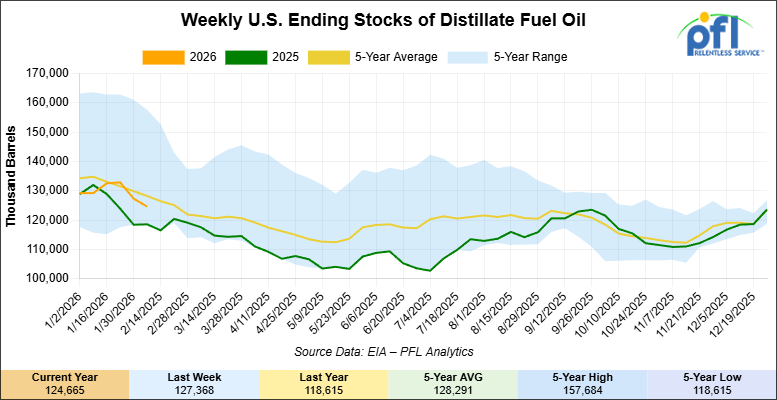
Distillate fuel inventories decreased by 2.7 million barrels week-over-week and are 4% below the five-year average for this time of year.
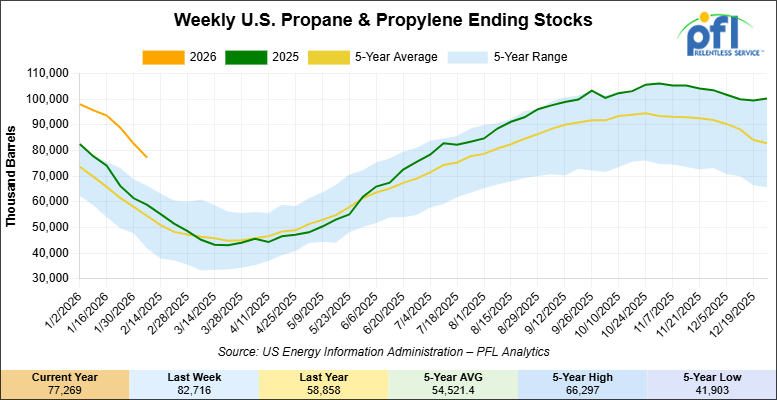
Propane/propylene inventories decreased 5.4 million barrels week-over-week and are 36% above the five-year average for this time of year.
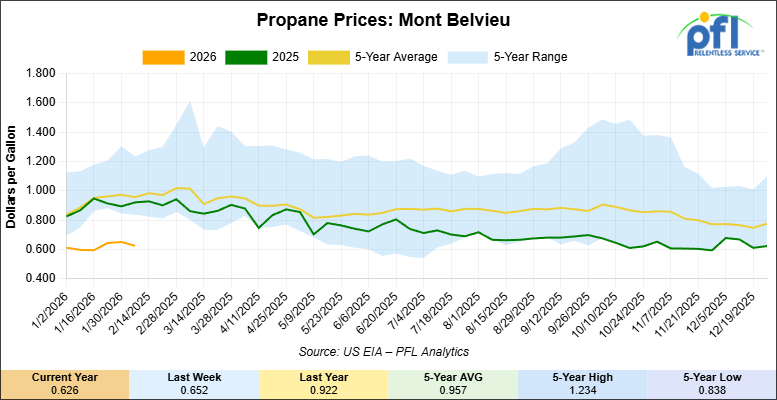
Propane prices closed at 62.6 cents per gallon on Friday of last week, down 2.6 cents per gallon week-over-week, and down 29.6 cents year-over-year.
Overall, total commercial petroleum inventories decreased by 1.7 million barrels week-over-week, during the week ending February 6, 2026.
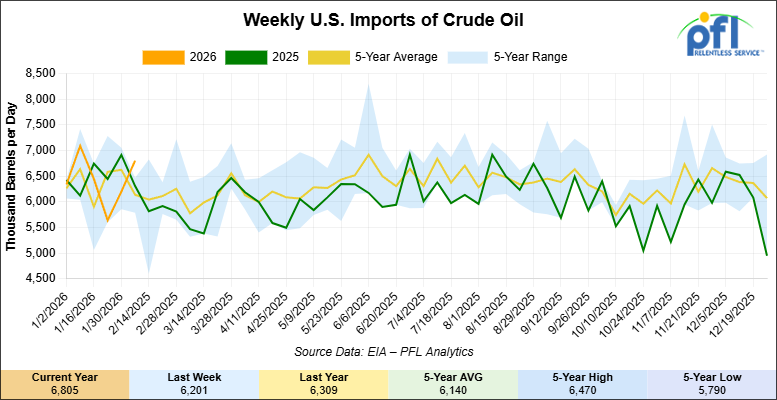
U.S. crude oil imports averaged 6.8 million barrels per day last week, an increase of 604,000 barrels per day week-over-week. Over the past four weeks, crude oil imports averaged about 6.3 million barrels per day, 5% less than the same four-week period last year. Total motor gasoline imports (including both finished gasoline and gasoline blending components) averaged 365,000 barrels per day, and distillate fuel imports averaged 151,000 barrels per day during the week ending February 6, 2026.
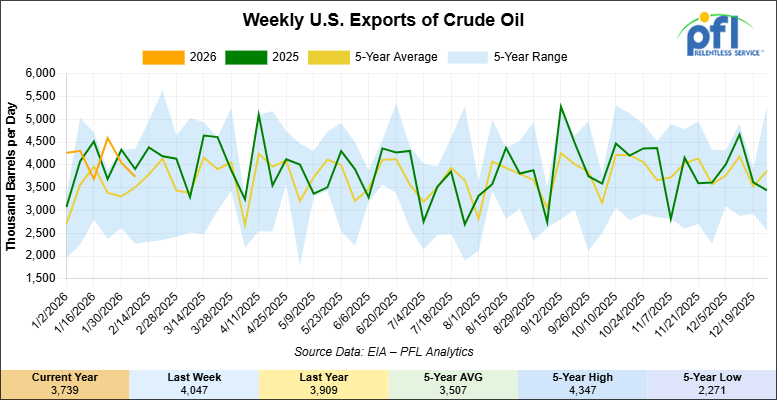
U.S. crude oil exports averaged 3.739 million barrels per day during the week ending February 6, 2026, a decrease of 308,000 barrels per day week-over-week. Over the past four weeks, crude oil exports averaged 4.016 million barrels per day.
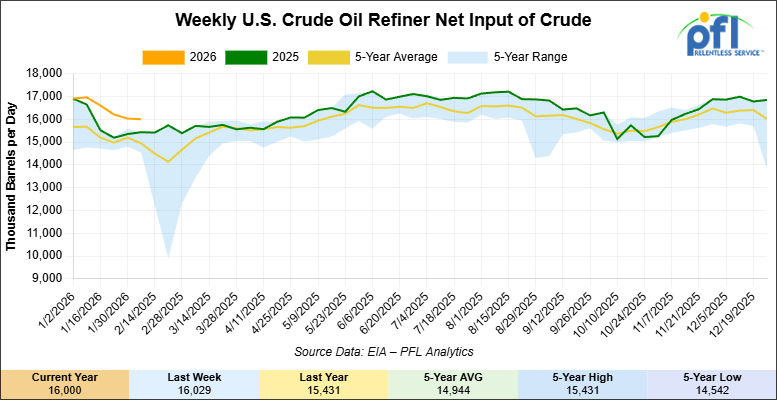
U.S. crude oil refinery inputs averaged 16 million barrels per day during the week ending February 6, 2026, which was 29,000 barrels per day less week-over-week.
WTI is poised to open at $63.67, up 92 cents per barrel from Friday’s close.
North American Rail Traffic
Week Ending February 11, 2026:
Total North American weekly rail volumes were down (-5.01%) in week 7, compared with the same week last year. Total Carloads for the week ending February 11, 2026 were 306,102, down (-4.40%) compared with the same week in 2025, while weekly Intermodal volume was 335,686, down (-5.55%) year over year. 9 of the AAR’s 11 major traffic categories posted year-over-year decreases. The largest decrease came from Forest Products (-22.15%). The largest increase was Grain (+9.07%).
In the East, CSX’s total volumes were down (-4.30%), with the largest decrease coming from Coal (-22.93%), while the largest increase came from Intermodal Units (+2.22%). NS’s total volumes were down (-10.61%), with the largest increase coming from Petroleum & Petroleum Products (+6.43%), while the largest decrease came from Coal (-25.60%).
In the West, BNSF’s total volumes were up (+0.91%), with the largest increase coming from Petroleum & Petroleum Products (+23.92%), while the largest decrease came from Coal (-24.31%). UP’s total volumes were down (-3.50%), with the largest increase coming from Grain (+17.59%), while the largest decrease came from Forest Products (-12.68%).
In Canada, CN’s total volumes were up (+5.24%), with the largest increase coming from Grain (+35.16%), while the largest decrease came from Other (-31.10%). CPKCS’s total volumes were down (-30.42%), with the largest increase coming from Other (+16.22%), while the largest decrease came from Forest Products (-66.99%).
Source Data: AAR – PFL Analytics
North American Rig Count Summary
Rig Count
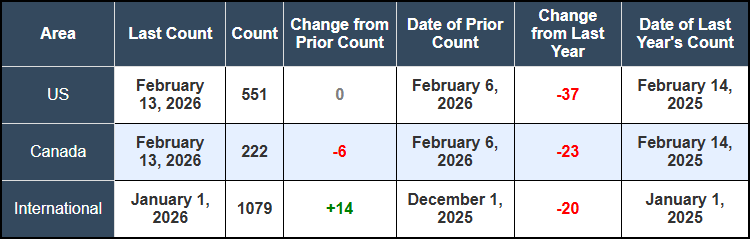
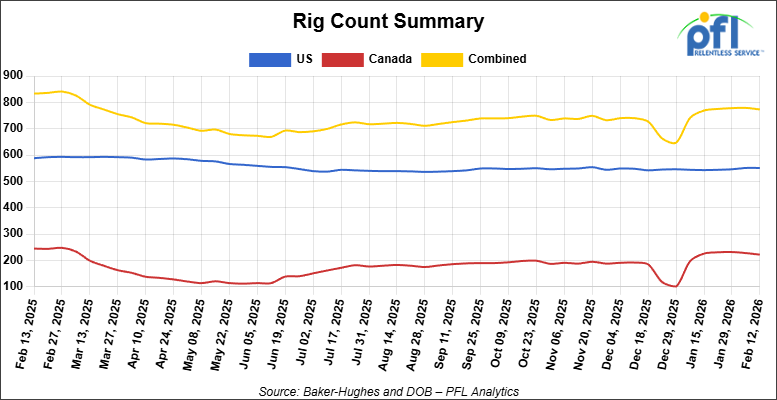
North American rig count was down by -6 rigs week-over-week. The U.S. rig count was unchanged week-over-week, but down by -37 rigs year-over-year. The U.S. currently has 551 active rigs. Canada’s rig count was down by -6 rigs week-over-week and down by -23 rigs year-over-year. Canada currently has 222 active rigs. Overall, year-over-year we are down by -60 rigs collectively.
We are watching a few things out there for you:
We are Watching Petroleum Carloads
The four-week rolling average of petroleum carloads carried on the six largest North American railroads fell to 29,173 from 29,625 which was a decrease of -452 rail cars week-over-week. Canadian volumes were mixed. CN’s shipments were lower by -2.0% week-over-week, CPKC’s volumes were higher by +3.0% week-over-week. U.S. shipments were also mixed. The NS had the largest percentage increase and was up by +9.0%. The CSX had the largest percentage decrease and was down by -6.0%.
We are Watching Canadian Crude Flows
Canadian oil exports hit record levels while crude-by-rail collapsed to eight-year lows, highlighting how dramatically the Trans Mountain expansion has reshaped North American energy logistics.
Fresh data released from Stats Canada last week confirms the scale of the shift. Canada exported 4.44 million barrels per day in November, up from 4.21 million b/d a year earlier, according to Statistics Canada. But, the story beneath that headline is striking: exports to non-U.S. countries nearly tripled to 676,000 b/d, up from just 234,000 b/d in November 2024. Asian demand drove the surge, with the expanded Trans Mountain pipeline finally providing meaningful waterborne access to Pacific markets. The 890,000 b/d system, which came online in May 2024 after adding 590,000 b/d of capacity, now moves roughly 15% of Canada’s total crude exports to buyers that don’t require routing through the United States.
Alberta production hit a record 4.4 million b/d in November of 2025, and Prime Minister Carney has made expanding energy exports to China and India a centerpiece of his effort to reduce dependence on U.S. markets. Trans Mountain plans further expansions totaling 300,000 b/d, with the first 100,000 b/d increase targeted for January 2027. Meanwhile, Alberta wants to build another pipeline to the west coast with at least 1 million b/d of capacity.
The flip side – Rail has been pushed to the margins. Canadian crude-by-rail exports averaged just 88,700 b/d in 2024, down 10% from 2023. So far in 2025 (still waiting on December data from the Canadian Energy Regulator) the country has exported an average of 76,791 barrels per day – lowest level since 2016, according to Canada Energy Regulator data. Rail becomes economic only when WCS-WTI differentials widen past certain thresholds, and with differentials narrowing post -TMX, the math doesn’t work for most shippers in this low priced crude environment we seem to find ourselves in.
We are Watching Trump
President Trump is privately weighing whether to withdraw from the CUSMA trade pact he negotiated, according to reports last week. The move would mark one of the most significant reversals in North American trade policy in decades and would immediately disrupt cross-border rail traffic that has operated under relatively stable rules since 1994.
Five Republicans broke ranks last Wednesday to join Democrats in blocking an extension of tariffs on Canadian goods, delivering a blow to House Speaker Mike Johnson, who had been holding the line on Trump’s trade measures. Johnson later said that Trump could veto any tariff rollback if it reaches his desk, but the congressional pushback signals eroding support for the administration’s trade war even within the president’s own party. Senate Democratic leader Chuck Schumer said both chambers have now rejected Trump’s “phony emergency and fabricated trade war,” while the Republican-controlled Senate also voted to abandon tariffs on Brazil and other emergency global duties.
The Supreme Court is expected to rule on the legality of Trump’s tariffs as soon as February 20, which could force the administration’s hand one way or another.
For railroads, CUSMA withdrawal would be catastrophic. Cross-border rail movements between the U.S., Canada, and Mexico have grown substantially under the agreement, with integrated supply chains depending on predictable tariff-free treatment. Automotive parts routinely cross borders multiple times during production. Grain, energy products, and intermodal containers move seamlessly north and south. A sudden shift to World Trade Organization rules or worse would inject massive uncertainty into routing decisions, pricing, and long-term contracts.
Even the threat of withdrawal creates problems. Shippers are already dealing with the policy whiplash from conflicting signals out of Washington. Now they have to game out scenarios where the foundational trade framework for North America simply disappears. PFL clients moving cross-border freight need to stay close to this. L Give the desk a call, we can help you!
We are Watching Trucking
Intermodal is having a moment, and it’s not because freight demand is surging. It’s because trucking capacity is bleeding out.
Spot rates and tender rejections stayed elevated despite volumes running 6-7% below year-ago levels, a clear signal the market shift is supply-driven, not demand-led. Carriers continue leaving lanes and reducing fleets after years of attrition and stretched balance sheets. The result: higher spot rates, rising tender rejections, and greater route-guide noncompliance even with weak baseline volumes post-holiday.
Shippers are responding by moving freight to intermodal where the lanes make sense. C.H. Robinson reported “interest in converting truckload shipments to intermodal surged“ due to tightening over-the-road capacity, a trend continuing into RFP season as shippers target cost savings on longer hauls where intermodal pencils. Railroads are holding pricing relatively flat, keeping intermodal competitive with truckload rates and maintaining service metrics that have been solid for 30 consecutive weeks.
This isn’t about intermodal stealing share through better service or lower prices. It’s about trucking’s structural capacity problems making rail look attractive again. Union Pacific cut its priority LA-to-Chicago service to three days. BNSF and CSX introduced nine new intermodal schedules from California to the Ohio Valley and Northeast. Norfolk Southern and UP launched new outbound service from Louisville to the West Coast. These moves are tactical responses to demand that’s flowing their way because over-the-road alternatives are either unavailable or prohibitively expensive.
U.S. rail intermodal volume fell 3.4% in December 2025 from a year earlier, the fourth consecutive month of year-over-year decline, so it’s not like the sector is booming. But, the setup for 2026 looks better than it did six months ago, largely because the trucker pain is real and likely to persist. If contract trucking rates move up in the back half, intermodal could see volume growth for the first time since early 2025.
For PFL’s intermodal customers, now is a good time to lock in coverage on longer lanes. The pricing window won’t stay open if trucking starts adding capacity.
We are Watching Coal
Coal was supposed to fade cleanly. Instead, it’s a stubborn, cash-flow-relevant anomaly. While U.S. power generation continues a long-term shift away from coal, demand has proven highly sensitive to stress: weather events, export market volatility, grid reliability concerns, and geopolitical energy shocks. Railroads sit squarely in the middle of that stress response.
One important nuance is export coal, particularly metallurgical coal used in steelmaking. When global steel demand rises or supply disruptions hit Australia or Russia, U.S. coal suddenly becomes marginal supply again. These swings translate directly into rail volume surges on corridors feeding East Coast and Gulf export terminals. Unlike domestic utility coal, export volumes tend to move long distances at higher rates, making them disproportionately profitable even at modest volume levels.
What makes coal uniquely attractive to railroads at this stage is not growth, but capital efficiency. The infrastructure is fully depreciated. The locomotives, crews, and terminals already exist. Incremental coal traffic flows through networks with minimal incremental cost, producing strong contribution margins even as total coal volumes trend downward. In effect, coal has become a harvest asset: one that railroads no longer optimize for growth, but one they are happy to monetize as long as it shows up. Investors may discount coal’s future, but the cash it throws off today helps fund dividends, buybacks, and capital investment elsewhere on the network.
Coal’s persistence is also being reinforced by policy intervention. DOE forced Consumers Energy to delay closure of its J.H. Campbell coal plant in Michigan. When one large facility is forced to remain online, it tightens coal supply logistics across a broader regional system. Mines remain active longer than planned, rail contracts are extended rather than wound down, and supporting infrastructure stays utilized. In the Midwest and parts of the Southeast, railroads have seen coal volumes stabilize and in certain corridors modestly rebound, not because demand is growing structurally, but because retirements are proving harder to execute than anticipated.
Utilities are quietly reassessing closure timelines as reserve margins shrink and peak-load risk rises. While few are announcing outright reversals, several are delaying decommissioning, maintaining dual-fuel flexibility, or running coal units at higher capacity factors during periods of stress. Each of those decisions translates directly into incremental rail carloads that were assumed to be gone.
From the railroads’ perspective, the impact is disproportionately positive. Coal traffic moves in long, dense unit trains that efficiently absorb network capacity. Even flat or slightly higher volumes can meaningfully support cash flow because the cost structure is already in place and largely depreciated. Unlike growth commodities that require new terminals or equipment, coal simply keeps moving on rails that were built decades ago and never stopped working.
The takeaway is not that coal is “back,” but that it is exiting more slowly and opportunistically than consensus models suggest. As long as utilities prioritize reliability, railroads will continue to extract value from a commodity that was supposed to have already left the building.
We are Watching Left Wing Carney
Prime Minister Mark Carney made a significant policy reversal on November 27th, when he signed a memorandum of understanding with Alberta that allows enhanced oil recovery (EOR) projects to qualify for federal carbon capture tax credits. Ottawa had explicitly banned this since 2021. The move ties Alberta’s massive $16.5 billion Pathways Alliance carbon capture project directly to approval of a new oil pipeline to the West Coast. Neither can proceed without the other.
Here’s the thing: this is how carbon capture should have been done all along. Enhanced oil recovery kills two birds with one stone. You permanently store industrial CO₂ emissions underground while extracting additional oil from depleting reservoirs. Pure carbon storage, where you capture CO₂ and just bury it, is economically stupid when you can use that same captured carbon to increase oil production and extend the life of mature fields. It is already done successfully at sites like Whitecap Resources’ facility near Estevan, Saskatchewan, which uses CO₂ purchased from the coal-fired Boundary Dam Power Station.
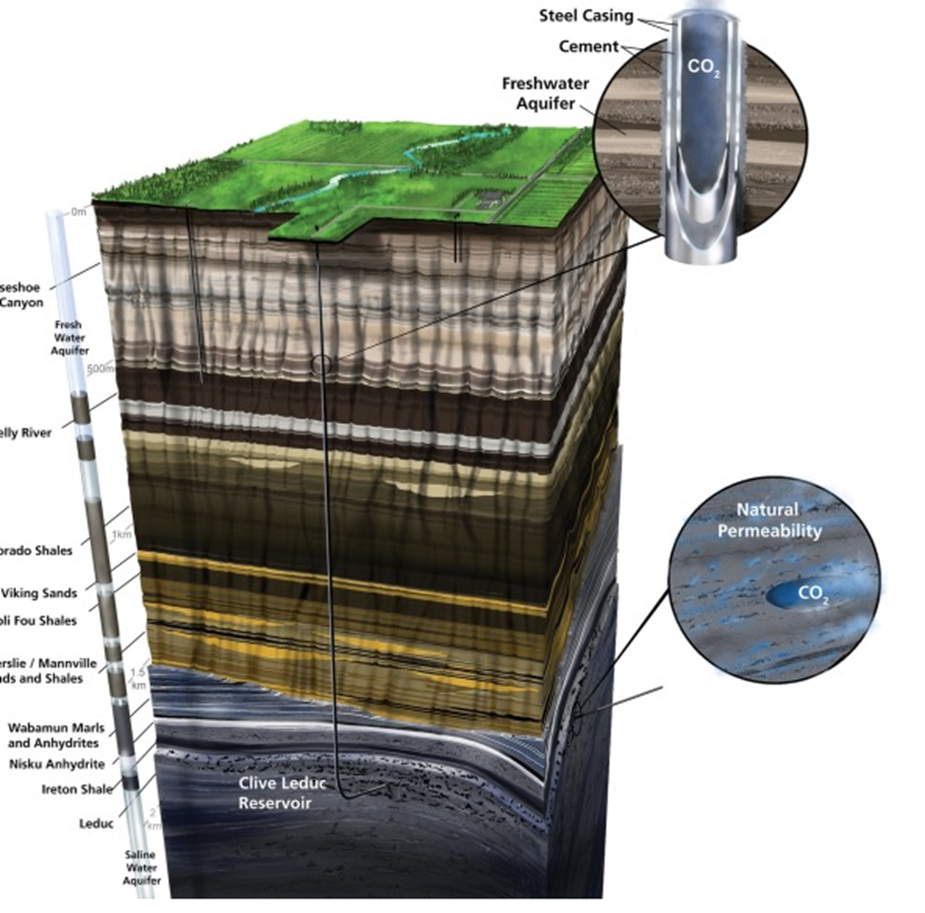
How Enhanced Oil Recovery Works: CO₂ captured from industrial emitters can be separated, compressed, and transported via pipeline or rail to mature oil fields. Once it reaches the injection site, the CO₂ is pumped into depleting reservoirs, creating increased pressure that pushes additional oil to the surface. The CO₂ remains permanently stored underground. It’s not released back into the atmosphere. This is a true win-win: you sequester carbon AND produce more oil from fields that would otherwise be abandoned.
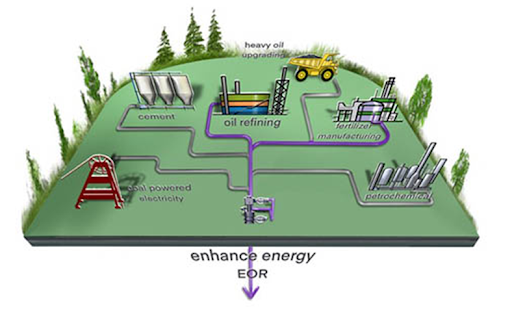
Once the CO₂ reaches its destination it is injected into the depleting reservoir.
Alberta Carbon Trunk Line (ACTL), completed in 2020, demonstrates this works at scale. It’s the world’s largest capacity CO₂ pipeline, capable of transporting up to 14.6 million tonnes of CO₂ per year. That represents 20% of all current oil sands emissions or the equivalent of capturing CO₂from more than 2.6 million cars. The system captures CO₂ at the North West Redwater Partnership Sturgeon Refinery and Nutrien’s Redwater Fertilizer Facility, then transports it to mature oil fields for injection. It works. It’s profitable. And it should have been the model from day one.
Carney’s policy shift now allows projects like Pathways Alliance to access federal investment tax credits covering up to 50 percent of capital costs, with Alberta adding another 12 percent. The Pathways project would build a 400-kilometer pipeline connecting over 20 oilsands facilities to an underground storage hub near Cold Lake, Alberta. The federal government had previously refused to subsidize EOR, insisting that carbon capture projects could only receive tax credits for “pure” storage where the CO₂ is buried and left alone.
That policy was never a very good one. If you’re going to spend billions capturing industrial carbon emissions, why NOT use it productively? The carbon stays underground either way, but with EOR you get economic value from enhanced production. Canada already possesses world-leading carbon capture technology. The ACTL system proves the infrastructure can be built and operated profitably.
The Rail Angle:
If EOR scales up as promised, it could create demand for specialized railcars to transport compressed CO₂ from industrial capture facilities to injection sites although these cars are very expensive to build. This is important for emitters not directly connected to pipeline infrastructure. You need pressure cars rated for supercritical CO₂, and you need a lot of them if this expands beyond the Pathways project. Could be new demand for rail equipment and logistics that doesn’t currently exist at scale.
So Is Carney Waking Up? Maybe. But we’re skeptical. Carney has publicly admitted Canada will miss its 2030 and 2035 climate targets under current policies. The proof will be in Carney’s actions. Does the Pathways project actually get built, or does it stall out over operational cost disputes like it did under Trudeau? Does the promised West Coast pipeline materialize, or does environmental opposition kill it? Does Alberta’s industrial carbon price stay frozen at $95 per tonne, undermining the entire economic case for carbon capture?
Carney may have finally figured out that EOR is the only economically viable path for large-scale carbon capture in Canada’s oil patch. But figuring it out in late 2025, after years of banning EOR from federal subsidies, means we’ve lost half a decade when this infrastructure could have been getting built. If he’s serious, we’ll see shovels in the ground soon. If not, this is just another announcement designed to keep Alberta happy while accomplishing nothing.
Whether Carney has the political will to build at scale, or if this is just window dressing to deflect criticism while he approves more pipelines, remains to be seen.
In other Carney news, he scrapped the Trudeau-era electric vehicle mandate on February 5th, the policy requiring 100% of new vehicle sales to be electric by 2035, and replaced it with a rebate program and vague emissions standards. Carney paused the mandate back in September for a “60-day review,” spent the fall insisting Canada needed binding targets, then killed it entirely. In its place? A $2.3 billion rebate scheme offering $5,000 for EVs and $2,500 for plug-in hybrids, but only in 2026, declining annually until it expires in 2030. The $50,000 price cap excludes most vehicles Canadians actually want to buy, and the program only covers imports from free-trade countries, meaning the 49,000 Chinese EVs Carney just negotiated access to won’t qualify.
The charging infrastructure spend of $1.5 billion through the Canada Infrastructure Bank sounds impressive until you realize Ottawa has been funding charger buildouts since 2016 and EV adoption is still stuck at 11% of new sales. Government officials admitted they haven’t modeled the emissions impact, which replaces binding 2026 sales targets with “aspirational” goals of 75% EV sales by 2035 and 90% by 2040. Carney claims new tailpipe standards will deliver equivalent reductions, but the details won’t be published until later this year. Bottom line Carney still wants Canadians to drive electric vehicles but realized the original targets were not in line with reality or what people really want. This new scheme is just putting lipstick on a pig, in our opinion.
For the rail sector, this policy chaos matters less for what it does than for what it represents. Carney’s approach to EVs is the same playbook he’s running on energy policy writ large. The mandate’s death won’t meaningfully impact finished vehicle imports by rail; most Canadian-bound autos move by truck or are assembled domestically. But, Carney’s willingness to capitulate to industry lobbying while maintaining retaliatory tariffs on U.S. vehicles creates exactly the kind of policy uncertainty that strangles investment decisions. You can’t plan a supply chain when the government changes direction every quarter.
We are Watching Wabtec
Last week, Wabtec announced nearly $1.8 billion in locomotive agreements with CSX and Union Pacific, a clear sign the big railroads are focused on running leaner, not necessarily bigger.
CSX signed a $670 million agreement that includes 100 new locomotives, upgrades to 50 existing units, and expanded digital systems. A big piece of that is converting older DC locomotives to more efficient AC traction, improving pulling power and fuel burn while extending the life of assets already on the books.
Union Pacific followed with a $1.2 billion modernization program, centered on upgrading its AC4400 fleet with updated propulsion systems and diagnostics to improve reliability and efficiency over time.
This isn’t about expanding fleets, it’s about tightening operations. Class I railroads are improving fuel efficiency, extending asset life, investing in digital performance tools, and strengthening reliability. That suggests a steady-demand environment where protecting margins and maintaining service consistency matter more than rapid growth.
For shippers, especially in bulk and energy markets, better locomotive performance typically translates into more predictable network performance and fewer operational surprises.Even with freight growth remaining moderate, Class I railroads are putting real capital behind efficiency, signaling confidence in long-term demand and a clear commitment to operational performance.
We are watching Key Economic Indicators
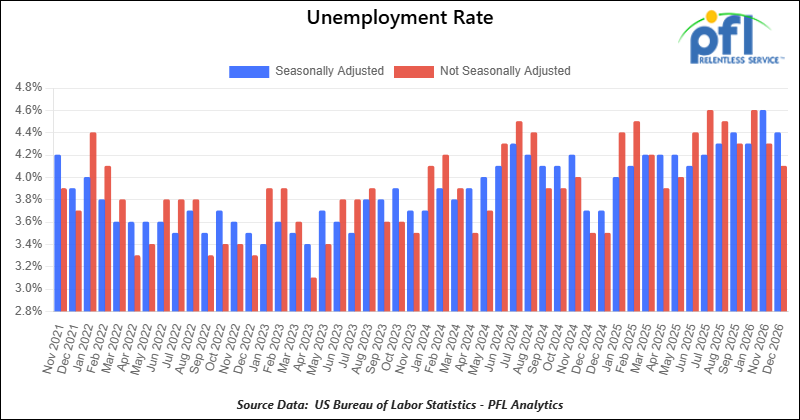
Unemployment Rate
On February 11, 2026, the BLS reported that 130,000 net new jobs were created in January 2026. Job gains were concentrated in health care, social assistance, and construction, while some sectors like federal government and financial activities saw losses.
Figures for prior months were revised sharply lower, with 2025’s net new job gains adjusted down from 584,000 to approximately 181,000, marking one of the weakest years for U.S. job growth in decades.
The official unemployment rate declined slightly to 4.3% in January 2026, down from 4.4% in December 2025.
Lease Bids
- 30-50, 6000cf Steel Hopper located off of CSX or NS in East. For use in petcoke service. Period: 5 Years.
- 10, 2500CF Open Top Hopper located off of UP or BN in Texas. For use in aggregate service. Period: 5 years. Need Rapid Discharge Doors.
- 100, 21.9K 117J Tank located off of All Class 1s in Midwest. For use in CO2 service. Period: 6 months.
- 30-50, 30K 117J Tank located off of NS or CSX in Northeast. For use in C5 service. Period: 1 year.
- 20-50, 4000-5000 Covered Hopper located off of UP or BN in Houston. For use in Urea, Potash, Ammonium Sulfate service. Period: 6-12 Months.
Sales Bids
- 28, 3400CF Hopper Covered located off of UP BN in Texas. For use in Cement service. Cement Gates needed.
- 20, 17K Tank DOT111 located off of various class 1s in various locations. For use in corn syrup service.
- 120, Various Gondola Open-Top Aluminum Rotary located off of various class 1s in various locations. For use in Sulphur service. Built 2004 or later.
- 30, 29K Tank DOT111 located off of various class 1s in Chicago. For use in Veg Oil service.
Lease Offers
- 100, 30K CPC1232 Tanks located off of UP or BN in Texas. Last used in Diesel.
- 100, 30K DOT117J Tanks located off of UP or BN in Texas. Last used in Gasoline.
- 100, 29K DOT117J Tanks located off of UP or BN in Texas. Last used in Gasoline. Coiled and Insulated.
- 21, 6351 Covered Hopper located off of CN in Wisconsin. Last used in DDG. Available until February 2027.
- 29, 6500 Covered Hopper located off of CN in Wisconsin. Last used in DDG. Available until February 2027.
- 50, 20K DOT117J Tank located off of All Class 1s in Moving. Last used in Styrene.
- 29, 25.5K DOT117J Tank located off of UP or BN in Texas. Cars are currently clean. Cars are currently clean.
- 90, 30K DOT117J Tank located off of UP or BN in Corpus Christie. Last used in Diesel.
- 200, 340W DOT 112J Tank located off of All Class 1s in Multiple Locations. Last used in Propane and Butane. Cars are currently clean.
- 15, 6200CF Covered Hopper located off of All Class 1s in Wisconsin. Last used in Plastic. Cars are currently clean.
- 30, 6500CF Covered Hopper located off of All Class 1s in Wisconsin. Last used in Plastic. Cars are currently clean.
Sales Offers
- 50, 31.8K CPC1232 Tanks located off of UP or BN in TX. Last used in Multiple. Requal Due in 2025.
- 100, 4600CF Open Top Hoppers located off of BN or CSX in Southeast. Last used in Coal.
- 35, 3400CF Covered Hoppers located off of UP or BN in Midwest. Last used in Sand.
- 25, 30K 117J Tanks located off of CSX in Jackson, TN. Last used in Fuels. Newly Requalified.
Call PFL today to discuss your needs and our availability and market reach. Whether you are looking to lease cars, lease out cars, buy cars, or sell cars call PFL today at 239-390-2885
Live Railcar Markets
| CAT | Type | Capacity | GRL | QTY | LOC | Class | Prev. Use | Offer | Note |
|---|
PFL will be at the Following Conferences

- Where: La Quinta, CA
- Attending: David Cohen (954-729-4774)
- Conference Website

- Where: Hyatt Regency Dallas in Dallas, TX
- Attending:Curtis Chandler (239.405.3365), David Cohen (954-729-4774), Brian Baker (239.297.4519), Cyndi Popov(403) 402-5043
- Conference Website