“If you aren’t fired with enthusiasm, you will be fired with enthusiasm.”
-Vince Lombardi
Jobs Update
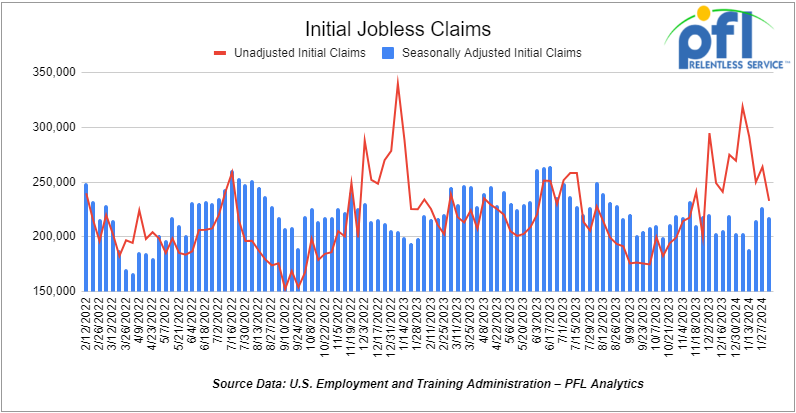
- Initial jobless claims seasonally adjusted for the week ending February 3rd, 2023 came in at 218,000, down -9,000 people week-over-week.
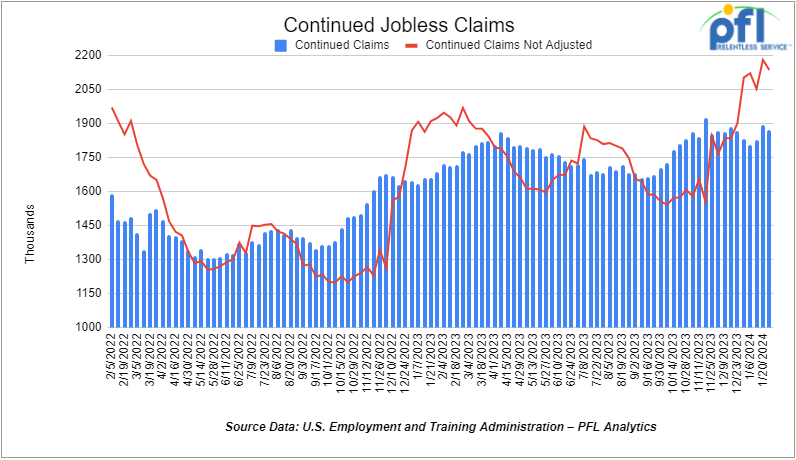
- Continuing jobless claims came in at 1.871 million people, versus the adjusted number of 1.894 million people from the week prior, down 23,000 people week-over-week.
Stocks closed mixed on Friday of last week, but higher week over week
The DOW closed lower on Friday of last week, down -54.64 points (-0.14%), closing out the week at 38,671.69, up 17.27 points week-over-week. The S&P 500 closed higher on Friday of last week, up 28.7 points (+0.57%), and closed out the week at 5,026.61, up 68 points week-over-week. The NASDAQ closed higher on Friday of last week, up 196.95 points (+1.26%), and closed out the week at 15,990.66, up 361.71 points week-over-week.
In overnight trading, DOW futures traded lower and are expected to open at 38,714 this morning down 34 points.
Crude oil closed higher on Friday of last week and higher week over week.
WTI traded up $0.62 per barrel (0.8%) to close at $76.84 per barrel on Friday of last week, up $4.56 per barrel week-over-week. Brent traded up US$0.56 per barrel (0.7%) on Friday of last week, to close at US$82.19 per barrel, up US$4.86 per barrel week-over-week.
One Exchange WCS for March delivery settled on Friday of last week at US$19.30 below the WTI-CMA. The implied value was US$57.42 per barrel. On Thursday of last week, it settled at US$19.55 below the WTI-CMA for March delivery. The implied value was US$56.60 per barrel.
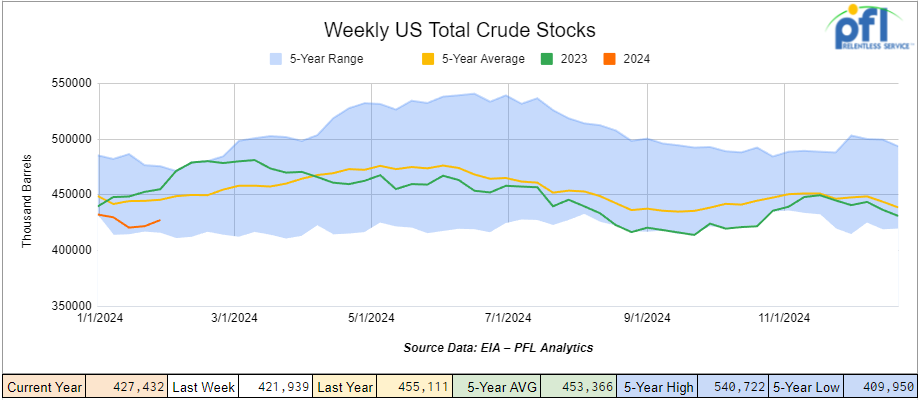
U.S. commercial crude oil inventories (excluding those in the Strategic Petroleum Reserve) increased by 5.5 million barrels week-over-week. At 427.4 million barrels, U.S. crude oil inventories are 4% below the five-year average for this time of year.
Total motor gasoline inventories decreased by 3.1 million barrels week-over-week and are 1% below the five-year average for this time of year.
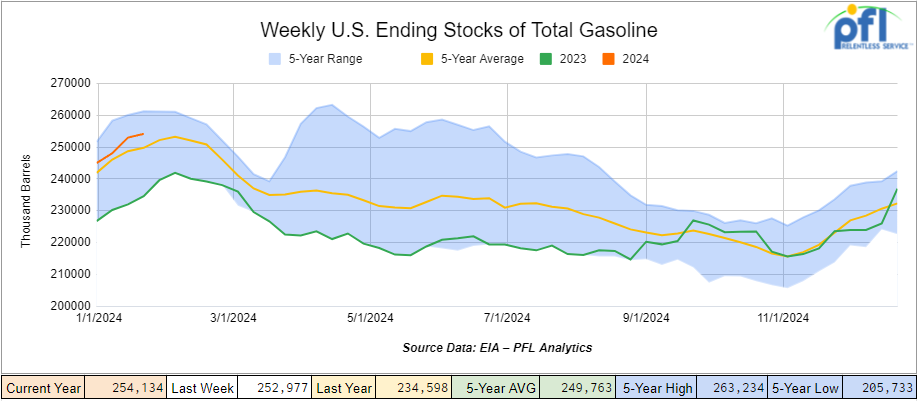
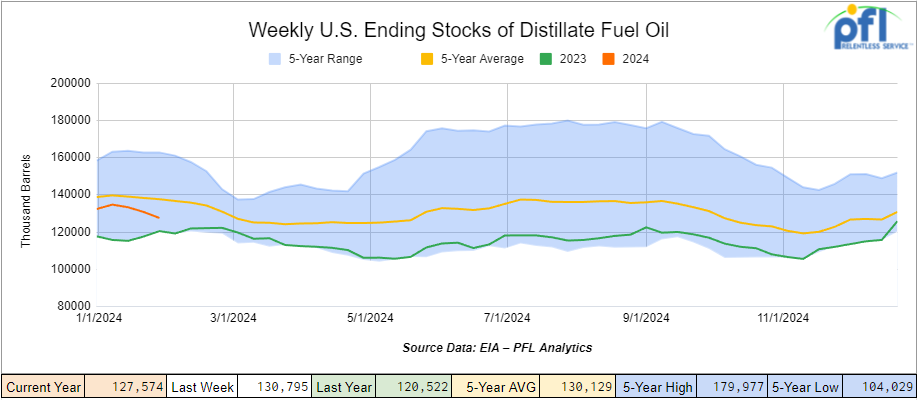
Distillate fuel inventories decreased by 3.2 million barrels week-over-week and are 7% below the five-year average for this time of year.
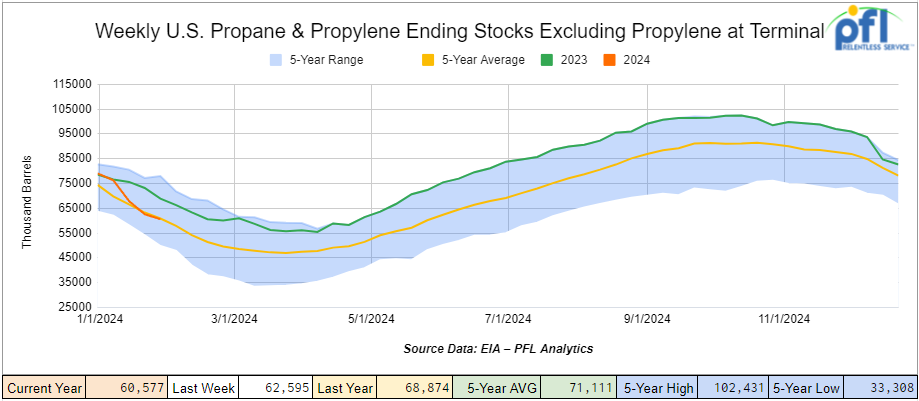
Propane/propylene inventories decreased by 2 million barrels week-over-week and are 2% above the five-year average for this time of year.
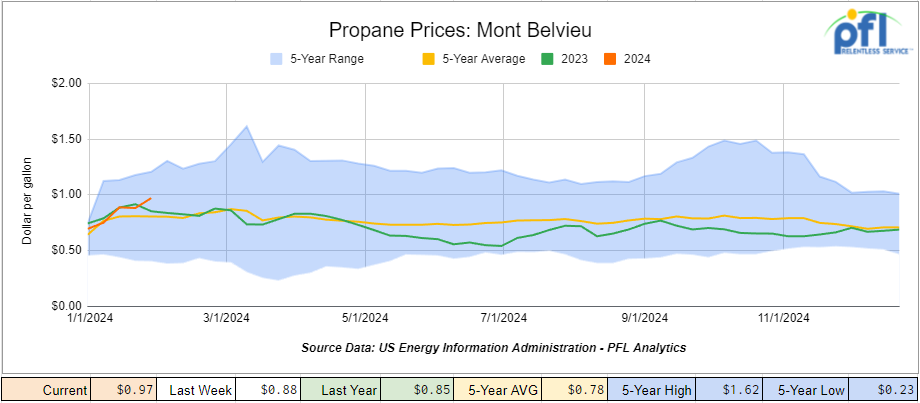
Propane prices closed at 97 cents per gallon, up 9 cents per gallon week-over-week, and up 12 cents year-over-year.
Overall, total commercial petroleum inventories decreased by 4.5 million barrels during the week ending February 2, 2024.
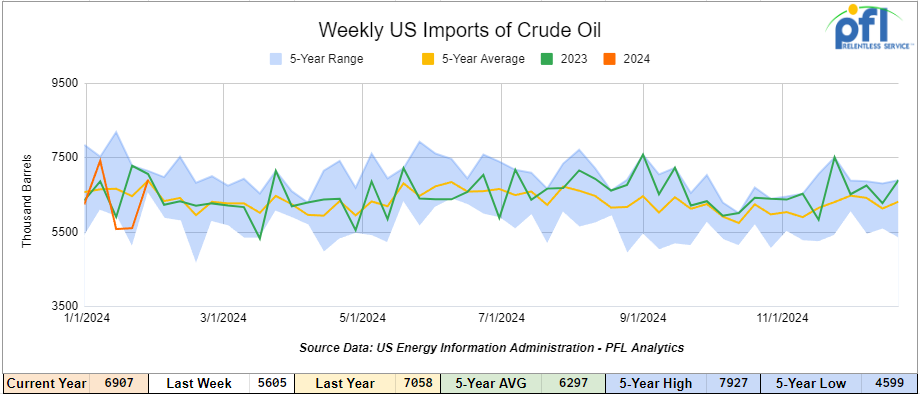
U.S. crude oil imports averaged 6.9 million barrels per day during the week ending January 26, 2024, an increase of 1.3 million barrels per day week-over-week. Over the past four weeks, crude oil imports averaged about 6.4 million barrels per day, 5.9% less than the same four-week period last year. Total motor gasoline imports (including both finished gasoline and gasoline blending components) averaged 536,000 barrels per day, and distillate fuel imports averaged 126,000 barrels per day during the week ending January 26, 2024.
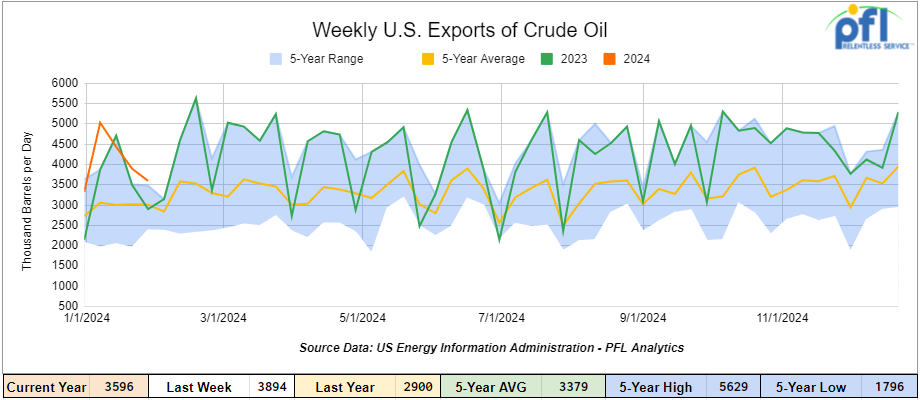
U.S. crude oil exports averaged 3.596 million barrels per day for the week ending February 2nd, 2024, a decrease of 298,000 barrels per day week-over-week. Over the past four weeks, crude oil exports averaged 4.238 million barrels per day.
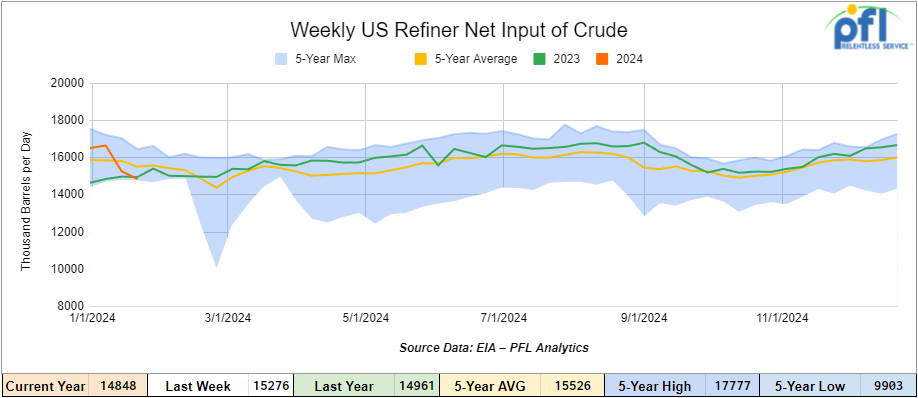
U.S. crude oil refinery inputs averaged 14.8 million barrels per day during the week ending February 2, 2024, which was 9,000 barrels per day less week-over-week.
WTI is poised to open at $76.16, down 68 cents per barrel from Friday’s close.
North American Rail Traffic
Week Ending February 7th, 2024.
Total North American weekly rail volumes were up (10.05%) in week 6, compared with the same week last year. Total carloads for the week ending on February 7th were 348,958, up (6.16%) compared with the same week in 2023, while weekly intermodal volume was 334,761, up (14.42%) compared to the same week in 2023. 10 of the AAR’s 11 major traffic categories posted year-over-year increases with the most significant decrease coming from Grain, down (-2.14%) while the largest increase came from Motor Vehicles and Parts up (19.37%).
In the East, CSX’s total volumes were up (11.42%), with the largest decrease coming from Nonmetallic Minerals, down (-5.71%) while the largest increase came from Motor Vehicles and Parts up (53.68%). NS’s volumes were up (8.66%), with the largest increase coming from Other (+26.85%) while the largest decrease came from Coal (-15.34%).
In the West, BN’s total volumes were up (17.48%), with the largest increase coming from Intermodal (+28.95%) while the largest decrease came from Grain, down (-8.51%). UP’s total rail volumes were up (5.85%) with the largest decrease coming from Nonmetallic Minerals, down (-3.79%) while the largest increase came from Coal up (37.73%).
In Canada, CN’s total rail volumes were up (3.62%) with the largest decrease coming from Other, down (-42.77%) while the largest increase came from Coal, up (+37.01%). CP’s total rail volumes were up (+9.03%) with the largest increase coming from Coal (+98.11%) while the largest decrease came from Other, down (-51.06%).
KCS’s total rail volumes were up (1.46%) with the largest decrease coming from Metallic Ores and Metals (-35.79%) and the largest increase coming from Coal (+59.23%).
Source Data: AAR – PFL Analytics
Rig Count
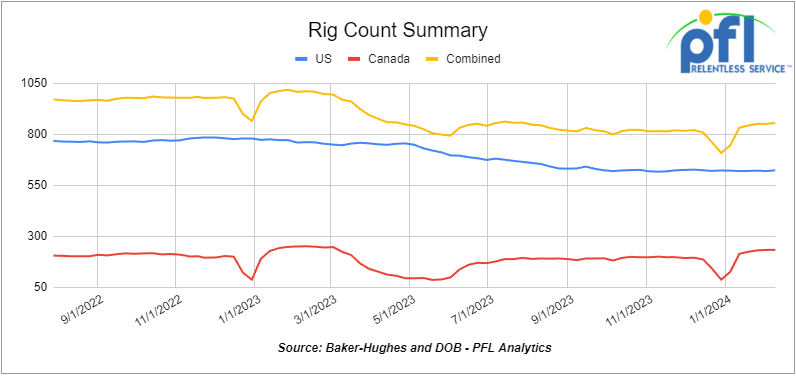
North American rig count was up 4 rigs week-over-week. U.S. rig count was up by 4 rigs week-over-week and down by -138 rigs year-over-year. The U.S. currently has 623 active rigs. Canada’s rig count was up flat week-over-week, but down by -18 rigs year-over-year. Canada’s overall rig count is 232 active rigs. Overall, year-over-year, we are down -156 rigs collectively.
North American Rig Count Summary

A few things we are watching:
We are watching Petroleum Carloads
The four-week rolling average of petroleum carloads carried on the six largest North American railroads rose to 28,930 from 28,216, which was a gain of +714 rail cars week-over-week. Canadian volumes were mixed. CPKC’s shipments rose by +14.3% week over week, CN’s volumes were lower by -1.1% week-over-week. U.S. shipments were mostly higher. The BN had the largest percentage increase and was up by 11.6%. The NS was the sole decliner and was down by 6.5%.
We Continue to Watch Canada’s Trans Mountain Pipeline
According to “The Canadian Press,” the Government of Canada is after the government of Canada again! The company building the Trans Mountain pipeline expansion has been cited for environmental non-compliance related to its management of recent flooding in B.C.
The Canada Energy Regulator (CER) said on Thursday of last week its inspection officers found issues near Abbotsford, B.C., where Trans Mountain Corporation has been working on the final stretch of the multi-year oil pipeline project.
The regulator said the Crown corporation (Government of Canada owns Trans Mountain) was not properly maintaining a watercourse isolation, wildlife fencing, soil coverings and dewatering pump and sump locations following recent heavy rain.
The regulator has ordered Trans Mountain Corp. to address the environmental deficiencies, develop a water management plan and investigate and report on its environmental failings in the area.
We continue to watch shipping lanes and traffic flow on the world’s seas
Despite economic worries and consumer confidence in China which has hit rock bottom, there are more containers flowing from China to U.S. than ever before, which, may come as a surprise to our readers. Clearly American importers are still in need of Chinese goods!
Despite contracting industrial activity out of China, low consumer confidence and a worsening stock market rout, China is currently sending the highest volume of ocean container freight to the United States since May 2022.
Part of the surge in shipments is due to the traditional pre-Chinese New Year surge, when factories on China’s coast move a flurry of goods to port before their workers depart for a long holiday in their hometowns. However, this year’s peak is well above 2023’s anemic Chinese New Year season, and volumes have been mounting all year.
China’s manufacturing Purchasing Managers’ Index contracted in January for the fourth consecutive month. China’s second-largest property developer, Evergrande, is being liquidated, with approximately $300 billion in debts against $245 billion in assets. Chinese stocks have been falling: The CSI 300, an index of the 300 largest stocks on the Shanghai stock exchange, is down – 9% year over year.
Why, if China’s GDP growth fell to 5.3% in 2023, its slowest growth of the 21st century, is the port of Shanghai (for example) shipping more volume than at any time in the past two years? It appears that volume isn’t so much being pushed out of China by a burgeoning manufacturing sector so much as it’s being pulled out of China by U.S. importers who have burned off inventory and are preparing to face higher-than-expected retail sales. In November 2023, the most recent date for which data is available, U.S. inventory-to-sales ratios fell to 1.37 months, well below pre-pandemic baselines. Meanwhile, in December 2023, U.S. retail sales grew 4.8% year over year to $709 billion, outpacing overall year over year GDP growth of 3.3% in the fourth quarter of 2023.
On the other side of the planet, Houthi terrorist attacks against international shipping in the Red Sea have necessitated diverting shipping from the Suez Canal around the Cape of Good Hope, extending transit times and effectively removing containership capacity from the market. Because those strains on steamship line networks are coinciding with higher volumes out of China, eastbound spot rates on the trans-Pacific have ripped upward to more than $4,500 per forty-foot equivalent unit on most lanes out of China to the West Coast.
In the wake of the ongoing conflict in the Red Sea and low water levels in the Panama Canal, global supply chains are facing transit interruptions and vessel rerouting, which is causing extended transit times and putting a strain on global ocean capacity. While the Asia-to-Europe trade lane has been most affected, the impact is extending to other lanes as carriers adjust routes based on shipping demand. As a result, ocean rates have increased sharply in Q1 on several trade lanes, including Asia to Europe and Asia to North America. While the Red Sea disruption continues without any clear timeline of when it will be resolved, the strain on capacity and the elevated spot rates are expected to continue through at least the Chinese New Year.”
We are Watching Some Key Economic Indicators
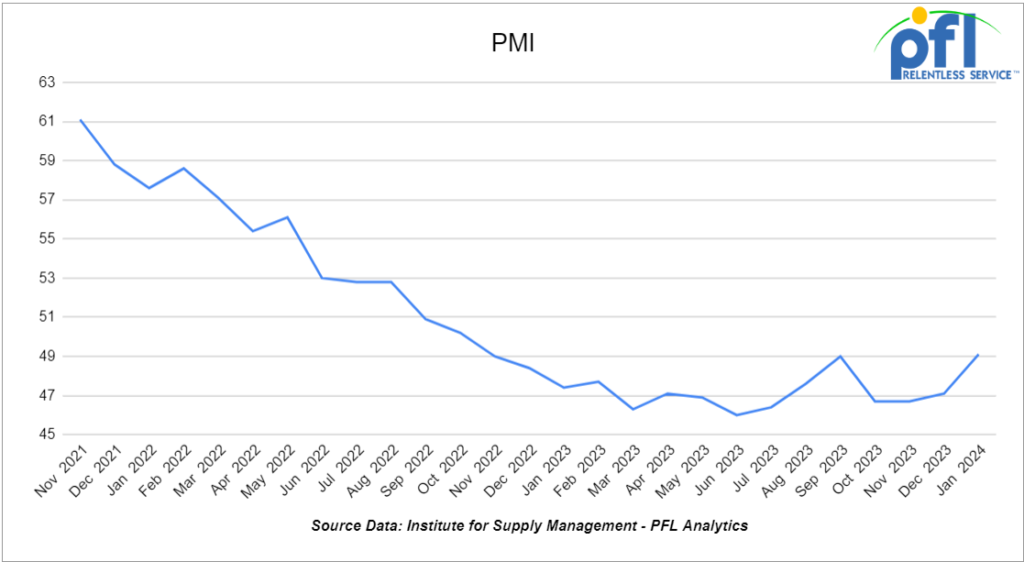
Purchasing Managers Index (PMI)
The Institute for Supply Management releases two PMI reports – one covering manufacturing and the other covering services. These reports are based on surveys of supply managers across the country and track changes in business activity. A reading above 50% on the index indicates expansion, while a reading below 50% signifies contraction, with a faster pace of change the farther the reading is from 50. The overall Manufacturing PMI was 49.1% in January, up from 47.1% in December. The index has been relatively flat throughout 2023, with December marking the 15th straight month of contraction in a row. The new orders subindex in January was 52.5%, up from 47.1% in December.
The Services PMI, which measures the service industry the same way the Manufacturing PMI gauges manufacturing, rose from 50.5% in December to 53.4% in January. The supplier deliveries index (which is inversed, with slower deliveries indicated by a reading above 50) was 52.4% in January, an increase from 49.5% in December.
Industrial Output & Capacity Utilization
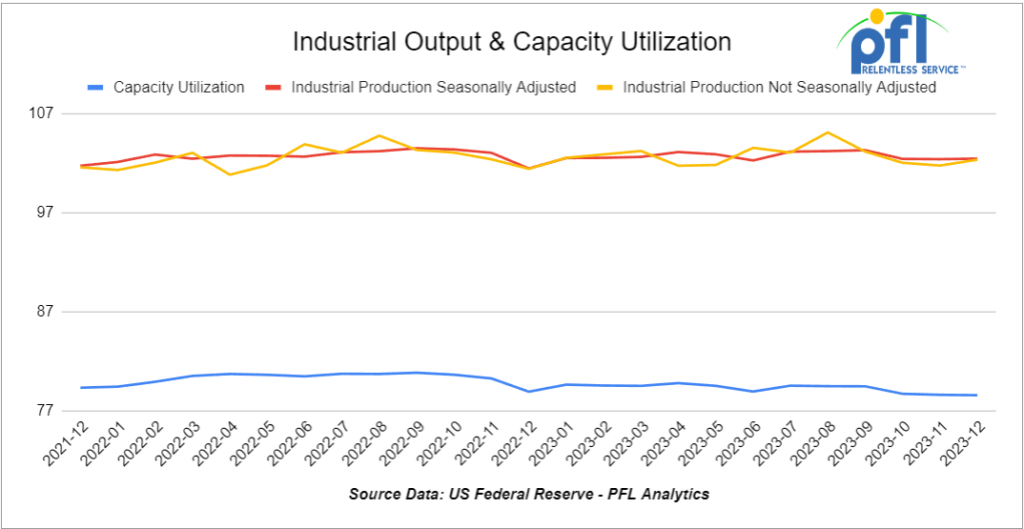
According to preliminary and seasonally adjusted Federal Reserve data released January 17, total U.S. industrial output was up 0.1% in December 2023 over November 2023 and was 1.0% higher in December 2023 than in December 2022.
Although a small number, it is the largest year-over-year increase for total industrial output in nearly a year. Total output has been more or less flat for the past 20 months, a trend that’s constrained rail traffic over that period.
Manufacturing output was also up 0.1% in December, while year-over-year growth was 1.2% — the first year-over-year increase for manufacturing output in 10 months. Along with the PMI, the stagnation in manufacturing output shows how aspects of the goods-related economy continue to be under pressure, to the detriment of rail traffic volumes.
Overall capacity utilization was a preliminary 78.6% in December, the same as the revised figure for November. Capacity utilization for manufacturing was 77.1% in December, also matching November.
U.S Unemployment
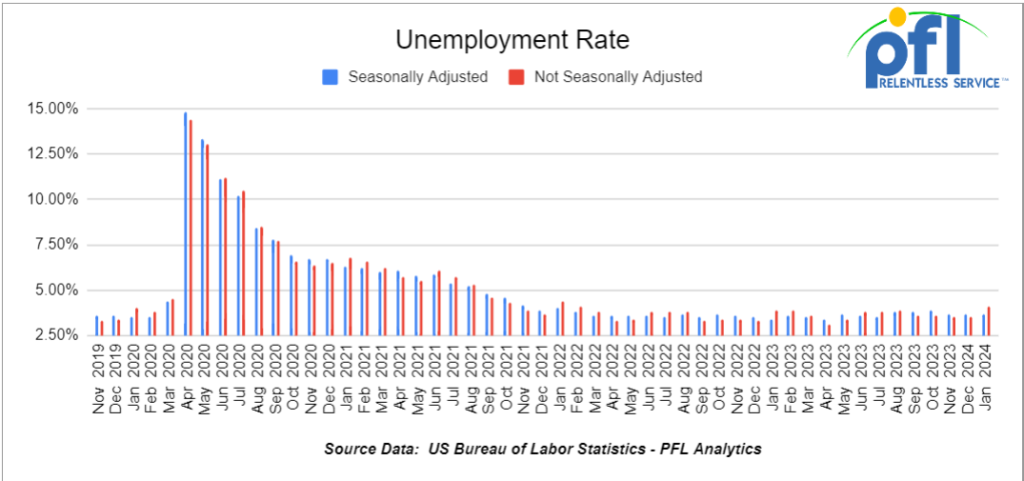
According to the Bureau of Labor Statistics (BLS), a preliminary 353,000 net new jobs were created in January 2024, better than what most economists expected. Job gains for December were revised from 216,000 to 333,000.
The official unemployment rate was 3.7% in January, the same as in December and November.
Consumer Confidence
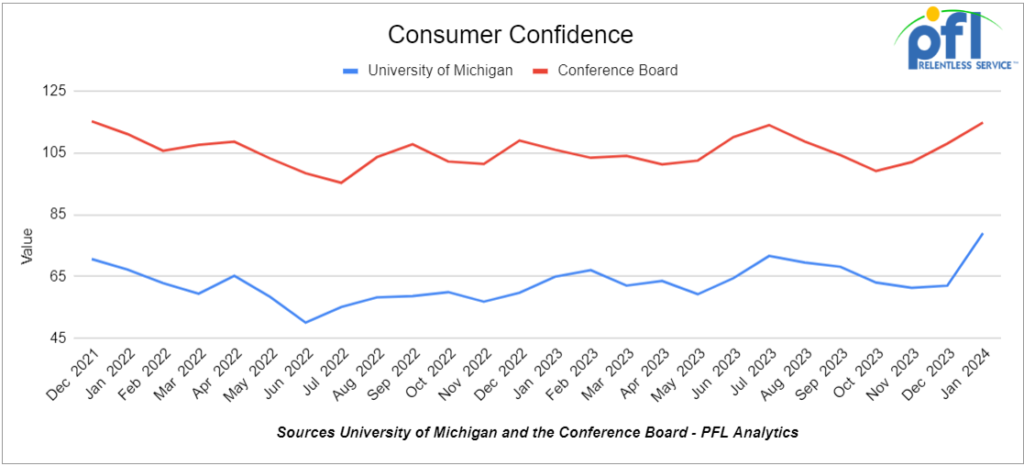
The Conference Board’s Index of Consumer Confidence rose to 114.8 in January from 110.7 in December. The highest it’s been since December 2021 and the third month over month increase.
The index of consumer sentiment from the University of Michigan also rose — from 69.7 in December to 79.0 in January, the highest month over month gain on record.
Consumer Spending
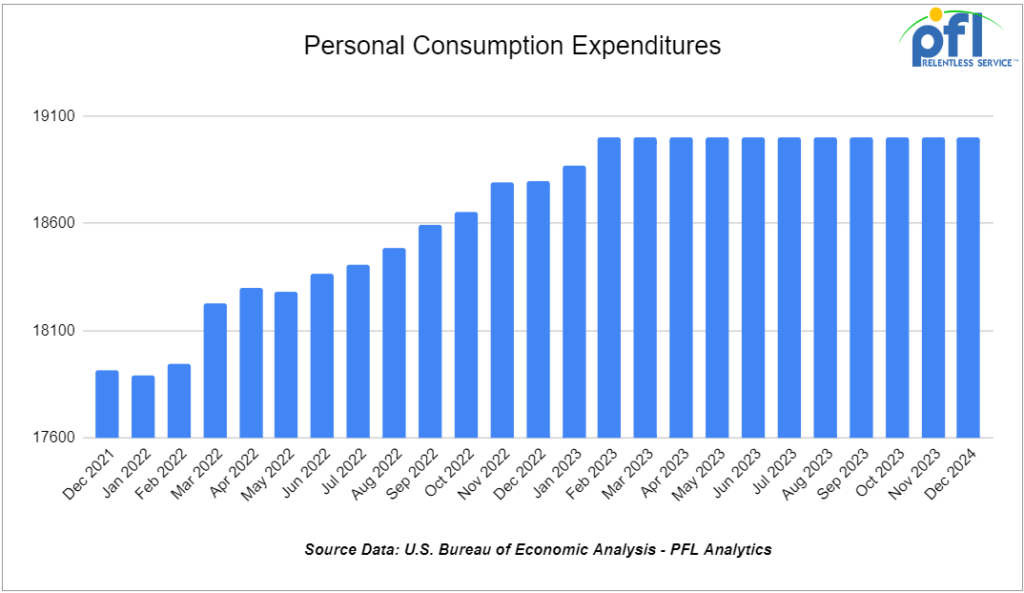
In December 2023, total consumer spending not adjusted for inflation rose a preliminary 0.7% from November, following a 0.4% increase in November from October. Adjusted for inflation, total spending rose 0.5% in December, the same as November. Total spending, adjusted for inflation, was up 3.2% in December year-over-year, its highest gain since February 2022. Spending on services rose a preliminary 0.6% in December and spending on goods rose a preliminary 0.9% — its largest increase since January 2023.
We have been extremely busy at PFL with return-on-lease programs involving rail car storage instead of returning cars to a shop. A quick turnaround is what we all want and need. Railcar storage in general has been extremely active. Please call PFL now at 239-390-2885 if you are looking for rail car storage, want to troubleshoot a return on lease scenario, or have storage availability. Whether you are a car owner, lessor or lessee, or even a class 1 that wants to help out a customer we are here to “help you help your customer!”
Leasing and Subleasing has been brisk as economic activity picks up. Inquiries have continued to be brisk and strong Call PFL Today for all your rail car needs at 239-390-2885
Lease Bids
- 50-100, 4750CF Open/Covered Hoppers needed off of BN in Washington for Feb-Jun. Cars are needed for use in Petcoke service.
- 80, 30K 117R or 117J Tanks needed off of UP in Nebraska for 12 Months. Cars are needed for use in Ethanol service.
- 100, 30K Dot 111 or CPC 1232 Tanks needed off of UP or BN in New Orleans/Passadena for 6-12 Months. Cars are needed for use in Gasoline/Diesel service.
- 80, 29k 117R or 117J Tanks needed off of Any Class 1 in Kentucky for 1-5 Years. Cars are needed for use in Crude service.
- 50, 19k DOT111 Tanks needed off of UP or BN in Nevada or CA for 1 year. Cars are needed for use in Sulfuric Acid service. March or April
- 8, 28-30K Any Tanks needed off of UP BN in Texas and Gulf for 5 years. Cars are needed for use in Chlorobenzene service. Need Magrods
- 14, 23.5K DOT111 Tanks needed off of UP in Morrilton, AR for 1 year. Cars are needed for use in Turpentine service.
- 10, 30k any Tanks needed off of UP BN in Texas for 1 year plus. Cars are needed for use in Fuel Oil service.
- 25-50, 5000CF-5100CF Covered Hoppers needed off of BNSF, CSX, KCS, UP in Gulf LA for 3-10 years. Cars are needed for use in Dry sugar service. 3 bay gravity dump, Hempel 37700
- 30-40, 28.3K DOT117R, DOT117J, DOT111 Tanks needed off of UP in Iowa for 2-3 years. Cars are needed for use in Feedstocks service.
- 25, 3230 PD Hoppers needed off of NS or CSX in Ohio for 5 years. Cars are needed for use in Flyash service.
- 50, 23.5-25.5 DOT111 Tank s needed off of Any Class 1 in USA for 5 years. Cars are needed for use in Asphalt service.
- 25, 30K Any Tanks needed off of in Houston for December -June. Cars are needed for use in Diesel service.
- 75, 30K Any Tanks needed off of Any Class 1 in Chicago for December 23-May 24. Cars are needed for use in Gasoline service.
- 10, 2500CF Open Top Hoppers needed off of UP or BN in Texas for 5 years. Cars are needed for use in aggregate service. Need Rapid Discharge Doors
- 108, 28.3K Any Tanks needed off of CN in Canada for 1-3 years. Cars are needed for use in Crude service.
- 20-25, 30K DOT117 Tanks needed off of UP or BN in Illinois for 5 years. Cars are needed for use in Ethanol service.
- 100, 28.3K Any Tanks needed off of UP or BN in Midwest/Texas for 5 years. Cars are needed for use in Veg Oils / Biodiesel service. Need to be Unlined
- 50-100, 4550 Covered Hoppers needed off of UP or BN in Texas for 5 years. Cars are needed for use in Grain service.
- 10, 33K 340W Pressure Tanks needed off of CN in LA for 1 year. Cars are needed for use in Butane service.
- 25, 20.5K CPC1232 or DOT117J Tanks needed off of BNSF or UP in the west for 3-5 years. Cars are needed for use in Magnesium chloride service. SDS onhand
- 25-50, 25.5K DOT117J Tanks needed off of NS CSX in Northeast for 5 years. Cars are needed for use in Asphalt / Heavy Fuel Oil service.
- 15, 28.3K DOT117J Tanks needed off of any class 1 in any location for 3 years. Cars are needed for use in Glycerin & Palm Oil service.
- 30, 17K-20K DOT117J Tanks needed off of UP or BN in Midwest/West Coast for 3-5 years. Cars are needed for use in Caustic service.
- 150, 23.5K DOT111 Tanks needed off of any class 1 in LA for 2-3 years. Cars are needed for use in Fluid service. Needed July
- 10, 5200cf PD Hoppers needed off of UP in Colorado for 1-3 years. Cars are needed for use in Silica service. Call for details
- 10, 30K 117R or 117J Tanks needed off of Any Class 1 in USA for 1 year. Cars are needed for use in Glycerin service.
Sales Bids
- 10, 2770 Mill Gondolas needed off of any class 1 in St. Louis. Cars are needed for use in Cement service.
- 20, 2770-3400 Mill Gondolas needed off of any class 1 in South Texas. Cars are needed for use in scrap metal service.
- 20, 2770 Mill Gondolas needed off of CSX in the northeast. Cars are needed for use in non-haz soil service. 52-60 ft
- 100-150, 3400CF Covered Hoppers needed off of UP BN in Texas. Cars are needed for use in Sand service.
- 8, 5200 Covered Hoppers needed off of various class 1s in various locations. Cars are needed for use in Plastic Pellet service.
- 20-30, 3000 – 3300 PDs Hoppers needed off of BN or UP preferred in West. Cars are needed for use in Cement service. C612
- 10, 4000 Open Hoppers needed off of CSX in the northeast. Cars are needed for use in scrap metal service. Open top hopper
- 10, 6400 Open Hoppers needed off of CSX in the northeast. Cars are needed for use in wood chip service. Open top hopper, flat bottom
- 45, 3000 cf PD Hoppers needed off of any class 1 in Texas. Negotiable
- 200+, 5000cf Covered Hoppers needed off of any class 1 in various locations.
- 5, 3400CF Closed Hoppers needed off of any class 1 in Ohio. Cars are needed for use in Sand service.
- 20, 17K DOT111 Tanks needed off of various class 1s in various locations. Cars are needed for use in corn syrup service.
- 100, 15.7K DOT111 Tanks needed off of CSX or NS in the east. Cars are needed for use in Molten Sulfur service.
- 30, 17K-20K DOT111 Tanks needed off of UP or BN in Texas. Cars are needed for use in UAN service.
- 2-4, 28K DOT111 Tanks needed off of BNSF Preferred in Minnesota. Cars are needed for use in Biodiesel service. Coiled and insulated
- 20-30, Open Top Hoppers needed off in the Northeast. Cars are needed for use in Aggregate service. Gravity dump
Lease Offers
- 15, Plate E and F Boxs located off of NS in New Orleans. Cars are clean Double Sliding Doors
- 38, 4750 plus, 3-4 Hatch Gravity Covered Hopperss located off of CSX CN CP in Florida. Sub-lease 12-18 months
- 10, 28.3K, DOT117R Tanks located off of All Class Ones in St Louis. Cars are clean Call 239-390-2885 for more information
- 10, 21.9K, Tanks located off of UP in Longview, TX. Cars are clean CO2 Cars. Brand New. 2-5 Year Lease
- 125, 28.3K, 117J Tanks located off of Various Class 1s in Multiple locations. Cars are clean Long Term Lease, 5 Years +
- 80, 25.5K, 117J Tanks located off of UP in Texas. Cars are clean Long-term Lease.
Sales Offers
- 20, Refer, Box Boxcars located off of UP in ID.
- 140, 60ft, Boxcars located off of various class 1s in multiple locations.
- 300-500, 3250s, Covered Hoppers located off of various class 1s in multiple locations.
- 100-300, 3400, Covered Hoppers located off of various class 1s in multiple locations.
- 100, 28.3K, DOT117J Tanks located off of various class 1s in multiple locations.
- 100, 17K, DOT111 Tanks located off of various class 1s in multiple locations.
- 100, 19K, DOT111 Tanks located off of various class 1s in multiple locations.
- 120, 31.8K, CPC1232 Tanks located off of various class 1s in multiple locations.
- 150, 29.2K, DOT117R Tanks located off of various class 1s in multiple locations.
Call PFL today to discuss your needs and our availability and market reach. Whether you are looking to lease cars, lease out cars, buy cars, or sell cars call PFL today at 239-390-2885
PFL offers turn-key solutions to maximize your profitability. Our goal is to provide a win/win scenario for all and we can handle virtually all of your railcar needs. Whether it’s loaded storage, empty storage, subleasing or leasing excess cars, filling orders for cars wanted, mobile railcar cleaning, blasting, mobile railcar repair, or scrapping at strategic partner sites, PFL will do its best to assist you. PFL also assists fleets and lessors with leases and sales and offers Total Fleet Evaluation Services. We will analyze your current leases, storage, and company objectives to draw up a plan of action. We will save Lessor and Lessee the headache and aggravation of navigating through this rapidly changing landscape.
PFL IS READY TO CLEAN CARS TODAY ON A MOBILE BASIS WE ARE CURRENTLY IN EAST TEXAS
Live Railcar Markets
| CAT | Type | Capacity | GRL | QTY | LOC | Class | Prev. Use | Clean | Offer | Note |
|---|
