
“Nothing can stop the man with the right mental attitude from achieving his goal; nothing on earth can help the man with the wrong mental attitude.” – Thomas Jefferson
Jobs Update
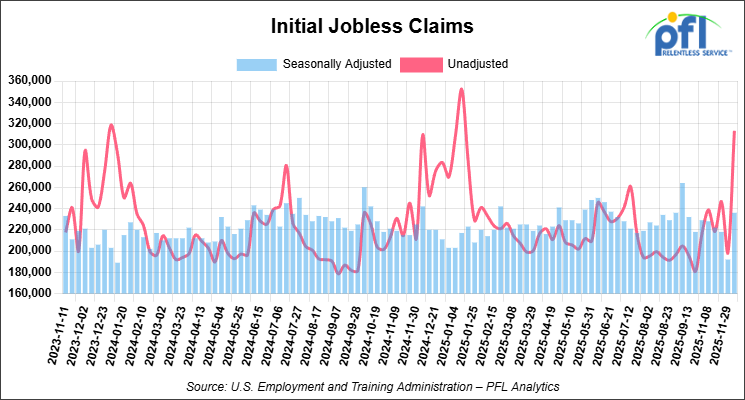
- Initial jobless claims seasonally adjusted for the week ending December 6, 2025 came in at 236,000, versus the adjusted number of 192,000 people from the week prior, up 44,000 people week over week.
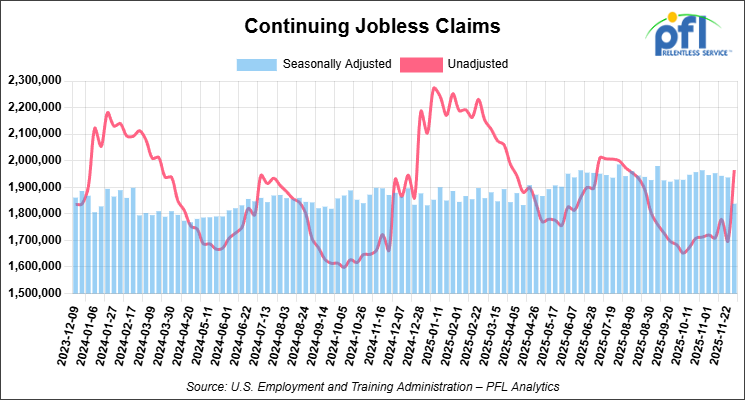
- Continuing jobless claims came in at 1,838,000, versus the adjusted number of 1,937,000 people from the week prior, down 99,000 week-over-week.
Stocks closed lower on Friday of last week and mixed week-over-week
The DOW closed lower on Friday of last week, down -245.96 points (-0.51%), closing out the week at 48,458.05, up 503.06 points week-over-week. The S&P 500 closed lower on Friday of last week, down -73.59 points (-1.07%), and closed out the week at 6,827.41, down -42.99 points week-over-week. The NASDAQ closed lower on Friday of last week, down -398.69 points (-1.69%), and closed out the week at 23,195.17, down -382.96 points week-over-week.
In overnight trading, DOW futures traded higher and are expected to open at 25,353.75 this morning, up 140.25 points from Friday’s close.
Crude oil closed lower on Friday of last week and lower week-over-week
West Texas Intermediate (WTI) crude closed down -0.16 per barrel (-0.28%), to close at $57.44 on Friday of last week, down $2.64 week-over-week. Brent crude closed down -0.16 per barrel, to close at $61.12, down $2.63 week-over-week.
One Exchange WCS (Western Canadian Select) for January delivery settled on Friday of last week at US$13.30 below the WTI-CMA (West Texas Intermediate – Calendar Month Average). The implied value was US$44.12 per barrel.
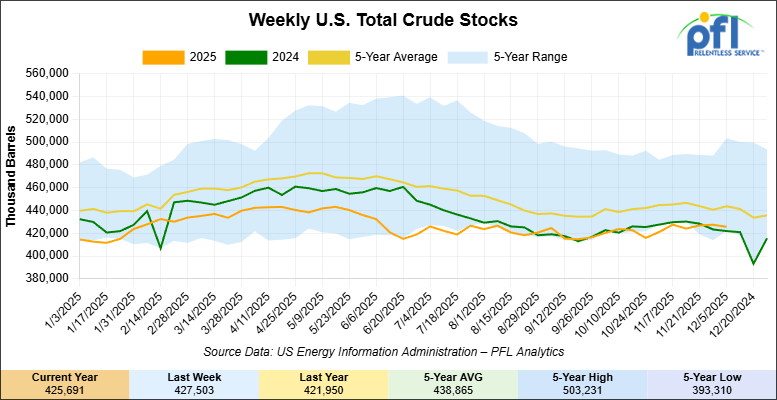
U.S. commercial crude oil inventories (excluding those in the Strategic Petroleum Reserve) decreased by 1.8 million barrels week-over-week. At 425.7 million barrels, U.S. crude oil inventories are 4% below the five-year average for this time of year.
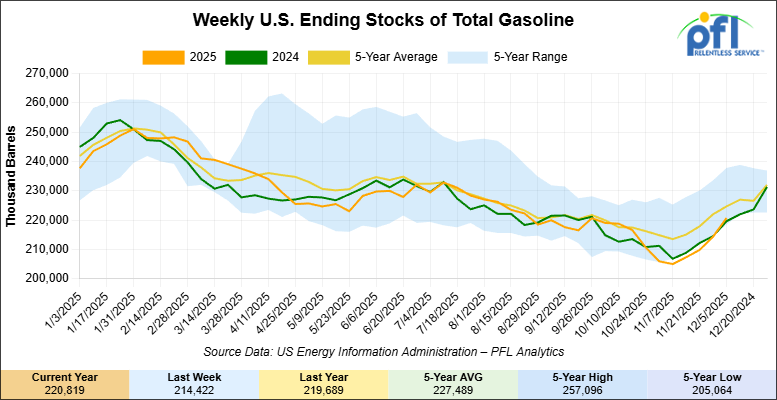
Total motor gasoline inventories increased by 6.4 million barrels week-over-week and are 1% below the five-year average for this time of year.
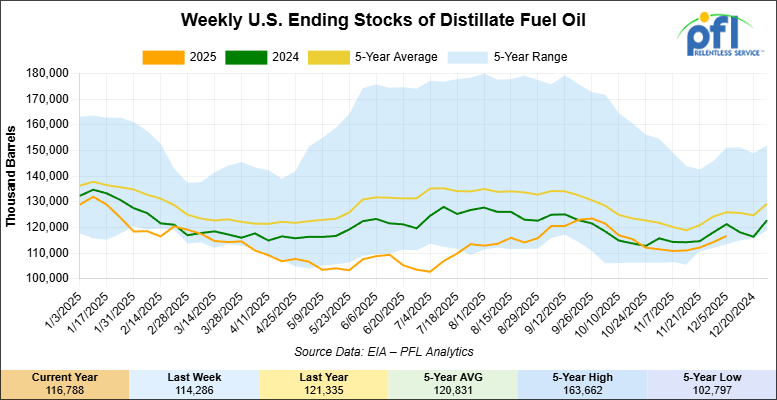
Distillate fuel inventories increased by 2.5 million barrels week-over-week and are 7% below the five-year average for this time of year.
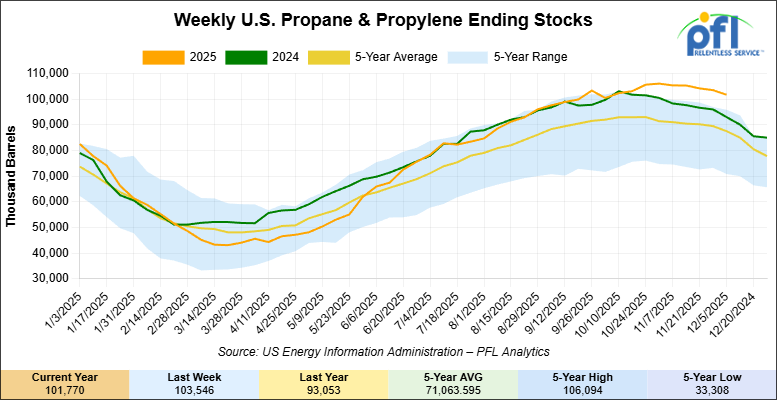
Propane/propylene inventories decreased 1.8 million barrels week-over-week and are 15% above the five-year average for this time of year.
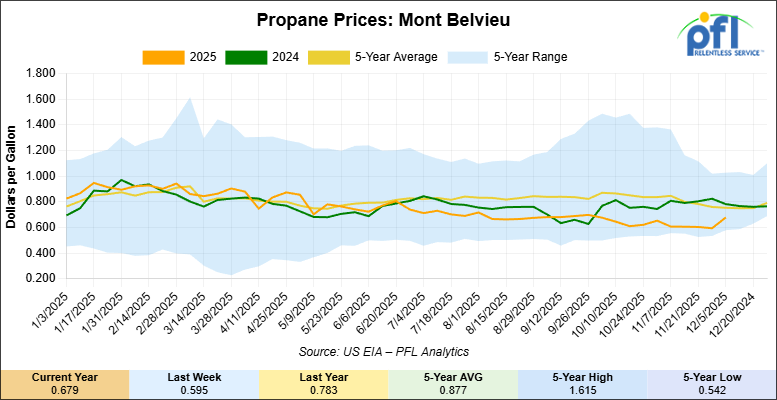
Propane prices closed at 67.9 cents per gallon on Friday of last week, up 8.4 cents per gallon week-over-week, but down 10.4 cents year-over-year.
Overall, total commercial petroleum inventories decreased by 3.2 million barrels week-over-week during the week ending December 5, 2025.
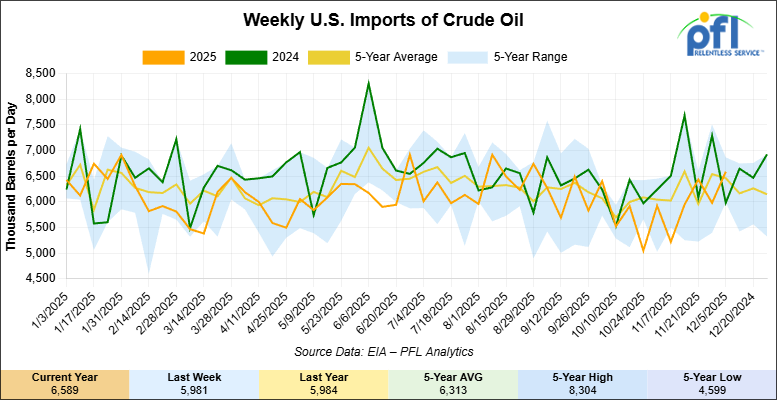
U.S. crude oil imports averaged 6.6 million barrels per day during the week ending December 5, 2025, an increase of 609,000 barrels per day week-over-week. Over the past four weeks, crude oil imports averaged 6.2 million barrels per day, 7.7% less than the same four-week period last year. Total motor gasoline imports (including both finished gasoline and gasoline blending components) averaged 659,000 barrels per day, and distillate fuel imports averaged 181,000 barrels per day during the week ending December 5, 2025.
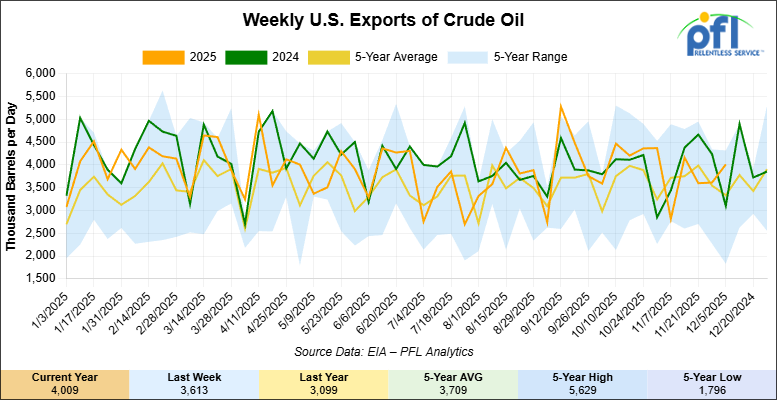
U.S. crude oil exports averaged 4.009 million barrels per day during the week ending December 5, 2025, an increase of 396,000 barrels per day week-over-week. Over the past four weeks, crude oil exports averaged 3.845 million barrels per day.
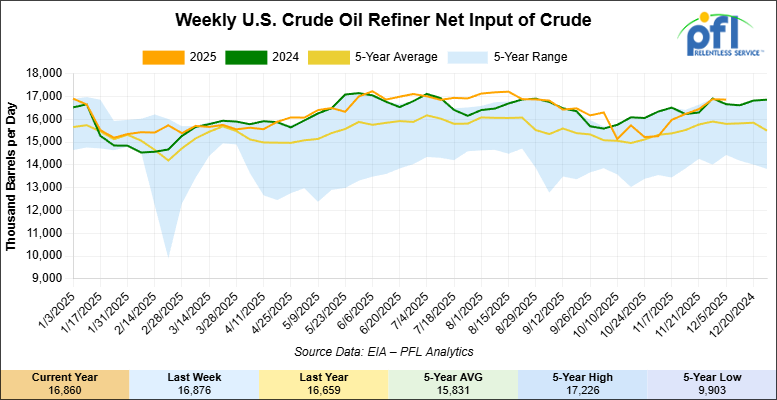
U.S. crude oil refinery inputs averaged 16.9 million barrels per day during the week ending December 5, 2025, which was 17,000 barrels per day less week-over-week.
WTI futures are poised to open at $57.16, down -28 cents from Friday’s close.
North American Rail Traffic
Week Ending December 10, 2025:
Total North American weekly rail volumes were down (-3.87%) in week 50, compared with the same week last year. Total Carloads for the week ending December 10, 2025 were 322,711, up (+0.29%) compared with the same week in 2024, while weekly Intermodal volume was 332,372, down (-7.60%) year over year. 5 of the AAR’s 11 major traffic categories posted year-over-year decreases. The largest decrease came from Forest Products (-18.44%), while the largest increase was Coal (+19.80%).
In the East, CSX’s total volumes were up (+1.13%), with the largest decrease coming from Metallic Ores and Metals (-15.10%), while the largest increase came from Coal (+17.40%). NS’s total volumes were down (-2.84%), with the largest increase coming from Petroleum & Petroleum Products (+24.87%), while the largest decrease came from Grain (-16.42%).
In the West, BNSF’s total volumes were down (-5.07%), with the largest increase coming from Coal (+44.18%), while the largest decrease came from Chemicals (-14.04%). UP’s total volumes were down (-3.98%), with the largest increase coming from Other (+23.87%), while the largest decrease came from Intermodal Units (-11.48%).
In Canada, CN’s total volumes were down (-1.20%), with the largest increase coming from Other (+47.20%), while the largest decrease came from Metallic Ores and Metals (-17.11%). CPKCS’s total volumes were down (-21.85%), with the largest increase coming from Coal (+51.83%), while the largest decrease came from Forest Products (-64.79%).
Source Data: AAR – PFL Analytics
North American Rig Count Summary
Rig Count
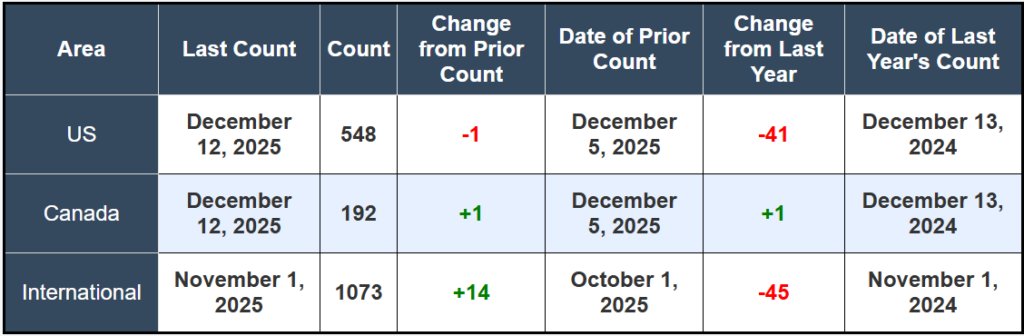
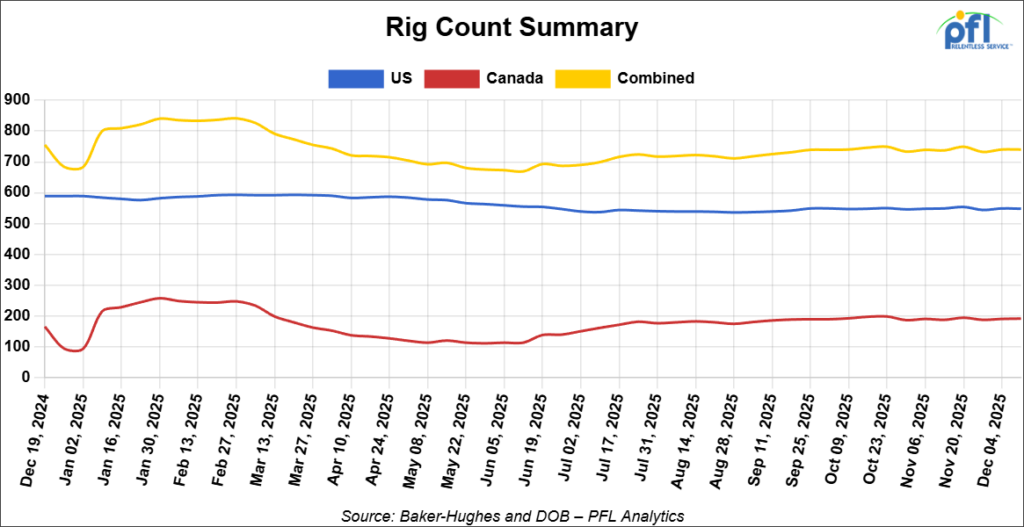
North American rig count was unchanged week-over-week. The U.S. rig count was down by -1 rig week-over-week, and down by -41 rigs year-over-year. The US currently has 548 active rigs. Canada’s rig count was up by +1 rig week-over-week and up by +1 rig year-over-year. Canada currently has 192 active rigs. Overall, year-over-year we are down by -40 rigs collectively.
We are watching a few things out there for you:
PFL Attend WCRTC’s Ugly Sweater Networking Event in Calgary
PFL had the opportunity to attend the Western Canadian Rail & Transportation Club’s (WCRTC) annual Ugly Sweater networking event held on Thursday of last week at The Rooftop in Calgary, Alberta, Canada. The event brought together rail and transportation professionals from across Canada and some increased presence from the U.S, in a relaxed, end-of-year setting that encouraged conversation, relationship-building, and seasonal fun.
Cyndi Popov from PFL’s Calgary office was in attendance, connecting with industry peers, long-standing partners, and new contacts alike. Often referred to as Canada’s version of the Traffic Club of Chicago, WCRTC continues to provide a valuable forum for collaboration across the rail and transportation community.
Conversations reflected familiar themes across the rail market, with fleet balance and equipment readiness top of mind. Many noted the challenge of staying positioned for opportunity without carrying excess capacity, particularly as conditions remain uneven across regions.
PFL appreciated the opportunity to participate and connect with peers in the industry and would like to thank WCRTC for hosting another well-organized and well-attended event to close out the year.
We are watching Petroleum Carloads
The four-week rolling average of petroleum carloads carried on the six largest North American railroads rose to 30,067 from 30,062, which was an increase of +5 rail cars week-over-week. Canadian volumes were mixed. CPKC’s shipments were higher by +8.0% week-over-week, CN’s volumes were lower by -4..0% week-over-week. U.S. shipments were higher across the board. The BNSF had the largest percentage increase and was up by +21.0%.
We are watching Crude-By-Rail Economics
WCS differentials continued to trend lower, closing out the week at $13.30 under WTI, maintaining the kind of spread that keeps the Hardisty DRU-bit rail corridor economically viable for committed shippers. That level is significant because it suggests the pressure on Canadian crude egress is not temporary. Enbridge remains constrained, and incremental production growth continues to test available takeaway capacity, keeping the spread wide enough to justify DRUbit movement by rail rather than pushing all barrels back into pipeline queues.
Gibsons recently announced the expansion of the Hardisty DRU at the Strathcona-owned rail terminal by 50,000 barrels per day. The capex commitment suggests management believes these spreads are durable. For the tank car market, that translates into steadier baseline demand for equipment serving this specific corridor and product type, as opposed to the boom-and-bust pattern that crude-by-rail has historically experienced. In addition, Strathcona intends to add additional production in Saskatchewan.
We are Watching NGL’s and Refined Products
Beyond crude, the quieter, but more consistent story is the ongoing movement of refined products, natural gas liquids, and renewable fuels that continue to underpin tank car utilization across North America. U.S. propane exports have climbed steadily over the past five years, reaching an average of roughly 1.83 million barrels per day through November 2025, up more than 8% from 2024 levels and nearly 50% higher than 2020:
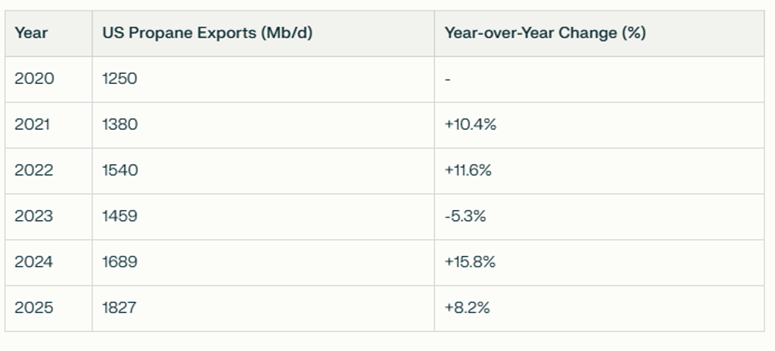
Source Data: EIA – PFL Analytics
That export growth matters for railcar demand because it drives steady logistics pressure on the system. Export terminals along the Gulf Coast are operating at or near capacity, with Enterprise’s Houston facility posting record volumes in the third quarter and Energy Transfer’s Nederland terminal hitting an all-time high in November 2025. International demand—particularly from Asian petrochemical markets seeking feedstock for propane dehydrogenation units—continues to absorb growing U.S. supply, and much of that volume requires coordinated inland logistics that includes rail for positioning, staging, and backhaul movements:
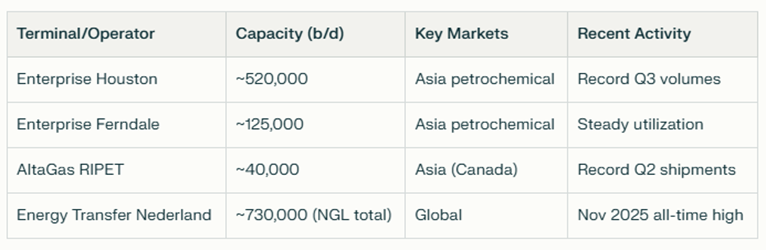
Source Data: EIA – PFL Analytics
Renewable diesel and advanced biofuel movements are becoming increasingly visible in the rail data as mandates and supply-chain dynamics push more of these products into interregional distribution networks. West Coast renewable diesel consumption has roughly doubled since early 2023, and the EIA now tracks interregional renewable diesel rail shipments as a standalone data series, reflecting the growing importance of these flows.
For the railcar fleet, this diversification translates into a more durable call on tank capacity that does not depend entirely on crude or conventional refined products. Specialized tank cars for NGL service and renewable fuels are running tight, and lease rates for these applications are holding firm or even ticking up as demand grows and supply remains constrained. Ethanol continues to provide a mature, stable baseline of rail movements, while renewable diesel represents the fastest-growing segment with strong momentum driven by West Coast low-carbon fuel standards and federal renewable fuel mandates.
It is a background story that does not generate headlines or move crude-by-rail volume charts, but it quietly underpins the strength in overall tank car utilization and lease rate momentum across the market. The combination of export-driven propane logistics, growing renewable fuel distribution, and steady conventional refined product flows creates a diversified demand base that supports current fleet utilization levels and validates the tight leasing fundamentals that have characterized the market all year.
We are Watching Canadian Oil Producers
Last week brought fresh capital and production guidance from Canada’s two largest integrated producers, and both are signaling durability in upstream investment heading into 2026. Cenovus Energy announced 2026 capital spending of C$5.0bn–C$5.3bn, with C$850mn earmarked specifically for an expansion at Christina Lake North, the MEG Energy asset it acquired in November. The company expects total upstream output to reach 945,000–985,000 barrels of oil equivalent per day in 2026, with roughly 80% coming from the oil sands. More notably, Cenovus has laid out a path to the “million boe/d club”—a threshold currently occupied only by Canadian Natural Resources—through in-flight projects including Narrows Lake, Foster Creek optimization, Sunrise optimization, and West White Rose, which is forecast to start first oil in the second quarter of 2026.
Suncor, meanwhile, is holding upstream production essentially flat at 840,000–870,000 b/d in 2026 but is rebalancing the product mix toward synthetic crude, which it plans to increase by nearly 4% to 530,000–540,000 b/d while cutting non-upgraded heavy output by roughly 5%. That mix shift matters for logistics: synthetic crude prices trade at a premium to WCS and typically commands different routing and final-destination preferences than heavy sour barrels. Both companies are planning major turnarounds at key facilities in 2026, which will create seasonal production volatility and test the flexibility of the broader egress system.
For railcar markets, these growth paths do not immediately signal a crude-by-rail surge. Pipeline capacity from TMX and Enbridge’s Mainline has steadily eroded the economic case for rail on core long-haul routes. However, the scale of production growth—particularly Cenovus’s move toward the million boe/d mark—means that incremental barrels will eventually stress pipeline availability and push producers back toward rail as a supplemental outlet during maintenance cycles, apportionment periods or when price differentials between Western Canadian Select and more distant markets justify the per-barrel transport cost. In that world, tank car lease rates and utilization should remain supported, and the value of flexible car supply increases rather than decreases.
We are Watching Tight Leasing Fundamentals
Leasing platforms continue to operate near or at full utilization, a dynamic that has persisted through the fall and shows no sign of easing as we close the year. Market chatter last week confirms that major lessors are seeing strong pricing power on lease renewals, with tank car rates holding firm and hopper car rates stepping up as grain logistics and agricultural demand drive utilization higher. The “record performance” flagged by public lessors earlier in the quarter has solidified into a tight baseline reality for December.
Winter operating constraints are actually amplifying the value of well-positioned lease fleets. Since cars in the wrong location or subject to narrow operating windows have less utility, shippers are increasingly willing to pay premium pricing for equipment that is already positioned close to demand, or that can be pre-staged before weather tightens service windows. That creates a structural advantage for lessors with strong asset positioning and relationships with regional shippers who cannot afford to wait for car availability to “magically align.” The secondary market for lease-attached equipment remains robust, as private equity and strategic buyers see durable yield in hard assets supported by utilization and renewal rate step-ups that continue to validate valuations. As always, PFL is on top of these markets, call the desk to let us help you.
We are Watching Class 1 Rail Service
Rail service into year-end looks better on paper than it feels on the ground, and that distinction matters for anyone trying to move liquids in winter. Across the Class I network, average train speeds are higher, and dwell is generally lower than earlier in the fall, with recent Surface Transportation Board data showing improved velocity and fewer trains held.
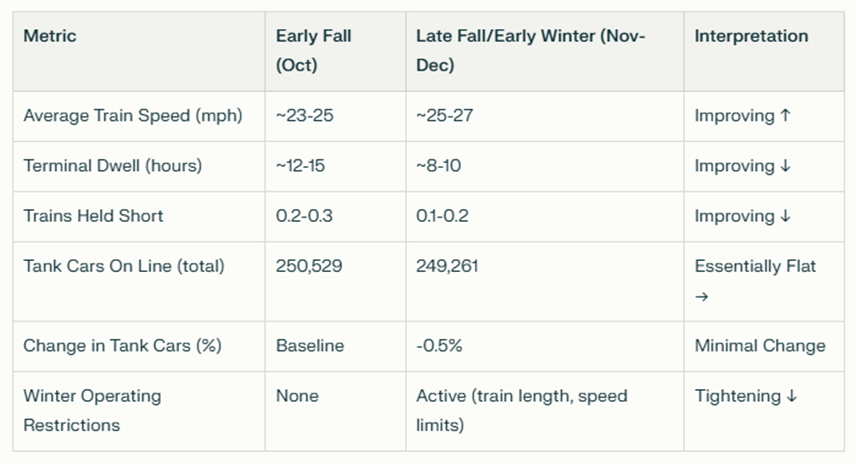
Source Data: STB – PFL Analytics
Canadian railroads, through their published winter plans, have already signaled that they will operate with more conservative practices as temperatures drop, including train-length restrictions and tighter switching windows that compress the effective utility of equipment even when headline velocity numbers improve. The collision between “better averages” and “narrower operational windows” creates a market signal that looks looser than it actually is.
The numbers tell the story! Headline service metrics have clearly improved over the past two months, but the capacity picture underneath has barely budged.:
Even more telling is where operational friction actually concentrates. While system-average train speeds are up, the number of loaded cars sitting immobile for more than 48 hours at terminals shows much more volatility—and in many cases is getting worse, not better:
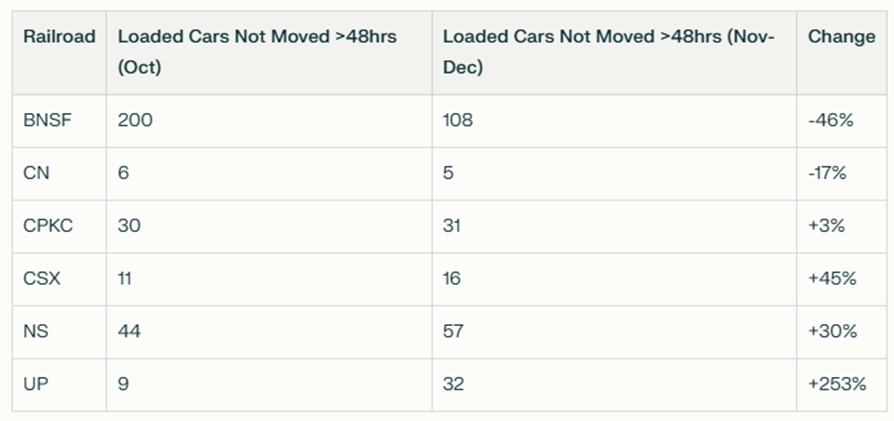
Source Data: STB – PFL Analytics
Tank car fleet data reinforces this paradox. Total tank cars on line across the six largest North American railroads have barely moved over the past month, with Railinc’s tracking showing minimal net changes as cars cycle between busy corridors without accumulating in storage or on sidings. For shippers, this means cars are available in aggregate but often in the wrong place, with redeployment constrained by timing, regulatory approvals, and winter speed restrictions. The result is a market where railcar utility—not nominal availability—is what determines who can move and who cannot. Shippers best positioned to use winter capacity are those who pre-stage equipment, secured approvals in advance, and treat rail positioning as a strategic lever, rather than a reactive tool.
We are Watching Regulatory Pressure for Better Data
There is an emerging regulatory and transparency angle that will matter over the medium term. The Surface Transportation Board’s proposal to require Class I railroads to report on-time performance data based on original estimated times of arrival and “industry spot and pull” measures has drawn strong support from commodity shippers—refiners, petrochemical producers, and grain handlers—who argue that system-average metrics mask localized congestion that drives real costs in their supply chains. Shippers are pushing for data to be broken out by corridor, terminal, and service type, including unit trains, which railroads have resisted.
For the railcar market, more granular service transparency will not change fundamentals overnight, but it will gradually shift how contracts are priced and how value is attributed to service quality and positioning. In an environment where service metrics “look better” while many shippers still experience tight utility in practice, better data may be the bridge that finally aligns perception with reality. That, in turn, will reinforce the value of flexible leasing, smart positioning, and premium service offerings that can reliably deliver cars when they are actually needed, not just when system-average velocity suggests that they should be available.
We are watching Key Economic Indicators
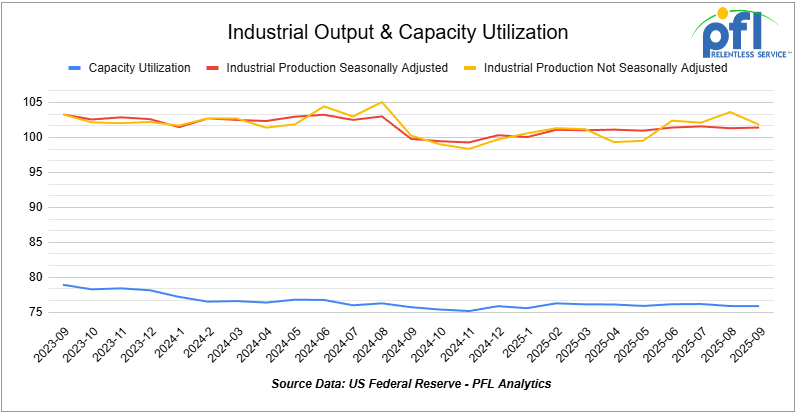
Industrial Output & Capacity Utilization
Manufacturing accounts for roughly 75% of total industrial output. In September 2025, manufacturing output rose 0.3% m/m after a 0.2% increase in August, and is now up 1.1% y/y. Total capacity utilization held at 77.4%, remaining about 2.1 pp below its long-run average.
Manufacturing capacity utilization ticked up to 76.9%, indicating ongoing slack in the sector even as output continues to improve modestly.
Lease Bids
- 30-50, 6000cf Steel Hopper located off of CSX or NS in East. For use in petcoke service. Period: 5 Years.
- 10, 2500CF Open Top Hopper located off of UP or BN in Texas. For use in aggregate service. Period: 5 years. Need Rapid Discharge Doors.
- 50, 23.5-25.5 DOT111 Tank located off of Any Class 1 in USA. For use in Asphalt service. Period: 5 years.
- 100, 21.9K 117J Tank located off of All Class 1s in Midwest. For use in CO2 service. Period: 6 months.
- 30-50, 30K 117J Tank located off of NS or CSX in Northeast. For use in C5 service. Period: 1 year.
Sales Bids
- 28, 3400CF Hopper Covered located off of UP BN in Texas. For use in Cement service.Cement Gates needed..
- 20, 17K Tank DOT111 located off of various class 1s in various locations. For use in corn syrup service.
- 120, Various Gondola Open-Top Aluminum Rotary located off of various class 1s in various locations. For use in Sulphur service.Built 2004 or later.
Lease Offers
- 100, 30K CPC1232 Tanks located off of UP or BN in Texas. Last used in Diesel.
- 100, 30K DOT117J Tanks located off of UP or BN in Texas. Last used in Gasoline.
- 100, 29K DOT117J Tanks located off of UP or BN in Texas. Last used in Gasoline. Coiled and Insulated.
- 36, 6351 Covered Hopper located off of CN in Wisconsin. Last used in Grain. through 2/27.
- 29, 6580 Covered Hopper located off of CN in Wisconsin. Last used in Grain. through 2/26.
- 18, 6580 Covered Hopper located off of CN in Wisconsin. Last used in Grain. through 2/27.
- 9, 5400 Covered Hopper located off of CN in Wisconsin. Last used in Grain. through 2/27.
- 21, 6351 Covered Hopper located off of CN in Wisconsin. Last used in DDG. Available until February 2027.
- 29, 6500 Covered Hopper located off of CN in Wisconsin. Last used in DDG. Available until February 2027.
- 50, 5380 Covered Hopper located off of UP or BN in Houston. Last used in Fertilizer. Cars are currently clean. Available until February.
- 50, 20K DOT117J Tank located off of All Class 1s in Moving. Last used in Styrene.
- 29, 25.5K DOT117J Tank located off of UP or BN in Texas. Cars are currently clean. Cars are currently clean.
- 90, 30K DOT117J Tank located off of UP or BN in Corpus Christie. Last used in Diesel.
Sales Offers
- 21, 50′ Boxcar Plate Cs located off of various class 1s in NM. End of Life.
- 3, 50′ Boxcar Plate Cs located off of various class 1s in multiple locations. End of Life.
- 27, 50′ Boxcar Plate Cs located off of various class 1s in PQ. End of Life.
- 100, 3250 Covered Hoppers located off of various class 1s in multiple locations. Sand Cars.
- 5, 2740 Mill Gondolas located off of various class 1s in NC. End of Life.
- 1, 2260 Mill Gondolas located off of various class 1s in AL. End of Life.
- 30, 2740 Mill Gondolas located off of various class 1s in multiple locations. End of Life.
- 21, 2740 Mill Gondolas located off of various class 1s in WA. End of Life.
- 9, 4750 Covered Hoppers located off of various class 1s in multiple locations. End of Life.
- 5, 4750 Covered Hoppers located off of various class 1s in multiple locations. End of Life.
- 50, 31.8K Tank CPC 1232s located off of UP or BN in TX. Requal Due in 2025.
- 100, 4600CF Open Top Hoppers located off of BN or CSX in Southeast. N/A.
Call PFL today to discuss your needs and our availability and market reach. Whether you are looking to lease cars, lease out cars, buy cars, or sell cars call PFL today at 239-390-2885
Live Railcar Markets
| CAT | Type | Capacity | GRL | QTY | LOC | Class | Prev. Use | Offer | Note |
|---|
PFL will be at the Following Conferences

- Where: La Quinta, CA
- Attending: David Cohen (954-729-4774)
- Conference Website

- Where: Hyatt Regency Dallas in Dallas, TX
- Attending:Curtis Chandler (239.405.3365), David Cohen (954-729-4774), Brian Baker (239.297.4519), Cyndi Popov(403) 402-5043
- Conference Website