“Life is like a coin. You can spend it any way you wish, but you only spend it once.”
— Lillian Dickson
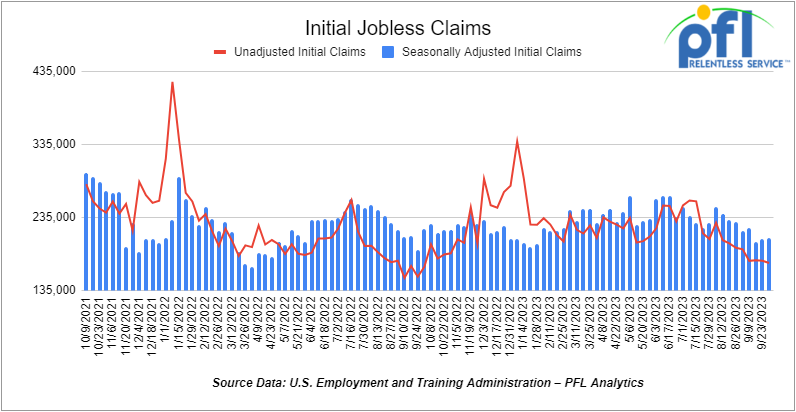
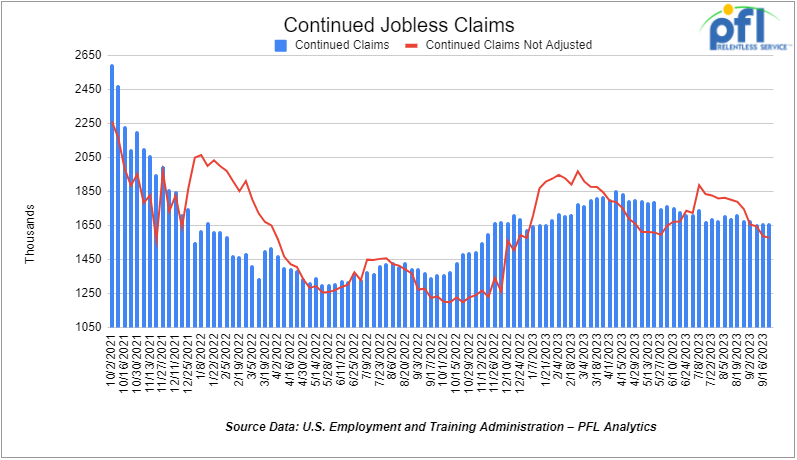
Jobs Update
- Initial jobless claims for the week ending September 30th, 2023 came in at 207,000, up 2,000 people week-over-week.
- Continuing jobless claims came in at 1.664 million people, versus the adjusted number of 1.665 million people from the week prior, down -1,000 people week-over-week.
Stocks closed higher on Friday of last week and up week over week
The DOW closed higher on Friday of last week, up 288.014 points (0.87%), closing out the week at 33,407.58, down -99.92 points week-over-week. The S&P 500 closed higher on Friday of last week, up 50.31 points (1.18%), and closed out the week at 4,308.5, up 20.45 points week-over-week. The NASDAQ closed higher on Friday of last week, up 211.51 points (1.6%), and closed the week at 13,431.34, up 212.02 points week-over-week.
In overnight trading, DOW futures traded lower and are expected to open at 33,468 this morning down -132 points.
Crude oil closed higher on Friday of last week, but lower week over week
WTI traded up $0.48 per barrel (+0.58%) to close at $82.79 per barrel on Friday of last week, but down -$8.18 per barrel week-over-week. Brent traded up US$0.51 per barrel (+0.61%) on Friday of last week, to close at US$84.58 per barrel, but down -US$10.73 per barrel week-over-week. Growing concerns about further rate increases and a longer period of hawkish monetary policy has provided the backdrop for oil’s recent selloff. At the same time, technical selling and algorithmic trading have pushed the decline into a full-blown rout.
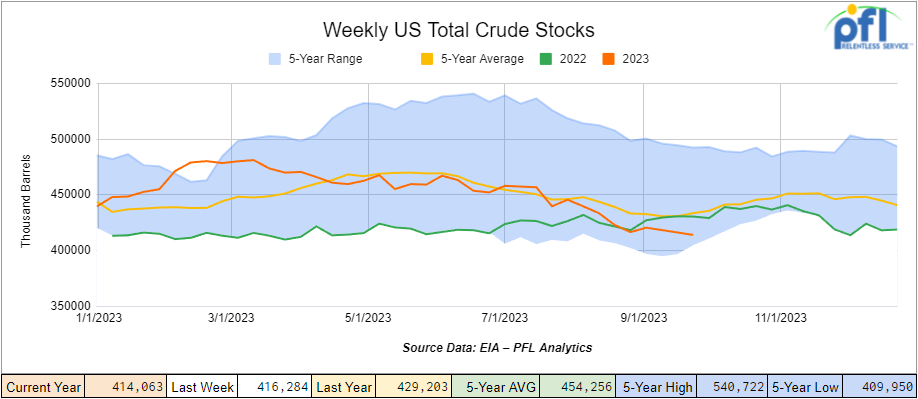
U.S. commercial crude oil inventories (excluding those in the Strategic Petroleum Reserve) decreased by 2.2 million barrels week-over-week. At 414.1 million barrels, U.S. crude oil inventories are 5% below the five-year average for this time of year.
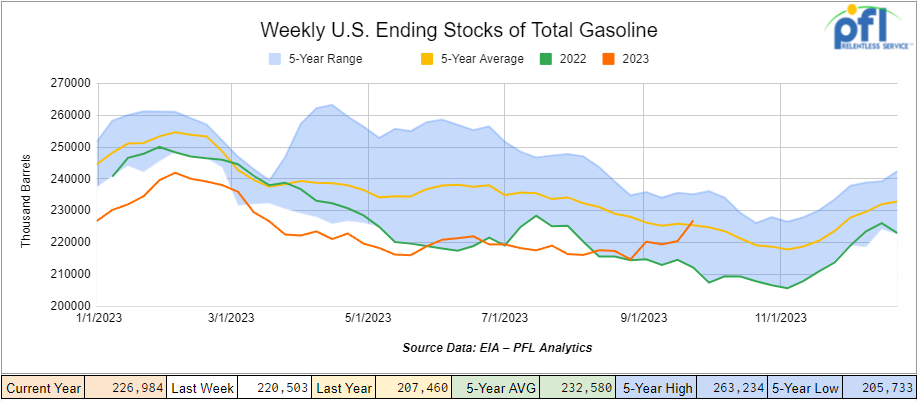
Total motor gasoline inventories increased by 6.5 million barrels week-over-week and are 1% above the five-year average for this time of year.
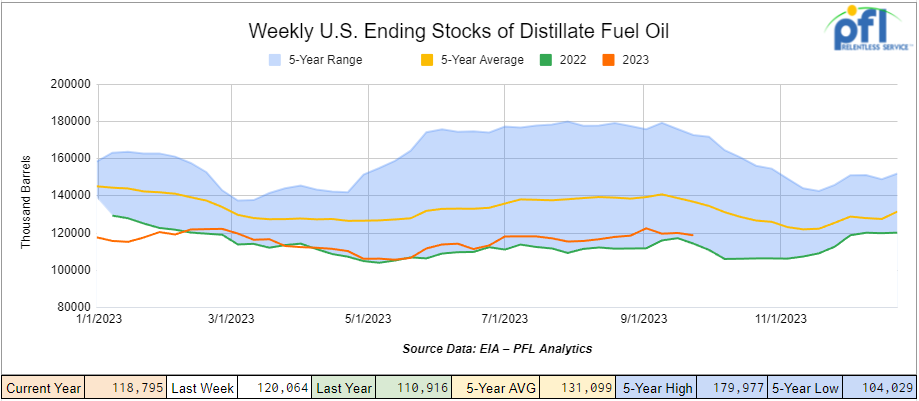
Distillate fuel inventories decreased by 1.3 million barrels week-over-week and are 13% below the five-year average for this time of year.
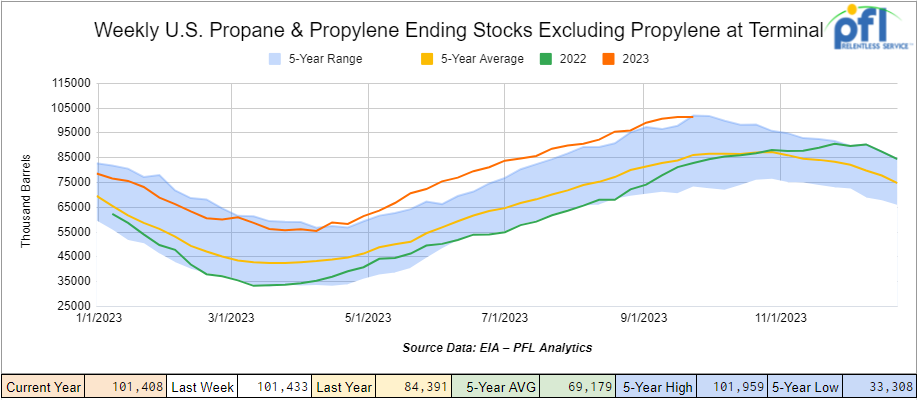
Propane/propylene inventories slightly decreased week-over-week and are 18% above the five-year average for this time of year.
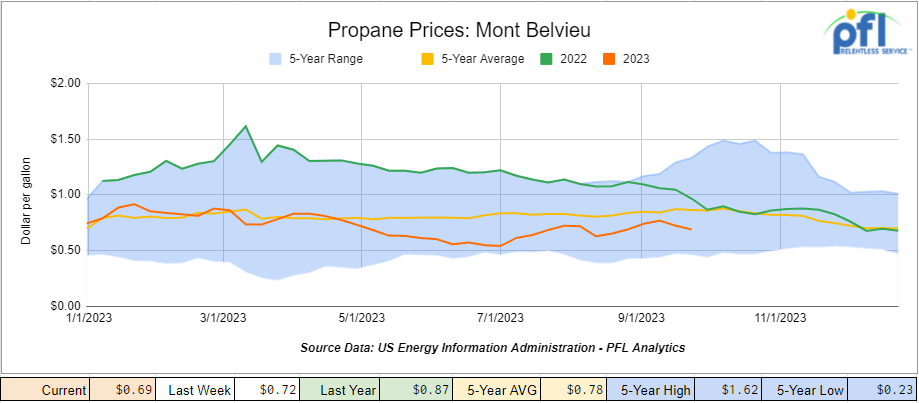
Propane prices closed at 69 cents per gallon, down -3 cents per gallon week-over-week, and down -18 cents per gallon year-over-year.
Overall, total commercial petroleum inventories increased by 4.6 million barrels during the week ending September 29, 2023.
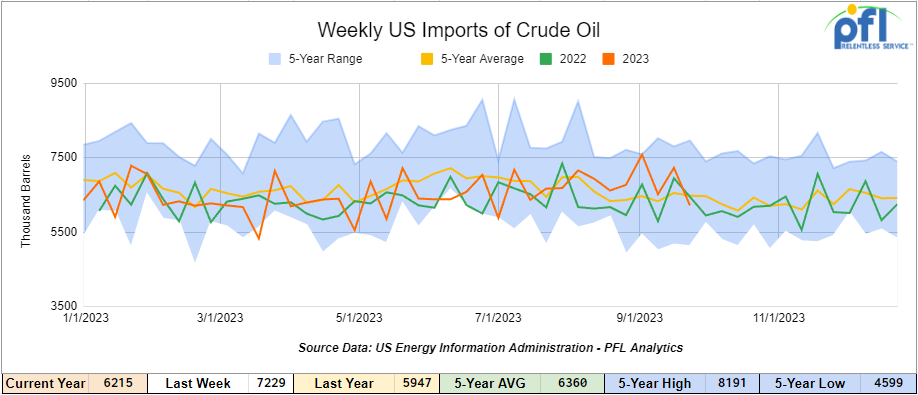
U.S. crude oil imports averaged 6.2 million barrels per day during the week ending September 29, 2023, a decrease of 1 million barrels per day week-over-week. Over the past four weeks, crude oil imports averaged 6.9 million barrels per day, 9.6% more than the same four-week period last year. Total motor gasoline imports (including both finished gasoline and gasoline blending components) for the week ending September 29th, 2023 averaged 919,000 barrels per day, and distillate fuel imports averaged 85,000 barrels per day during the week ending September 29, 2023.
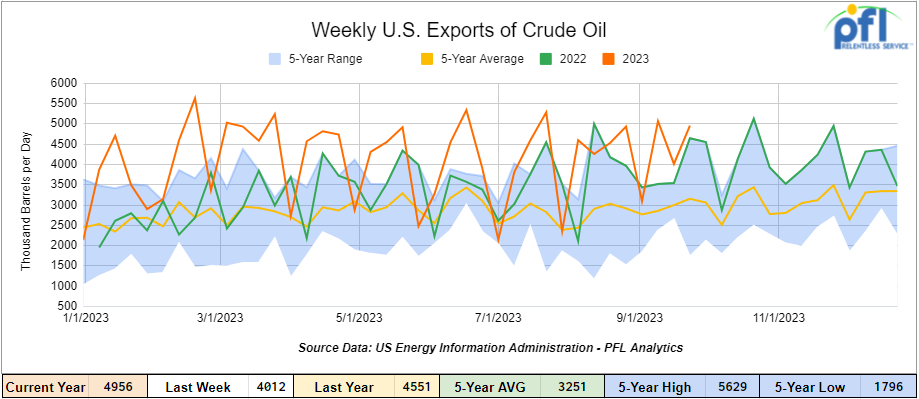
U.S. crude oil exports averaged 4.956 million barrels per day for the week ending September 29th, an increase of 944,000 barrels per day week-over-week. Over the past four weeks, crude oil exports averaged 4.281 million barrels per day.
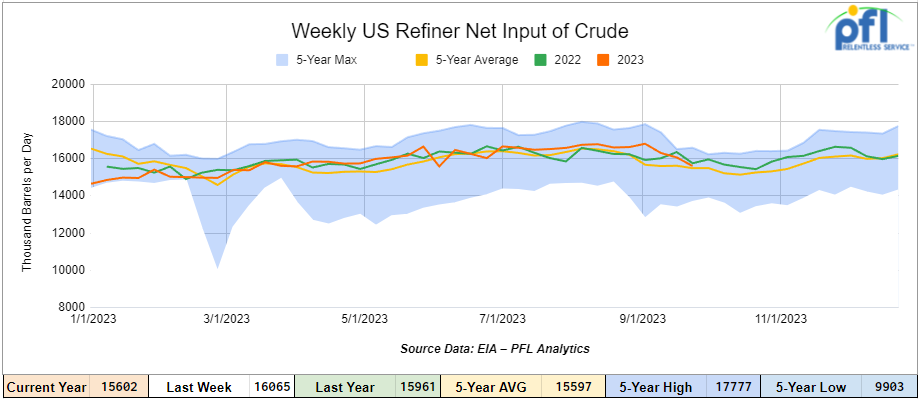
U.S. crude oil refinery inputs averaged 15.6 million barrels per day during the week ending September 29, 2023, which was 463,000 barrels per day less than the previous week’s average.
WTI is poised to open at 85.51, up $2.72 per barrel from Friday’s close.
North American Rail Traffic
Week Ending October 4th, 2023.
Total North American weekly rail volumes were up (+0.33%) in week 39, compared with the same week last year. Total carloads for the week ending on October 4th, 2023 were 360,184, up (+1.54%) compared with the same week in 2022, while weekly intermodal volume was 330,168, down (-0.96%) compared to the same week in 2022. 8 of the AAR’s 11 major traffic categories posted year-over-year decreases with the most significant decrease coming from Grain (-8.16%). The largest increase came from Motor Vehicles and Parts (+7.17%).
In the East, CSX’s total volumes were up (4.74%), with the largest decrease coming from Grain (-3.79%) and the largest increase from Nonmetallic Minerals (+23.51%). NS’s volumes were up (1.82%), with the largest decrease coming from Petroleum and Petroleum Products (-27.42) and the largest increase from Chemicals (+27.52%).
In the West, BN’s total volumes were up (0.72%), with the largest decrease coming from Grain (-16.88%), and the largest increase coming from Other (+26.86%). UP’s total rail volumes were up (+0.38%) with the largest decrease coming from Other (-20.83%) and the largest increase coming from Petroleum and Petroleum Products (+36.82%).
In Canada, CN’s total rail volumes were down (-9.57%) with the largest increase coming from Other (+23.65%) and the largest decrease coming from Intermodal (-27.63%). CP’s total rail volumes were up (+0.14%) with the largest decrease coming from Other (-39.81%) and the largest increase coming from Metallic Ores and Minerals (+100.66%).
KCS’s total rail volumes were down (-8.18%) with the largest decrease coming from Coal (-23.07%) and the largest increase coming from Motor Vehicles and Parts (+24.71%).
Source Data: AAR – PFL Analytics
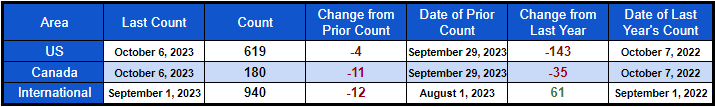
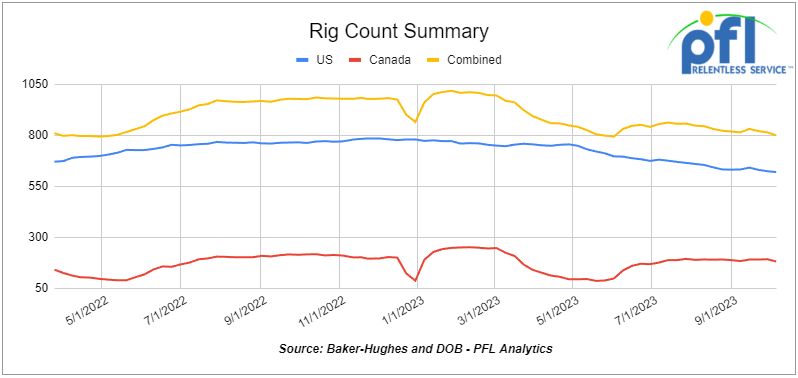
Rig Count
North American rig count was down by -15 rigs week-over-week. U.S. rig count was down by -4 rigs week-over-week and down by –143 rigs year-over-year. The U.S. currently has 619 active rigs. Canada’s rig count was down by -11 rigs week-over-week and down by -35 rigs year over year. Canada’s overall rig count is 180 active rigs. Overall, year-over-year, we are down -178 rigs collectively.
International rig count, which is reported monthly, was down by -12 rigs month-over-month and up +61 rigs year-over-year. Internationally there are 940 active rigs.
North American Rig Count Summary
A few things we are watching:
We are watching Petroleum Carloads
The four-week rolling average of petroleum carloads carried on the six largest North American railroads rose to 27,389 from 27,103, which was a gain of +286 rail cars week-over-week. Canadian volumes were mixed. CPKC’s shipments increased by +6% week over week, and CN’s volumes were lower by -6.7% week-over-week. U.S. shipments were mostly higher. The UP was the sole decliner and was down by -2.3% week-over-week. The NS had the largest percentage increase and was up by +8.1% week-over-week.
We Were at NEARS in Portland Maine Last week
Folks, the NEARS conference, while smaller than your traditional MARS or SWARS conference, was a good one to attend. While there were not a lot of shippers present, vendors were hungry to move their business plans forward. Stephan Loeb oversees the Final Mile Markets over at the NS and seems to have big plans to earn back the trucking business lost. Todd Tranausky from FTR had a lot to say on Coal – don’t know if we necessarily agree with all he had to say, but he had some compelling arguments. Perhaps the most interesting and informative speech of the session was from Marty Oberman – Chair of The Surface Transportation Board, who touched on Reciprocal Switching. The most interesting was the alliances of different class ones that are opening up collective lanes to compete with the CP KCS merger and how we are going to have options to get from one point to another in a seamless way. For more information on NEARS, please call the desk at 239-390-2885
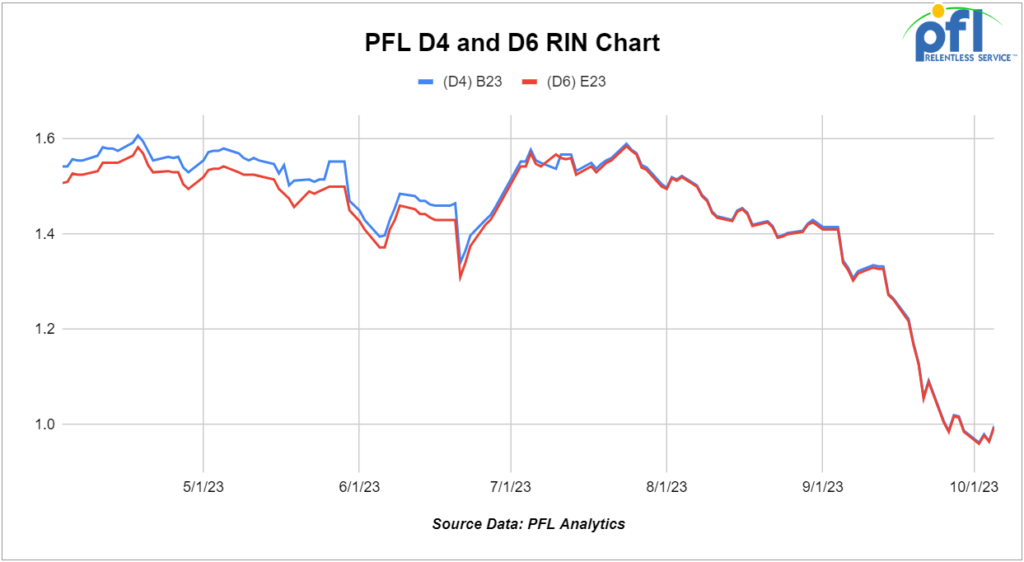
We are watching Renewables.
The economic advantage of blending ethanol into gasoline turned tighter for the first time in three months as Chicago bulk ethanol prices rallied 8.5% in September amid retreating gasoline and blender credit values.
September spot price for nearby Chicago in-tank ethanol transfers averaged $2.353 per gallon, gaining 18.5cts compared to the August spot average. At the same time, spot CBOB gasoline trading averaged $2.504/gal during the month, dropping 10.4cts, or 4.4%, from month to month.
That cut the outright cash ethanol discount versus CBOB from 45cts on the gallon in August to just 15.1cts in September. Further adding to the pain, Ethanol closed at $2.36 and ½ of a cent on Friday of last week. Ethanol blending benefits were further eroded by tumbling Renewable Identification Number values for 2023.
D6 ethanol-related credits averaged $1.192/RIN in September down 25.4cts, or 17.6%, versus August. The slide in credit values extended an August decline, cutting average RIN prices by 23.1% over the last two months. On Friday of last week, D6 RINS fell off the charts closing out the day and the week at 91 cents per RIN
D4 RINS fared even worse closing at parity with D6 RINS on Friday of last week. D4 RINS closed out the day and the week at 91 cents per RIN.
We are Watching Some Key Economic Indicators
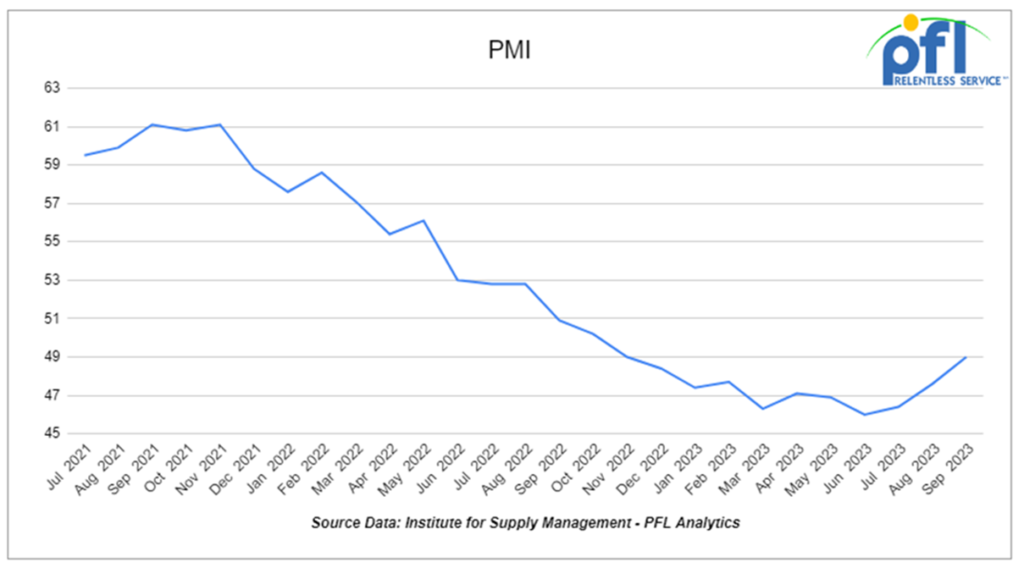
Purchasing Managers Index (PMI)
The Institute for Supply Management releases two PMI reports – one covering manufacturing and the other covering services. These reports are based on surveys of supply managers across the country and track changes in business activity. A reading above 50% on the index indicates expansion, while a reading below 50% signifies contraction, with a faster pace of change the farther the reading is from 50. In September, the PMI slightly increased to 49% from August 47.6%, marking the eleventh consecutive month of readings below 50% and a 1.4% increase month over month. Meanwhile, the new orders component decreased to 51.8% from 57.5%, down 5.7% month over month.
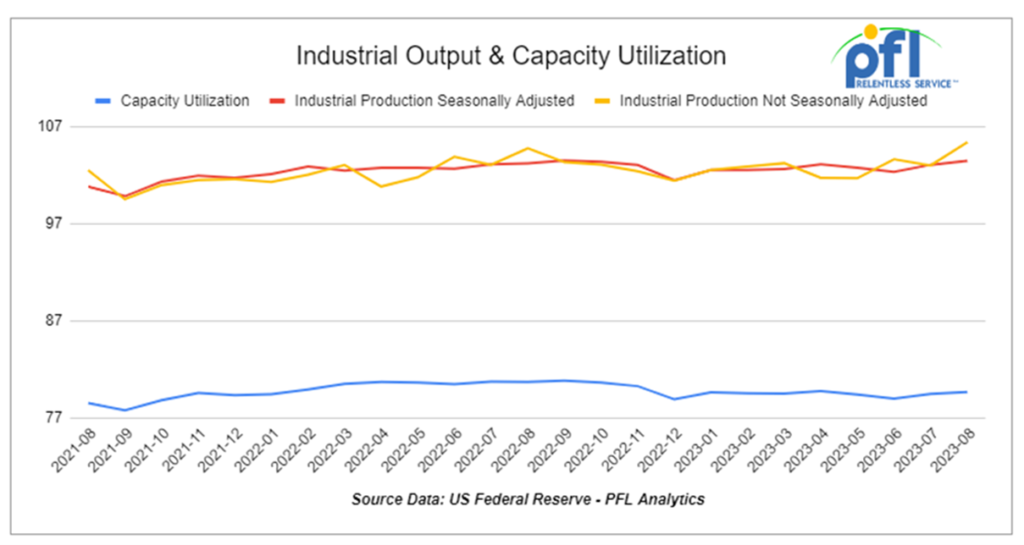
Industrial Output & Capacity Utilization
The Federal Reserve reported that total U.S. industrial output rose a preliminary 0.4% in August 2023 over July 2023, marking its largest gain month over month in six months. For manufacturing (which is around 75% of total output), output in August rose a preliminary 0.1% from July, but down from a 0.4% gain in July. Manufacturing output in August 2023 was down 0.6% from August 2022, its sixth consecutive year-over-year decline.
The overall industrial capacity utilization rate in August was a preliminary 79.7%, up from 79.3% The highest reading in four months. Capacity utilization for manufacturing was a preliminary 77.9% in August, up from 77.8% in July, up 0.1% month over month.
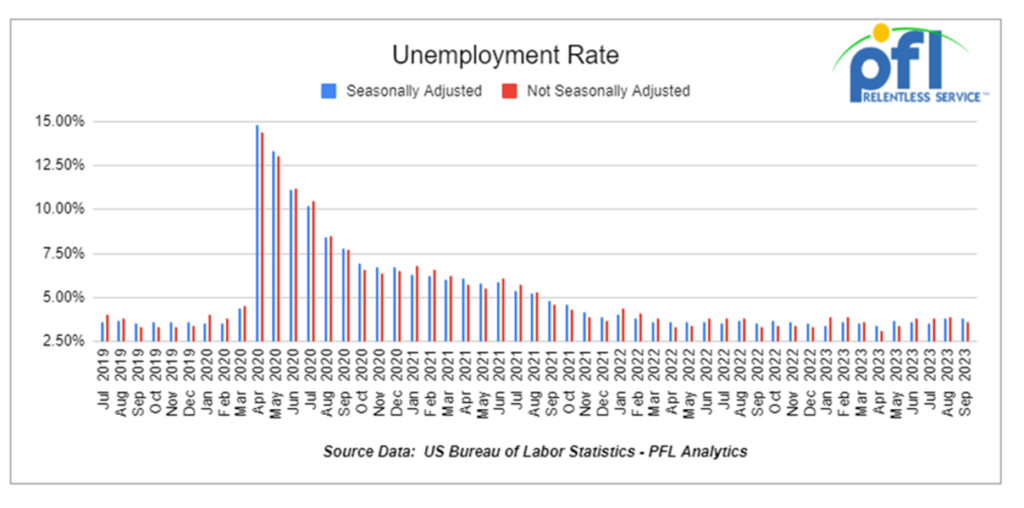
U.S. Unemployment Rate
The Bureau of Labor Statistics (BLS) reported that a preliminary 336,000 net new jobs were created in September 2023, up from 187,000 in August. September’s job gains were broad-based and double consensus estimates going in. Moreover, job gains for July and August were revised higher by a combined 119,000. If they hold up after revisions, the job gains mean the labor market hasn’t slowed as much as it appeared to at first over the past couple of months.
The overall unemployment rate was 3.8% in September, no change month over month.
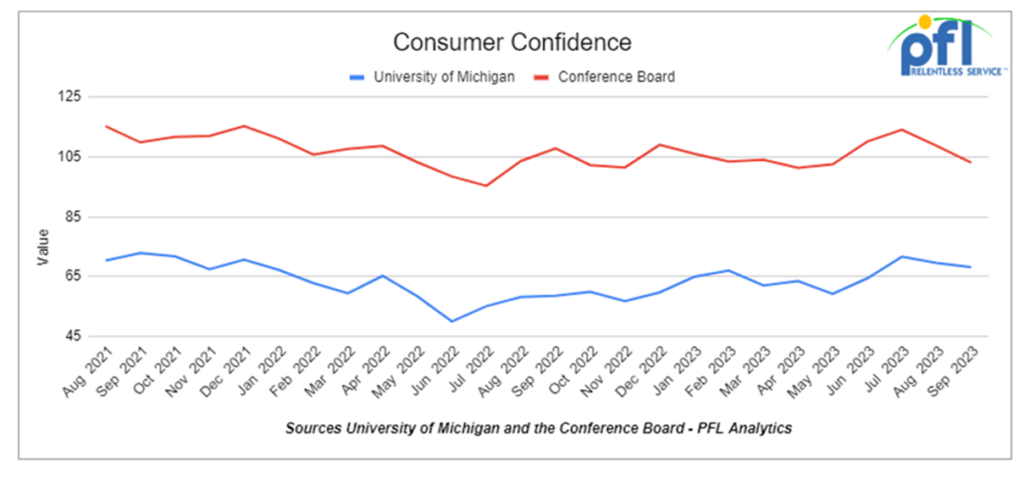
Consumer Confidence
The Conference Board’s Index of Consumer Confidence decreased in September to 103 down from 108.7 in August and well below its recent peak of 114.0 in July. It’s now the lowest it’s been in four months. The University of Michigan’s index of consumer sentiment fell from 69.5 in August to 68.1 in September. We expect a continued erosion of consumer sentiment unless things change real fast.
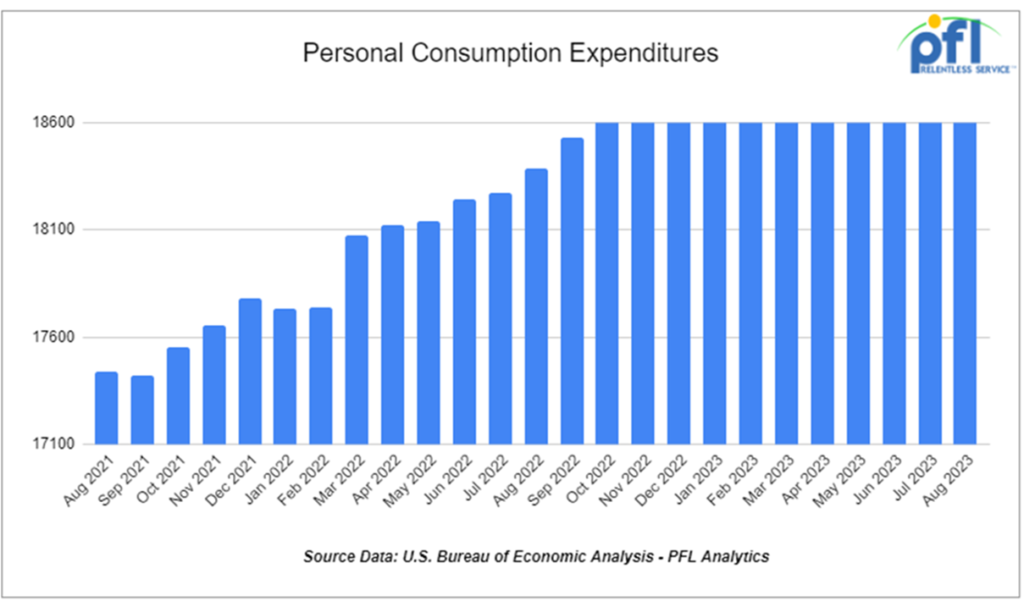
Consumer Spending
In August 2023, total U.S. consumer spending unadjusted for inflation rose a preliminary 0.4% in August over July, down from 0.9% in July over June. Spending on goods rose a preliminary 0.6% in August; spending on services was up 0.4%. August was the first time in four months that spending on goods outpaced services. Adjusted for inflation, total spending rose 0.1% in August from July.
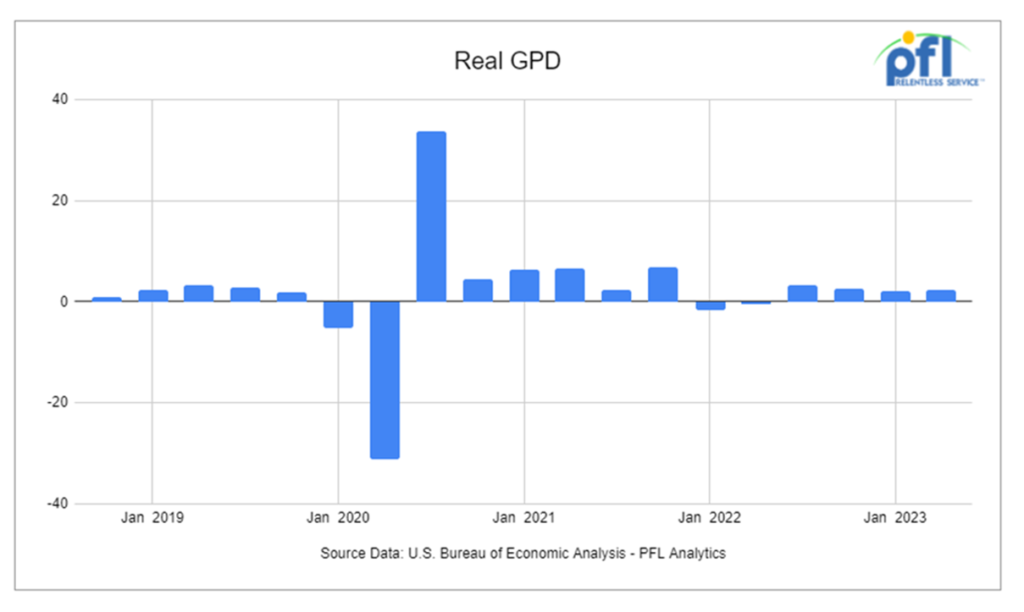
GDP
On September 28, the Bureau of Economic Analysis released its third preliminary estimate for Q2 2023 growth: 2.1%. The Bureau of Economic Analysis’s first estimate for Q3 2023 growth will be released on October 26.
The price index for personal consumption expenditures (the inflation measure preferred by the Federal Reserve) was up 3.5% in August 2023 over August 2022. The so-called “core inflation” — which excludes food and energy and which the Fed thinks is a better measure of underlying inflation — was up 3.9% in August.
We have been extremely busy at PFL with return-on-lease programs involving rail car storage instead of returning cars to a shop. A quick turnaround is what we all want and need. Railcar storage in general has been extremely active. Please call PFL now at 239-390-2885 if you are looking for rail car storage, want to troubleshoot a return on lease scenario, or have storage availability. Whether you are a car owner, lessor or lessee, or even a class 1 that wants to help out a customer we are here to “help you help your customer!”
Leasing and Subleasing has been brisk as economic activity picks up. Inquiries have continued to be brisk and strong Call PFL Today for all your rail car needs at 239-390-2885
Lease Bids
- 100, 30K Any Tanks needed off of Any in Chicago for December 23-May 24. Cars are needed for use in Gasoline service.
- 10, 2500CF Open Top Hoppers needed off of UP or BN in Texas for 5 Years. Cars are needed for use in aggregate service. Need Rapid Discharge Doors
- 108, 28.3K Any Tanks needed off of CN in Canada for 1-3 Years. Cars are needed for use in Crude service.
- 20-25, 30 or 31.8K Tanks needed off of in Texas for 1-5 Years. Cars are needed for use in VGO service. NC/NI
- 3, 30 or 31.8K Tanks needed off of in Texas for 1-5 Years. Cars are needed for use in Naphtha service. NC/NI
- 10-20, 30 or 31.8K Tanks needed off of in Texas for 1-2 Years. Cars are needed for use in Diesel service. NC/NI
- 1, 30 or 31.8K Tanks needed off of in Texas for 6-12 Months. Cars are needed for use in Mono-Propylene Glycol service. NC/NI
- 30-100, 31.8K CPC 1232 Tanks needed off of UP or BN in Texas for Purchase or Lease. Cars are needed for use in refined products service.
- 15, 30K 117 Tanks needed off of NS in SouthEast for 1 Year. Cars are needed for use in Diesel service.
- 25, 33K 340W Pressure Tanks needed off of UP or BN in Midwest for Oct-March. Cars are needed for use in Propane service.
- 20-25, 30K 117 Tanks needed off of UP or BN in Illinois for 5 Years. Cars are needed for use in Ethanol service.
- 100, 28.3K DOT 111/117 Tanks needed off of UP or BN in Midwest/Texas for 5 Years. Cars are needed for use in Veg Oils / Biodiesel service. Need to be Unlined
- 25-50, 33K 400W Pressure Tanks needed off of CN or CP in Canada for Short Term. Cars are needed for use in Propylene service.
- 50-100, 4550 Covered Hoppers needed off of UP or BN in Texas for 5 Years. Cars are needed for use in Grain service.
- 10, 33K 340W Pressure Tanks needed off of CN in LA for 1 Year. Cars are needed for use in Butane service.
- 25, 20.5K CPC1232 or 117J Tanks needed off of BNSF or UP in the west for 3-5 Year. Cars are needed for use in Magnesium chloride service. SDS onhand
- 25-50, 25.5K 117J Tanks needed off of NS CSX in NorthEast for 5 Years. Cars are needed for use in Asphalt / Heavy Fuel Oil service.
- 30-50, 33K 340W Pressure Tanks needed off of any class 1 in any location for 6-12 Months. Cars are needed for use in Propane service.
- 15, 28.3K 117J Tanks needed off of any class 1 in any location for 3 year. Cars are needed for use in Glycerin & Palm Oil service.
- 30, 17K-20K 117J Tanks needed off of UP or BN in Midwest/West Coast for 3-5 Years. Cars are needed for use in Caustic service.
- 10, 286K 15.7K Tanks needed off of KCS in Texas for 1 Year. Cars are needed for use in Sulfuric Acid service. Needed Next few months
- 150, 23.5K DOT 111 Tanks needed off of any class 1 in LA for 2-3 Year. Cars are needed for use in Fluid service. Needed July
- 25-50, 32K 340W Pressure Tanks needed off of NS or CSX in Marcellus for 1-2 Years. Cars are needed for use in Propane service.
- 25-50, 30K DOT 111, 117, CPC 1232 Tanks needed off of CN or CP in WI, Sarnia for 1-2 Years. Cars are needed for use in Diesel service.
- 10, 5200cf PD Hoppers needed off of UP in Colorado for 1-3 years. Cars are needed for use in Silica service. Call for details
- 30-40, 286K DOT 113 Tanks needed off of CN or CP/ UP in Canada/MM for 5 Years. Cars are needed for use in CO2 service. Q1
- 30, 30K DOT 111 Tanks needed off of UP in Texas for 1-3 Years. Cars are needed for use in Diesel service.
- 25-50, 5000CF-5100CF Lined Hoppers needed off of BNSF, CSX, KCS, UP in Gulf LA for 3-10 years. Cars are needed for use in Dry sugar service. 3 bay gravity dump
- 10, any capacity Stainless Steel Tanks needed off of any class 1 in Canada for 5-10 years. Cars are needed for use in Alcohol service.
- Up to 60, 5150cf Covered Hoppers needed off of CN, CSX, NS in the east or midwest for 3 years. Cars are needed for use in Fertilizer service. 3-4 hatch gravity dumps
- 20-30, 14k Any Tanks needed off of BNSF, UP in Texas for 1-3 Years. Cars are needed for use in HCl service. Call for more details
Sales Bids
- 100, Plate F Boxcars needed off of BN or UP in Texas.
- 20, 2770 Mill Gondolas needed off of CSX in the northeast. Cars are needed for use in non-haz soil service. 52-60 ft
- 10, 2770 Mill Gondolas needed off of any class 1 in St. Louis. Cars are needed for use in Cement service.
- 20, 2770-3400 Mill Gondolas needed off of any class 1 in South Texas. Cars are needed for use in scrap metal service.
- 8, 5200 Covered Hoppers needed off of various class 1s in various locations. Cars are needed for use in Plastic Pellet service.
- 10, 4000 Open Hoppers needed off of CSX in the northeast. Cars are needed for use in scrap metal service. Open top hopper
- 20-30, 3000 – 3300 PDs Hoppers needed off of BN or UP preferred in West. Cars are needed for use in Cement service. C612
- 100-150, 3400CF Covered Hoppers needed off of UP BN in Texas. Cars are needed for use in Sand service.
- 45, 3000 cf PD Hoppers needed off of any class 1 in Texas. Negotiable
- 200+, 5000cf Covered Hoppers needed off of any class 1 in various locations.
- 10, 6400 Open Hoppers needed off of CSX in the northeast. Cars are needed for use in wood chip service. Open top hopper, flat bottom
- 20, 17K DOT 111 Tanks needed off of various class 1s in various locations. Cars are needed for use in corn syrup service.
- 100, 15.7K DOT 111 Tanks needed off of CSX or NS in the east. Cars are needed for use in Molten Sulfur service.
- 30, 17K-20K DOT 111 Tanks needed off of UP or BN in Texas. Cars are needed for use in UAN service.
Lease Offers
- 70, 25.5K, 117J Tanks located off of UP in Texas. Cars are clean Call for more information
Sales Offers
- 100-200, 31.8K, CPC 1232 Tanks located off of BN in Chicago. Dirty/Clean
- 100, 28.3K, 117J Tanks located off of various class 1s in multiple locations.
Call PFL today to discuss your needs and our availability and market reach. Whether you are looking to lease cars, lease out cars, buy cars, or sell cars call PFL today at 239-390-2885
PFL offers turn-key solutions to maximize your profitability. Our goal is to provide a win/win scenario for all and we can handle virtually all of your railcar needs. Whether it’s loaded storage, empty storage, subleasing or leasing excess cars, filling orders for cars wanted, mobile railcar cleaning, blasting, mobile railcar repair, or scrapping at strategic partner sites, PFL will do its best to assist you. PFL also assists fleets and lessors with leases and sales and offers Total Fleet Evaluation Services. We will analyze your current leases, storage, and company objectives to draw up a plan of action. We will save Lessor and Lessee the headache and aggravation of navigating through this rapidly changing landscape.
PFL IS READY TO CLEAN CARS TODAY ON A MOBILE BASIS WE ARE CURRENTLY IN EAST TEXAS
Live Railcar Markets
| CAT | Type | Capacity | GRL | QTY | LOC | Class | Prev. Use | Offer | Note |
|---|