
“Far better is it to dare mighty things, to win glorious triumphs, even though checkered by failure… than to rank with those poor spirits who neither enjoy nor suffer much, because they live in a gray twilight that knows not victory nor defeat.”
– Theodore Roosevelt
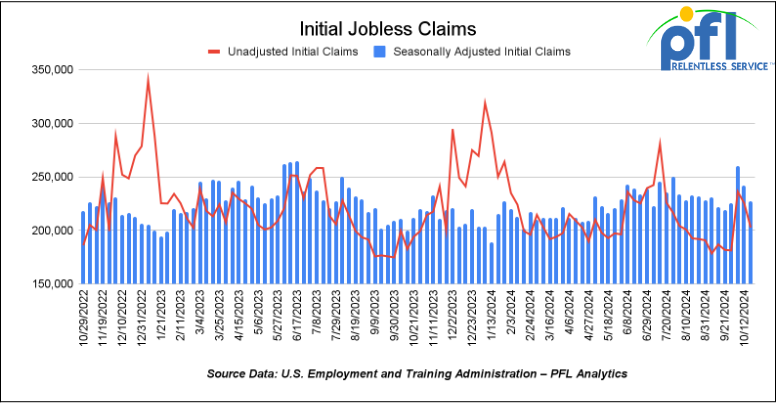
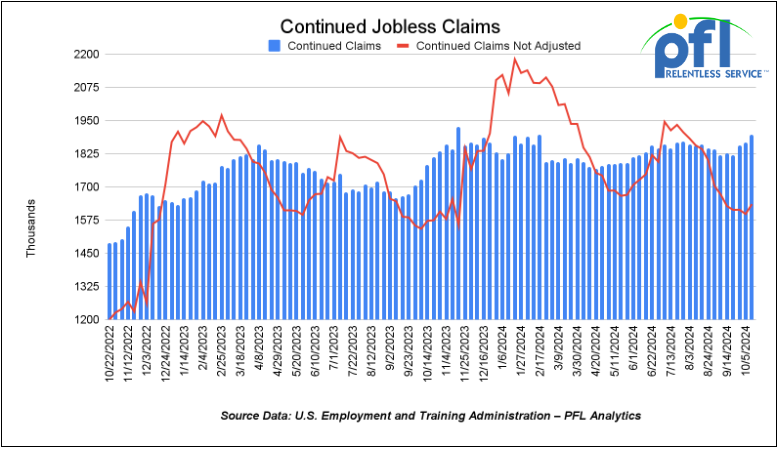
Jobs Update
- Initial jobless claims seasonally adjusted for the week ending October 19th came in at 227,000, down -15,000 people week-over-week.
- Continuing jobless claims came in at 1.897 million people, versus the adjusted number of 1.869 million people from the week prior, up 28,000 people week-over-week.
Stocks closed mixed on Friday of last week and mixed week over week
The DOW closed lower on Friday of last week, down -259.96 points (-0.61%) and closing out the week at 42,114.4, down -1,161.51 points week-over-week. The S&P 500 closed lower on Friday of last week, down -1.74 points (-0.03%) and closed out the week at 5,808.12, down -56.55 points week-over-week. The NASDAQ closed higher on Friday of last week, up 103.12 points (0.56%) and closed out the week at 18,518.61, up 29.07 points week over week.
In overnight trading, DOW futures traded higher and are expected to open at 42,521 this morning up 200 points.
Crude oil closed up on Friday of last week, and higher week over week.
West Texas Intermediate (WTI) crude closed up $1.59 per barrel (2.27%) to close at $71.78 per barrel on Friday of last week, up $2.56 per barrel week over week. Brent traded up $1.67 USD per barrel (2.25%) on Friday of last week, to close at $76.05 per barrel, up $2.99 per barrel week-over-week.
One Exchange WCS (Western Canadian Select) for December delivery settled Friday on last week at US$12.00 below the WTI-CMA (West Texas Intermediate – Calendar Month Average). The implied value was US$ 57.73 per barrel.
Oil prices posted a weekly gain as geopolitical uncertainty remains a central focus of oil traders, a strong dollar and a large U.S. inventory build are holding Brent and WTI back. However, we will see what this week has in store for us as Israel launched its largest attack ever against Iran over the weekend but shrugged off by the market.
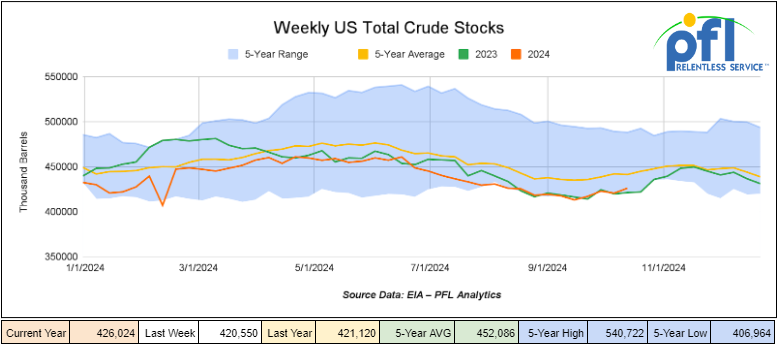
U.S. commercial crude oil inventories (excluding those in the Strategic Petroleum Reserve) increased by 5.5 million barrels week-over-week. At 426.0 million barrels, U.S. crude oil inventories are 4% below the five-year average for this time of year.
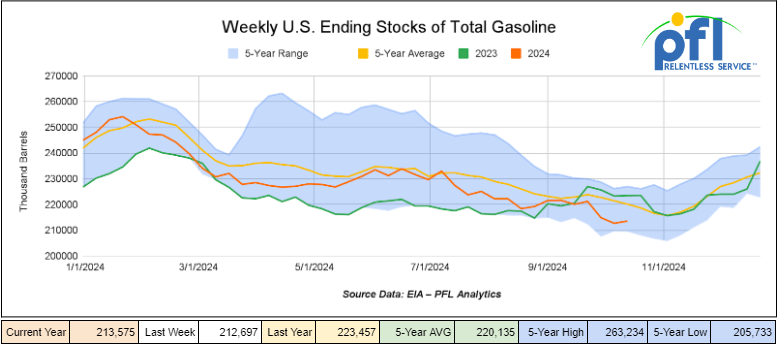
Total motor gasoline inventories increased by 900,000 barrels week-over-week and are 3% below the five-year average for this time of year.
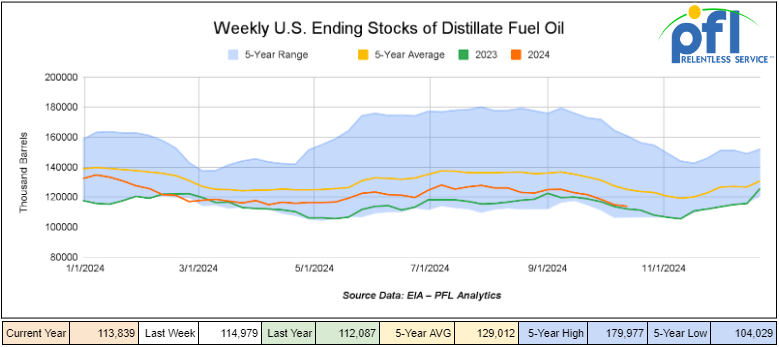
Distillate fuel inventories decreased by 1.1 million barrels week-over-week and are 9% below the five-year average for this time of year.
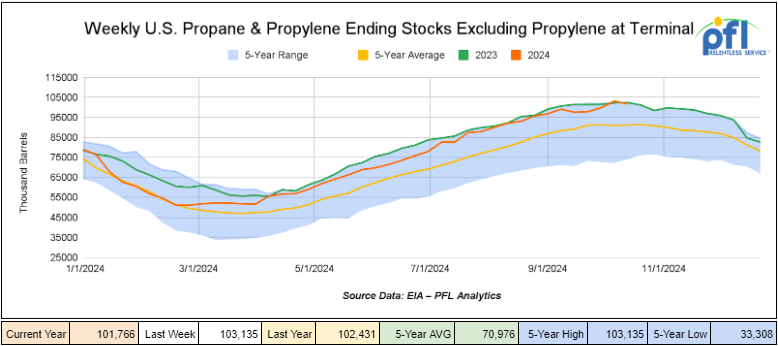
Propane/propylene inventories decreased by 1.4 million barrels week-over-week and are 11% above the five-year average for this time of year.
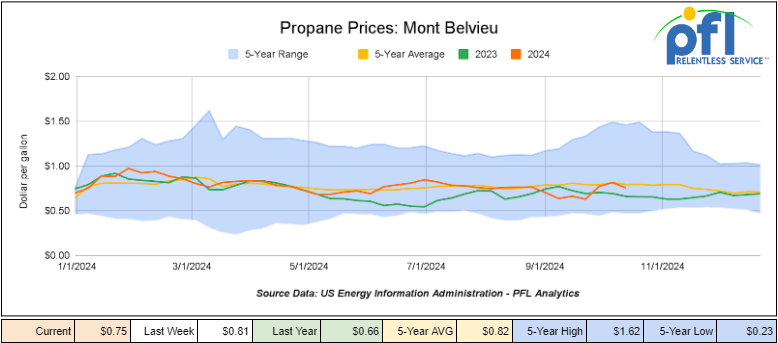
Propane prices closed at 75 cents per gallon on Friday of last week, down 6 cents per gallon week-over-week and up 9 cents per gallon year-over-year.
Overall, total commercial petroleum inventories increased by 5.9 million barrels during the week ending October 18th, 2024.
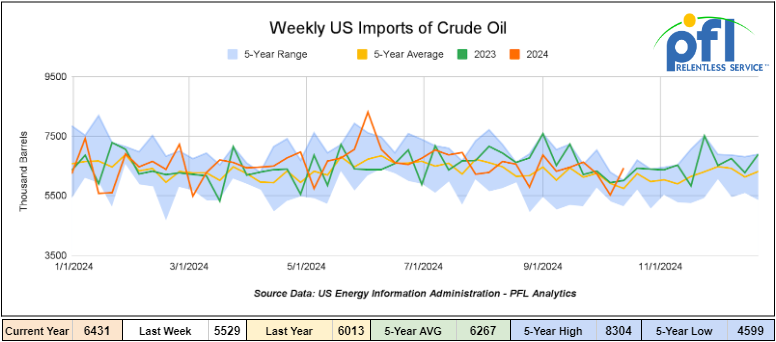
U.S. crude oil imports averaged 6.4 million barrels per day during the week ending October 18th, 2024, an increase of 902,000 barrels per day week-over-week. Over the past four weeks, crude oil imports averaged 6.2 million barrels per day, 1.3% more than the same four-week period last year. Total motor gasoline imports (including both finished gasoline and gasoline blending components) averaged 514,000 barrels per day, and distillate fuel imports averaged 105,000 barrels per day during the week ending October 18th, 2024.
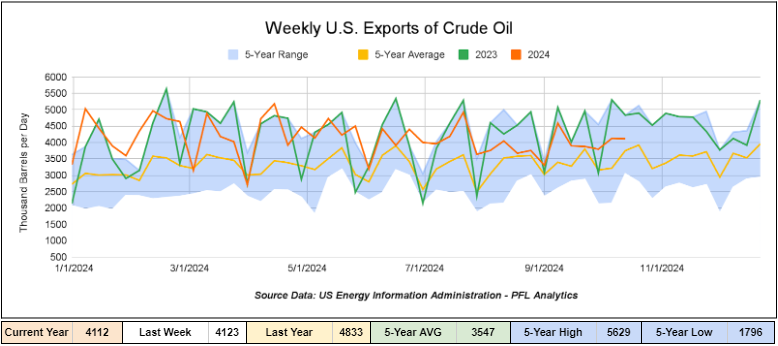
U.S. crude oil exports averaged 4.112 million barrels per day during the week ending October 18th, 2024, a decrease of 11,000 barrels per day week-over-week. Over the past four weeks, crude oil exports averaged 3.977 million barrels per day.
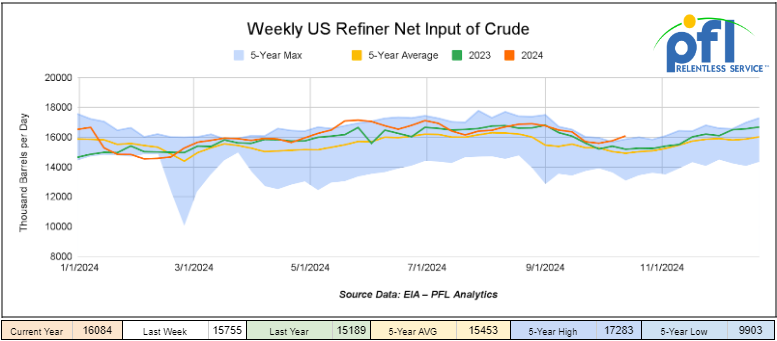
U.S. crude oil refinery inputs averaged 16.1 million barrels per day during the week ending October 18, 2024, which was 329,000 barrels per day more week-over-week.
WTI is poised to open at $67.42, down -$4.36 per barrel from Friday’s close.
North American Rail Traffic
Week Ending October 23rd, 2024.
Total North American weekly rail volumes were up (0.82%) in week 43, compared with the same week last year. Total carloads for the week ending on October 23rd were 343,187, down (-3.77%) compared with the same week in 2023, while weekly intermodal volume was 355,591, up (5.68%) compared to the same week in 2023. 6 of the AAR’s 11 major traffic categories posted year-over-year decreases. The most significant decrease came from Coal, which was down (-10.83%). The most significant increase came from Other which was up (+8.88%).
In the East, CSX’s total volumes were down (-1.31%), with the largest decrease coming from Nonmetallic Minerals (-21.10%) while the largest increase came from Petroleum and Petroleum Products (+24.92%). NS’s volumes were up (4.26%), with the largest increase coming from Grain (+77.69%), while the largest decrease came from Forest Products (-4.92%).
In the West, BN’s total volumes were up (+4.69%), with the largest increase coming from Intermodal (+10.98%) while the largest decrease came from Other, down (-19.09%). UP’s total rail volumes were down (0.64%) with the largest decrease coming from Coal, down (-21.71%), while the largest increase came from Other, which was up (+46.43%).
In Canada, CN’s total rail volumes were down (-9.52%) with the largest decrease coming from Intermodal, down (-21.22%) while the largest increase came from Other, up (+14.9%). CP’s total rail volumes were up (2.28%) with the largest increase coming from Other (+268%), while the largest decrease came from Petroleum and Petroleum Parts (-24.14%).
KCS’s total rail volumes were down (-7.81%) with the largest decrease coming from Coal (-45.95%) and the largest increase coming from Farm Products (+72.66%).
Source Data: AAR – PFL Analytics
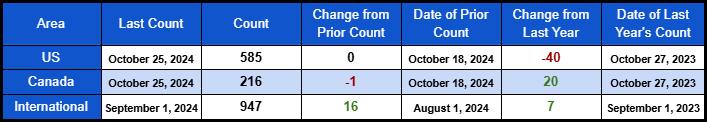
Rig Count
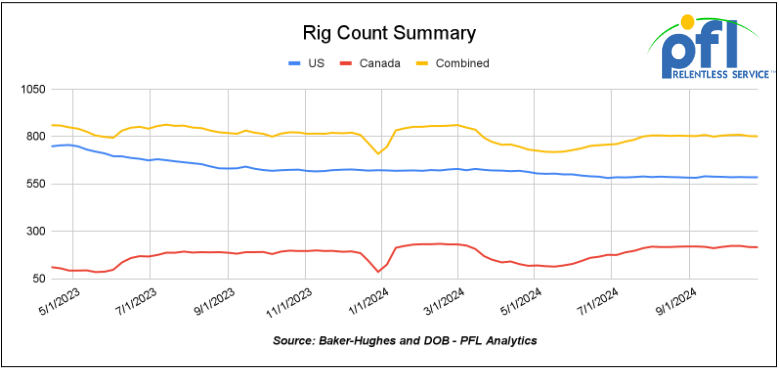
North American rig count was down by -1 rigs week-over-week. U.S. rig count was flat week-over-week, but down by -40 rigs year-over-year. The U.S. currently has 585 active rigs. Canada’s rig count was down -1 rig week over week, but up by 20 rigs year-over-year and Canada’s overall rig count is 216 active rigs. Overall, year over year we are down by -20 rigs collectively.
North American Rig Count Summary
A few things we are watching:
We Are Watching Key Economic Indicators
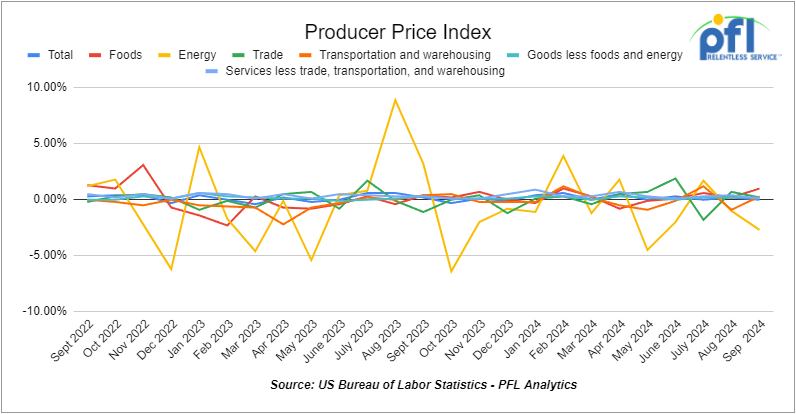
Producer Price Index
In September 2024, the Producer Price Index (PPI) for final demand remained unchanged from August. The index for final demand goods fell by 0.2%, primarily due to a significant 2.7% drop in energy prices, notably a 5.6% decrease in gasoline. On the other hand, the index for final demand services saw a 0.2% increase, led by sectors like machinery, vehicle wholesaling, and deposit services. Over the past 12 months, final demand prices increased by 1.8%, which is slightly up from the 1.7% recorded in August.
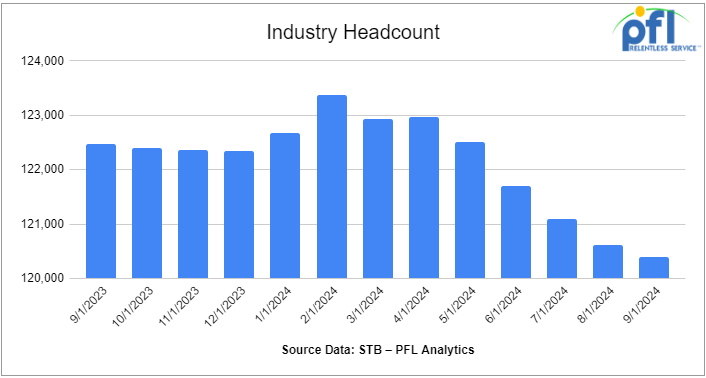
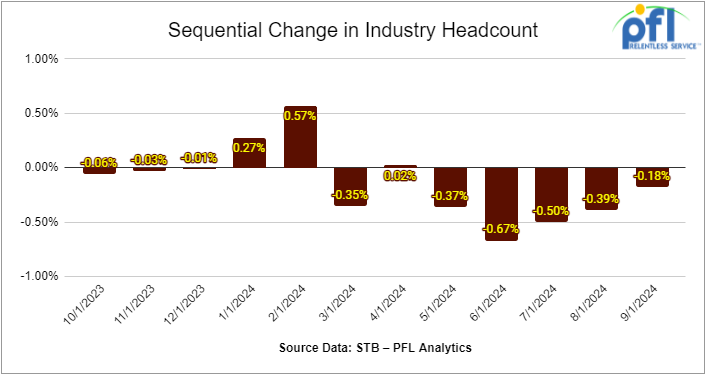
We Are Watching Class 1 Headcount
Class I railroads employed 120,399 workers in the United States in September 2024, a -0.18% decrease from August 2024’s count of 120,611 and a -1.69% year-over-year decrease, according to Surface Transportation Board data.

Five of the six employment categories posted month-over-month decreases between August and September. They were executives, officials, and staff assistants, down -0.56% to 7,858 workers; transportation (train and engine), down -0.17% to 51,757 employees; professional and administrative, down -0.40% to 9,729; maintenance of way and structures, down -0.21% to 28,923; and transportation (other than train and engine), down -0.04% to 5,027.
The category that posted a month-over-month increase was maintenance of equipment and stores, up +0.13% to 17,105.
Year over year, two categories posted employment gains. Transportation (other than train and engine) increased by +2.17%, rising from 4,920 in September 2023 to 5,027 in September 2024. Additionally, maintenance of way and structures experienced a slight gain of +0.10%, increasing from 28,894 in September 2023 to 28,923 in September 2024.
Categories that registered year-over-year decreases in September were maintenance of equipment and stores, down -5.66%; professional and administrative, down -5.50%; executives, officials, and staff assistants, down -4.59%; and transportation (train and engine), down -0.44%.
We are watching the FRA
The Federal Railroad Administration last week published a notice of proposed rulemaking that calls for improving track safety by pairing automatic inspection technology with human inspections.
The changes would require certain railroads to supplement visual inspections by operating a track geometry measurement system (TGMS) at specified minimum frequencies on certain types of track. The rule also would set timeframes by which the railroads must act to remediate any track defects identified, FRA officials said in a press release last week.
Specifically, short lines, regionals, intercity passenger and commuter railroads would need to meet specified inspection frequencies on mainline and controlled siding track used to transport annual tonnage greater than 10 million gross tons, regularly scheduled passenger-rail service, or trains containing hazardous materials.
We are watching Renewables
Ethanol:
The rebound in U.S. ethanol spot prices from seven-month lows that traded the previous week began to run out of steam last week after a midweek report from the government showed a sharp, ongoing rise in ethanol production. Plant turnarounds are pretty much over folks, and most are running flat out. Ethanol closed at $1.55 and ½ of a cent per gallon, down 1 cent per gallon day over day, but up 1 cent per gallon week over week.
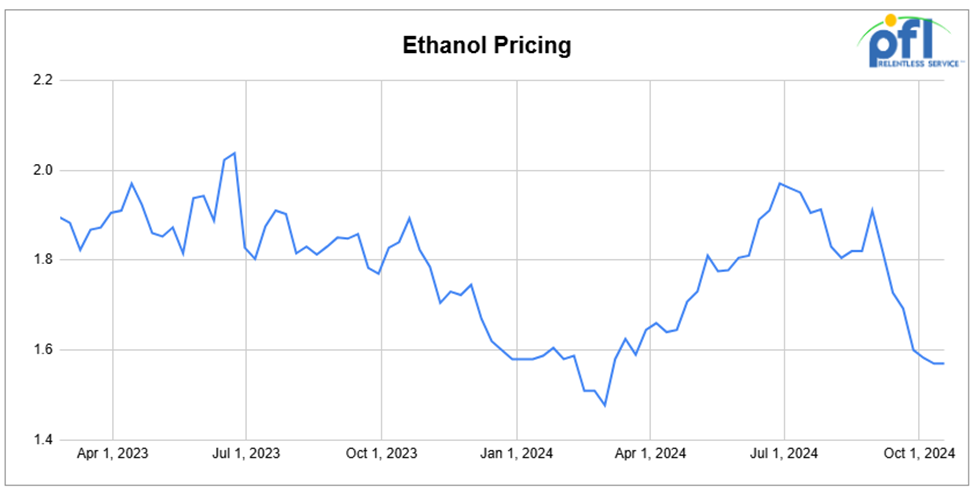
A recovery in corn futures last week did support ethanol spot values through the early part of the last week. Corn futures were up over 3.5% week over week. EIA recorded only a slight draw in U.S. ethanol stockpiles week over week, slipping 0.22% to 22.223 million bbl up 826,000 bbl year over year. The more ethanol produced and shipped, the better it is for rail!
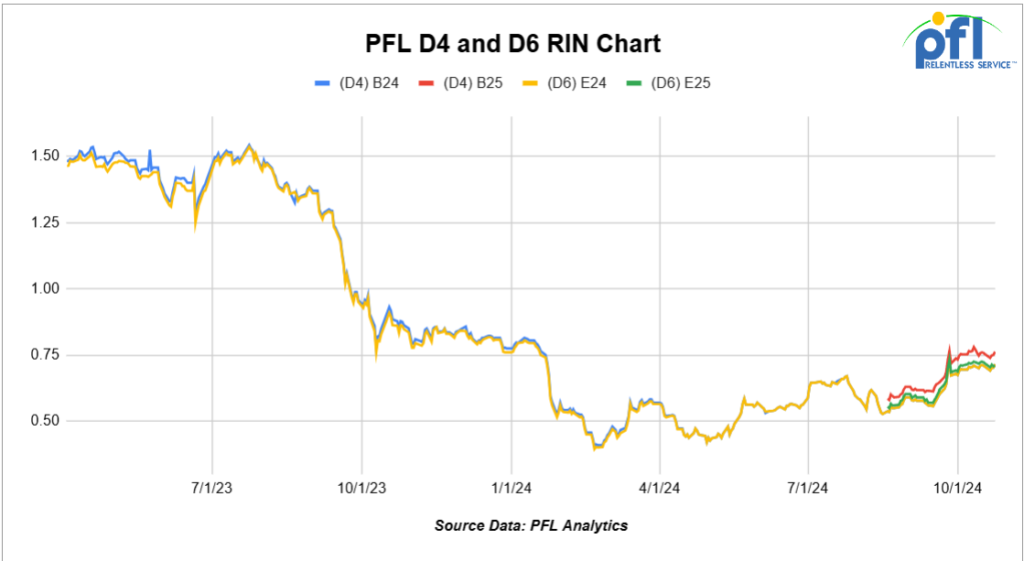
Renewable Credits:
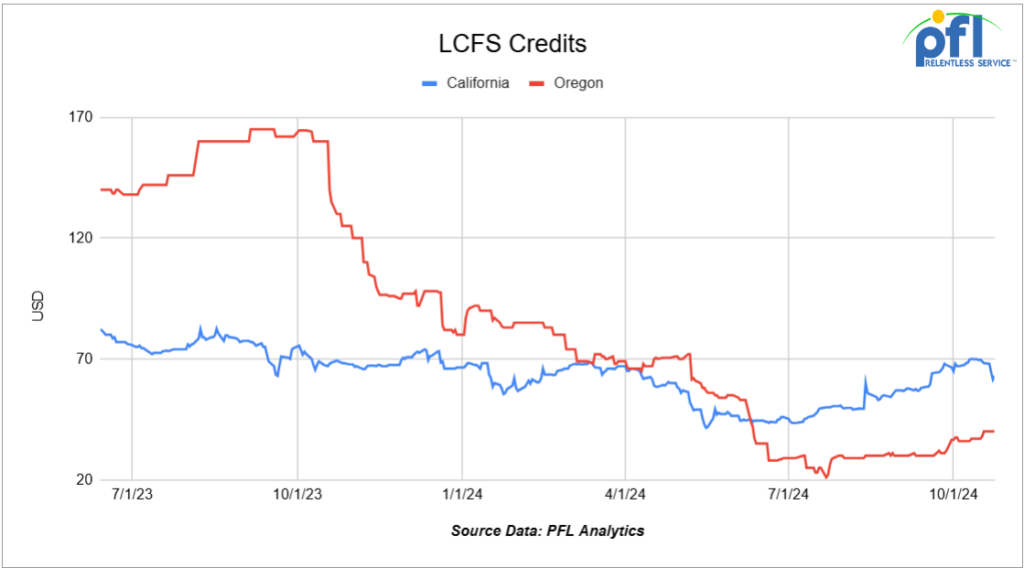
Well folks, RINS and LCFS credits are moving higher from their lows. Why? The current federal administration – the Green New Deal and certain states are causing us to pay more at the pump with no end in sight with the green agenda. In a busy end to the week last week in RINS, D4 RINS closed out the day on Friday, of last week, at 70 cents per RIN, down 1 and ½ cents per RIN day over day, but no change per RIN week over week. Meanwhile, D6 RINS also closed at 70 cents per RIN, down 1 and ½ cents per RIN day over day, but no change week over week. LCFS credits in California, in a semi-active session, closed out the day, and the week, at $63.00 per MT, down $1.00 per MT day over day, and down $5.00 per MT week over week. See below PFL charts:
Government Handouts For The Green New Deal
They keep coming at a rampant pace. Last week alone, every American (not taxpayer) dished out roughly $5 per person in loan guarantees and grants that we know about for the fast-tracking of certain projects ahead of the November 5th election.
Lease Bids
- 100, 5200 Covered Hoppers needed off of UP or BN in Northwest for 6 month. Cars are needed for use in Pet Coke service. Roud Hatch, Bottom Outlet Doors
- 10, 5250 Covered Hoppers needed off of UP or BN in Midwest for up to 5 years. Cars are needed for use in Dry Edible Beans service.
- 10, 2500CF Open Top Hoppers needed off of UP or BN in Texas for 5 years. Cars are needed for use in aggregate service. Need Rapid Discharge Doors
- 25, 3230 PD Hoppers needed off of NS or CSX in Ohio for 5 years. Cars are needed for use in Flyash service.
- 30, 4750-5200 Covered Hoppers needed off of BN or UP in Lake Charles, LA for 5 Years. Cars are needed for use in Pet Coke service.
- 50, 28.3K DOT 111 Tanks needed off of Any Class 1 in any location for 3-7 Years. Cars are needed for use in Base Oils service.
- 20, 25.5k CPC 1232 Tanks needed off of UP or BN in OK, TX for 3 Year. Cars are needed for use in Asphalt service.
- 10, 30K 117R or 117J Tanks needed off of Any Class 1 in USA for 1 year. Cars are needed for use in Glycerin service.
- 15-20, 29K 117R Tanks needed off of NS or CSX in Ohio for 6-12 Months. Cars are needed for use in Ply Oil service.
- 30-50, 23.5K Any Type Tanks needed off of any class 1 in any location for 1-5Years. Cars are needed for use in Glycols service.
- 50, 23.5-25.5 DOT111 Tanks needed off of Any Class 1 in USA for 5 years. Cars are needed for use in Asphalt service.
- 10, Any Size Stainless Steel DOT111 Tanks needed off of UP or BN in TX for 1-5 Years. Cars are needed for use in Refined Prodcuts service.
- 10, 25.5K-29K 117R Tanks needed off of CSX or NS in Southeast for 6 Months. Cars are needed for use in Crude service. Needed in Jan
Sales Bids
- 100-150, 3400CF Covered Hoppers needed off of UP BN in Texas. Cars are needed for use in Cement service. Cement Gates needed.
- 20, 17K DOT111 Tanks needed off of various class 1s in various locations. Cars are needed for use in corn syrup service.
- 4, 25.5K DOT 111 Tanks needed off of any class 1 in Texas.
- 10, 30K DOT 111 Tanks needed off of any class 1 in Texas. Cars are needed for use in UCO service.
- 10, 5600CF PD Hoppers needed off of any class 1 in Texas.
- 50, 4750CF Covered Hoppers needed off of any class 1 in Texas. Cars are needed for use in Grain service.
Lease Offers
- 50, 5400, Covered Hoppers located off of NS, IORY in MI. Cars were last used in bean meal. 1 year+
- 90, 25.5K, DOT 111 Tanks located off of UP in Texas. Cars were last used in Fuel OIl. 2-3 Year Term
- 50, 28.3K, 117R Tanks located off of All Class 1s in St. Louis. Cars are clean 1 Year Term
- 15-20, 29.2K, AAR211 Tanks located off of UP or BN in Houston. Cars were last used in Veg Oil. Up to 1 year
- 30, 33K, 340W Pressure Tanks located off of CN or CP in Edmonton. Cars were last used in Propane/Butane. Winter Lease
Sales Offers
- 100-300, 3400, Covered Hoppers located off of various class 1s in multiple locations. Sand Cars
- 150, 28.3K, DOT117J Tanks located off of various class 1s in multiple locations. Will take 90K
- 300, 31.8K, CPC 1232 Tanks located off of BN in Texas.
- 40, 33K, 340W Pressure Tanks located off of Multiple in All over. 10 Year old; Reqaul in 2034
- 50, 17K, DOT 111 Tanks located off of Multiple in All over.
Call PFL today to discuss your needs and our availability and market reach. Whether you are looking to lease cars, lease out cars, buy cars, or sell cars call PFL today at 239-390-2885
Live Railcar Markets
| CAT | Type | Capacity | GRL | QTY | LOC | Class | Prev. Use | Offer | Note |
|---|
PFL will be at the Following Conferences

- Where: La Quinta, CA
- Attending: David Cohen (954-729-4774)
- Conference Website

- Where: Hyatt Regency Dallas in Dallas, TX
- Attending:Curtis Chandler (239.405.3365), David Cohen (954-729-4774), Brian Baker (239.297.4519), Cyndi Popov(403) 402-5043
- Conference Website