
“Most of the important things in the world have been accomplished by people who have kept on trying when there seemed no help at all.”
– Dale Carnegie
“One of the tests of leadership is the ability to recognize a problem before it becomes an emergency.”
– Arnold H. Glasow
Jobs Update
Initial and Continuing Jobless Claims
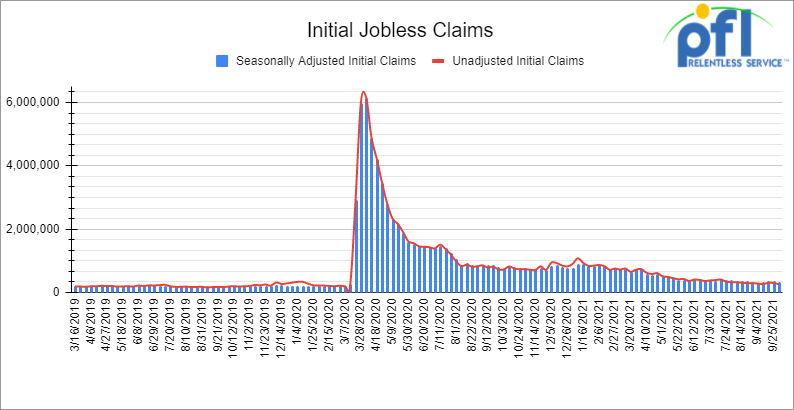
- Initial jobless claims for the week ending October 2nd came in at 326,000, down 38,000 people week over week.
- Continuing claims came in at 2.714 million people versus the adjusted number of 2.811 million people from the week prior, down 97,000 people week over week.
Source Data: U.S. Employment and Training Administration – PFL Analytics
Unemployment Rate Down Month over Month but did not meet Expectations
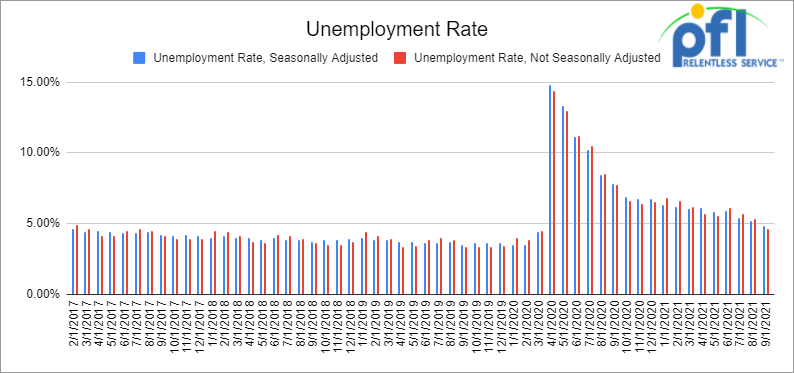
- The Bureau of Labor Statistics (BLS) announced on Friday of last week that a preliminary and seasonally adjusted 194,000 net new jobs were created in September 2021, far below what the expected 500,000 job gains.
- Job gains in August 2021 were revised up to 366,000 from the 235,000 announced last month.
- Private-sector jobs rose by 317,000 and government jobs fell by 123,000 in September.
- September’s numbers included 56,000 new jobs in retail trade, 47,000 in transportation and warehousing, 29,000 in food services, 26,000 in manufacturing, and 22,000 in construction.
- In September, the official unemployment rate fell to 4.8%, down from 5.2% in August and the lowest it’s been since March 2020
- U.S. firms had a record-high 10.9 million job openings, including 889,000 in manufacturing and 1.9 million in trade and transportation. There’s clearly a huge disconnect right now between labor supply and labor demand. Let’s get back to work America!
Source Data: US Bureau of Labor Statistics – PFL Analytics
Stocks closed lower on Friday of last week, but higher week over week
The DOW closed lower on Friday of last week, down -8.69 points (-0.03%) closing out the week at 34,746.25 points, up 419.76 points week over week. The S&P 500 closed lower on Friday of last week, down -8.42 points and closed out the week at 4,391.34, up 34.3 points week over week. The Nasdaq closed lower on Friday of last week, down -74.48 points (-0.51%) and closed out the week at 14,579.54, up 12.84 points week over week.
In overnight trading, DOW futures in overnight trading, DOW futures traded lower and are expected to open at 34,527 this morning down -99 points.
Oil up on Friday of last week and up week over week
Crude futures climbed Friday despite the release of a disappointing US jobs report which caused the dollar index to tumble. Gains were extended after the US reportedly said it had no immediate plans to release oil from its strategic petroleum reserve to soften prices.
West Texas Intermediate (WTI) crude closed up $1.05 (+1.34%) per barrel on Friday of last week, to settle at $79.35, up $3.47 per barrel week over week. Brent futures closed up 44 cents (+0.5%), to settle at $82.39 per barrel up $3.11 per barrel week over week.
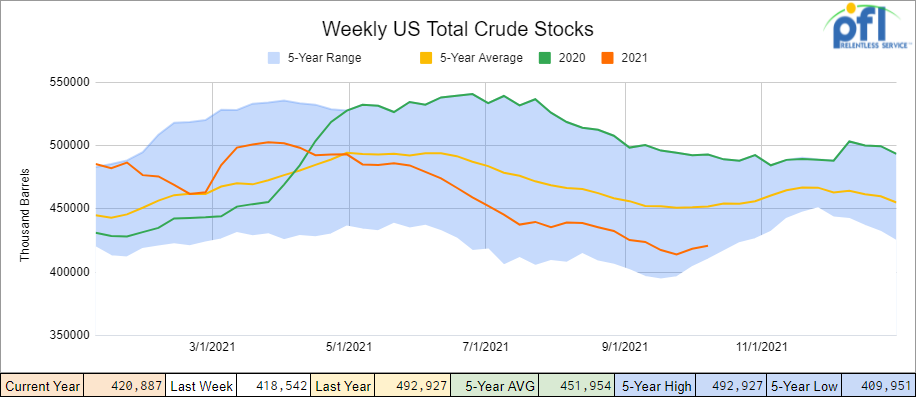
U.S. commercial crude oil inventories (excluding those in the Strategic Petroleum Reserve) increased by 2.3 million barrels from the previous week. At 420.9 million barrels, U.S. crude oil inventories are 7% below the five year average for this time of year.
Source Data: EIA – PFL Analytics
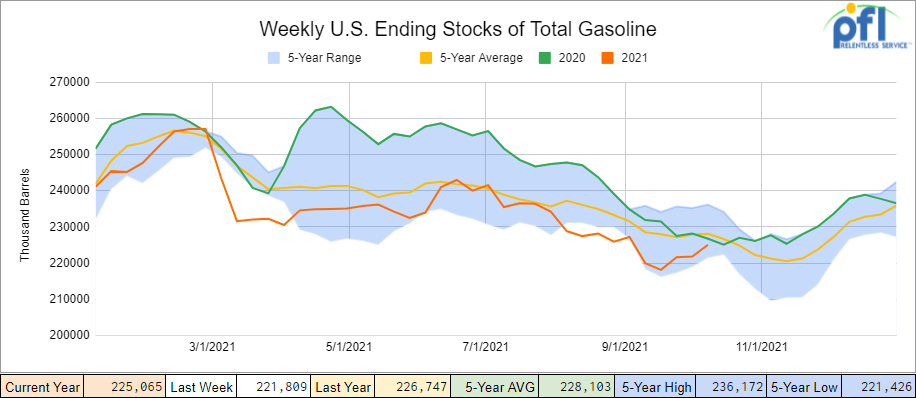
Total motor gasoline inventories increased by 3.3 million barrels week over week and are 1% below the five year average for this time of year
Source Data: EIA – PFL Analytics
Distillate fuel inventories decreased by 0.4 million barrels week over week and are 11% below the five year average for this time of year.
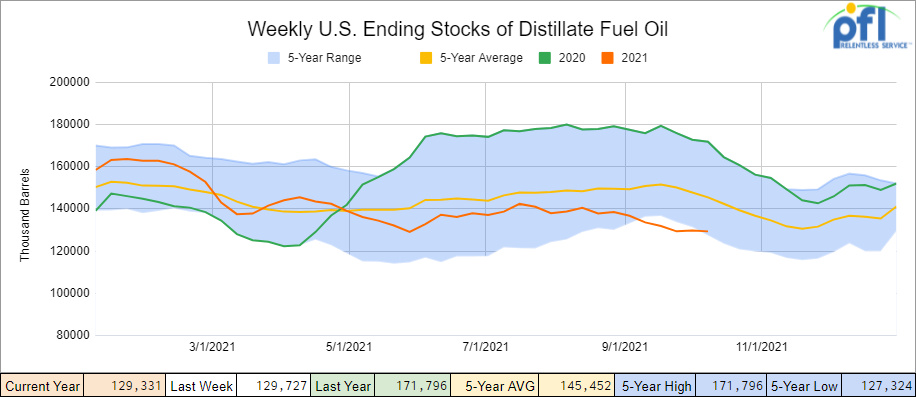
Source Data: EIA – PFL Analytics
Propane/propylene inventories decreased by 600,000 barrels week over week and are 20% below the five year average for this time of year.
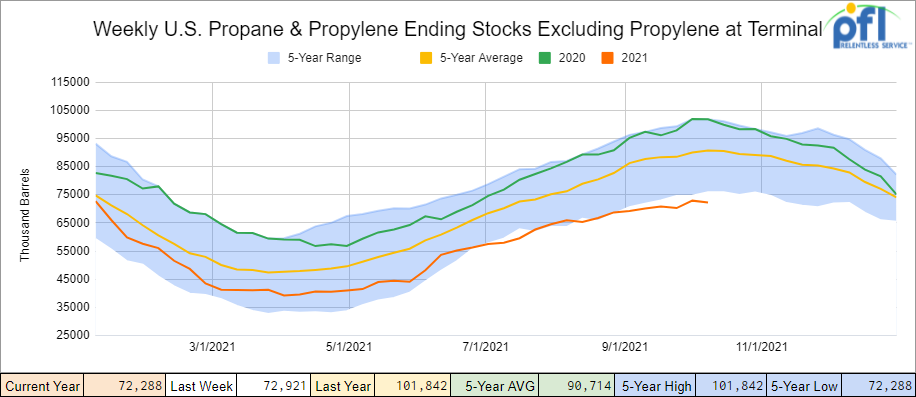
Source Data: EIA – PFL Analytics
Folk’s propane prices continue to move higher week over week closing at $1.43 per gallon up 10 cents per gallon. We are starting to see early signs of potential demand destruction for LNG and LPG’s, particularly in Europe and Asia. Prices have simply moved high very quickly and people and governments are going to get creative. Not to say we will not test these levels again but it is our feeling we are due for a pullback at some point in time in the not so distant future.
Take China with coal. The government of northern Chinese region of Inner Mongolia, one of the country’s top coal producers, told 72 mines to boost production immediately that could add 99.25 million tons of annual output. China is also releasing Australian coal from bonded storage, despite a nearly year-long unofficial import ban on Australia China is scrambling to ease a national power crunch stemming from a coal shortage. The power crisis in China which is the top consumer of coal comes at a time where strong demand from its manufacturers, industry and households has pushed power prices and inputs to record highs and triggered widespread power curbs. One million tons of Australian coal is sitting in Chinese ports. Albeit a drop in the bucket China is transitioning from LNG and LPG’s to coal as quickly as possible. On the flip side an acceleration in gas-to-oil switching could boost crude oil demand used to generate power this coming northern hemisphere winter. In Europe Russia said it could potentially give to Europe 15% more natural gas than it originally intended on giving them. It is going to be all about the weather to see how we get through this one.
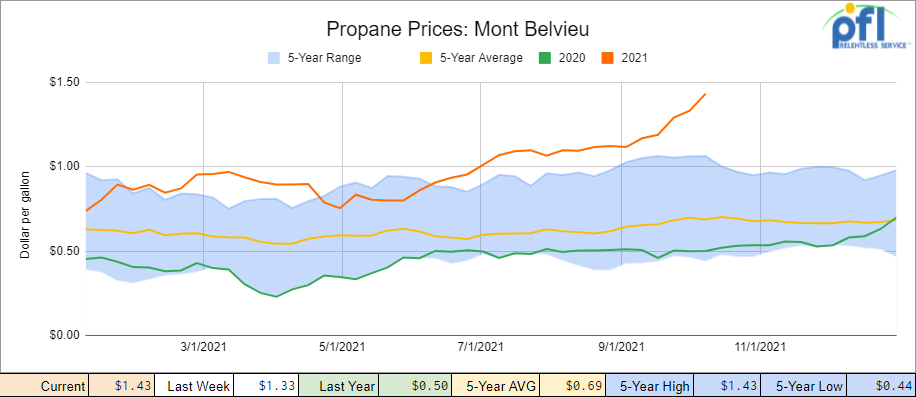
Source Data: EIA – PFL Analytics
Overall total commercial petroleum inventories increased by 800,000 barrels last week.
U.S. crude oil imports averaged 7.0 million barrels per day for the week ending October 1, 2021 , up by 483,000 barrels per day from the previous week. Over the past four weeks, crude oil imports averaged about 6.5 million barrels per day, 22.7% more than the same four-week period last year. Total motor gasoline imports (including both finished gasoline and gasoline blending components) for the week ending October 1, 2021 averaged 1.1 million barrels per day, and distillate fuel imports averaged 298,000 barrels per day. The IEA has said Russia could significantly step up natural gas exports to Europe over the winter period. The agency’s analysis suggests Russia has the capacity for a roughly 15% increase.
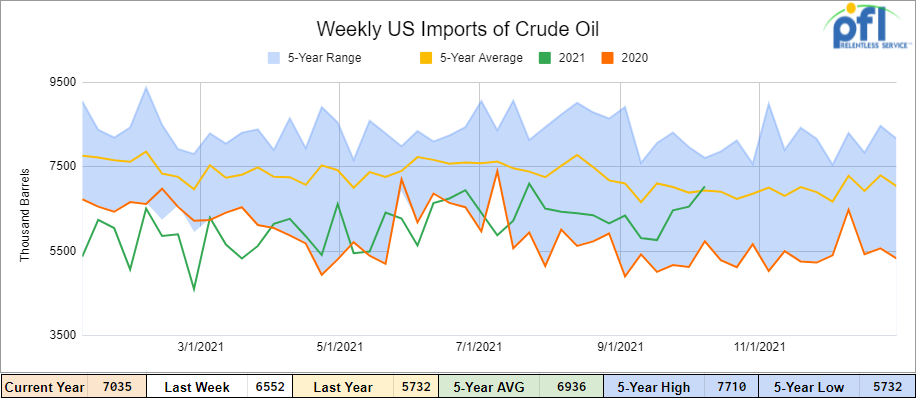
Source Data: EIA – PFL Analytics
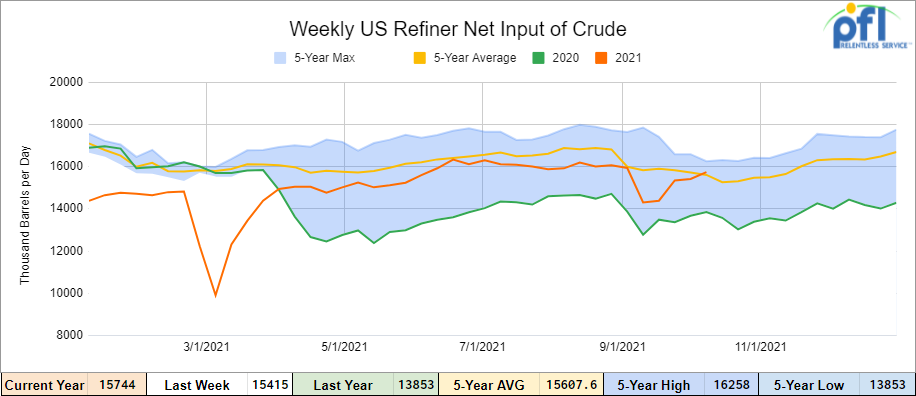
U.S. crude oil refinery inputs averaged 15.7 million barrels per day during the week ending October 1, 2021 which was 330,000 barrels per day more than the previous week’s average. Refineries operated at 89.6% of their operable capacity week over week.
Source Data: EIA – PFL Analytics
Oil is lower in overnight trading and WTI is poised to open down as of the writing of this report, WTI is poised to open at $81.94, down $2.59 per barrel from Friday’s close.
North American Rail Traffic
Total North American rail volumes were down 2.0% year over year in week 39 (U.S. -0.5%, Canada -3.9%, Mexico -15.6%) resulting in 3Q21 volumes that finished down 0.2% year over year and year to date volumes that are up 7.9% year over year (U.S. +9.0%, Canada +5.0%, Mexico +5.3%). 5 of the AAR’s 11 major traffic categories posted year over year decreases with the largest declines coming from intermodal (-6.3%) and motor vehicles & parts (-22.8%). The largest increases came from coal (+13.3%) and metallic ores & metals (+10.1%).
In the East, CSX’s total volumes were down 1.5%, with the largest decrease coming from motor vehicles & parts (-26.0%). The largest increase came from intermodal (+3.3%). NS’s total volumes were up 1.4%, with the largest increase coming from coal (+24.4%). The largest decreases came from intermodal (-3.2%) and motor vehicles & parts (-19.4%).
In the West, BN’s total volumes were down 1.9%, with the largest decreases coming from intermodal (-2.8%) and motor vehicles & parts (-30.9%). The largest increase came from stone sand & gravel (+38.7%). UP’s total volumes were up 1.3%, with the largest increase coming from coal (+39.0%). The largest decrease came from intermodal (-8.3%). In Canada, CN’s total volumes were down 4.9%, with the largest decrease coming from intermodal (-13.8%). The largest increase came from coal (+63.0%). Revenue per ton miles was down 6.9%. CP’s total volumes were up 2.2%, with the largest increase coming from petroleum (+45.8%), and the largest decrease coming from motor vehicles & parts (-51.0%). Revenue per ton miles was up 2.5%.
KCS’s total volumes were down 8.0%, with the largest decrease coming from intermodal (-16.7%) and the largest increase coming from grain (+30.0%).
Source: Stephens
Rig Count
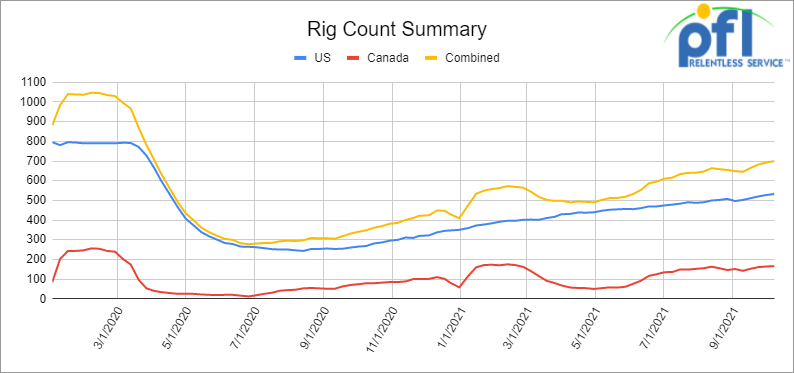
North American rig count is up by 7 rigs week over week. The U.S. rig count was up by 5 rigs week over week and up by 264 rigs year over year. The U.S. currently has 533 active rigs. Canada’s rig count was up by 2 rigs week over week, and up by 87 rigs year over year and Canada’s overall rig count is 167 active rigs. Overall, year over year we are up 351 rigs collectively.
North American Rig Count Summary

Source Data: Baker-Hughes – PFL Analytics
A few things we are keeping an eye on:
Shipping Rates
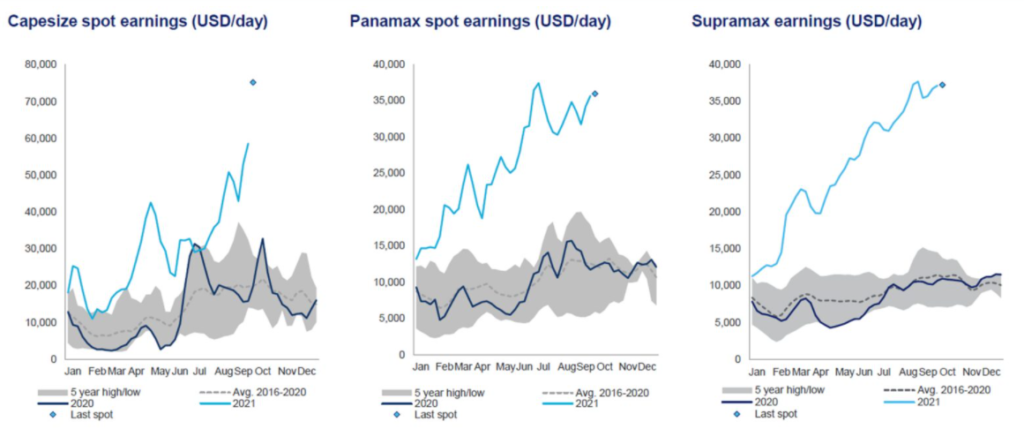
Dry bulk shipping rates hit $80,000 per day as buyers scramble for coal. Yet another sign of stress for energy supplies and global supply chains: Spot rates for large dry cargo ships just topped $80,000 per day for the first time since 2009, and freight derivatives for the fourth quarter — a period when rates for these vessels normally pull back — just spiked. Dry bulk stocks plunged. While spot rates for Capesizes (bulkers with capacity of around 180,000 deadweight tons) held firm at $53,800 per day, forward freight agreement (FFA) derivatives did not. As of Tuesday, spot Capesize rates were up to $80,877 per day, based on the Baltic Exchange 5TC index. That’s 50% higher than two weeks ago. Expect to see coal exports surge to the largest extent possible in future coal by rail numbers and consumption of coal here in the U.S. to continue to climb ahead of the heating season providing some relief to natural gas in the U.S. and elsewhere trickling down to LPG’s. (See Chart)
Source: Clarksons Platou Securities.
Consumer Confidence
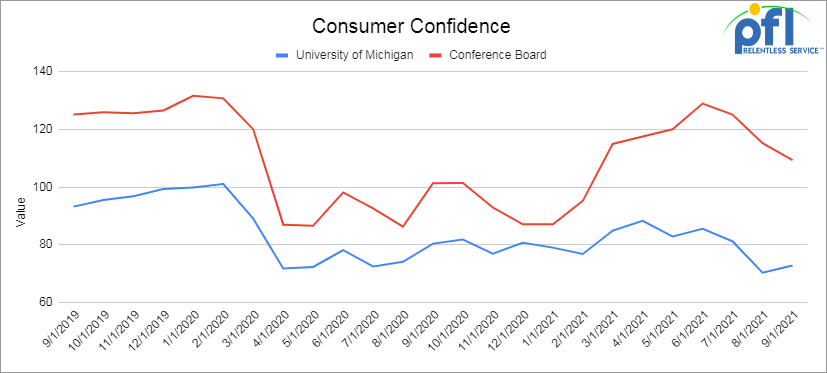
The Conference Board’s index of consumer confidence fell to 109.3 in September from 115.2 in August and 125.1 in July. The threat and spread of the Delta variant played a role in the further decrease in consumer confidence, suggests Lynn Franco, the Senior Director of Economic Indicators at The Conference Board. In a press release, she said, “Concerns about the state of the economy and short-term growth prospects deepened, while spending intentions for homes, autos, and major appliances all retreated again. The Fed said that short-term inflation concerns eased somewhat, but remained elevated (we don’t see it!). Consumer confidence is still high by historical levels… and we think it has a little more to do with just COVID. What about higher taxes, regulation, how we handled Afghanistan, renewed restrictions and other matters – it all adds up. We would expect to see consumer confidence continue to erode if all else remains status quo but it is not too late to turn things around. (see chart)
Source Data: EIA The Conference board – PFL Analytics
GDP
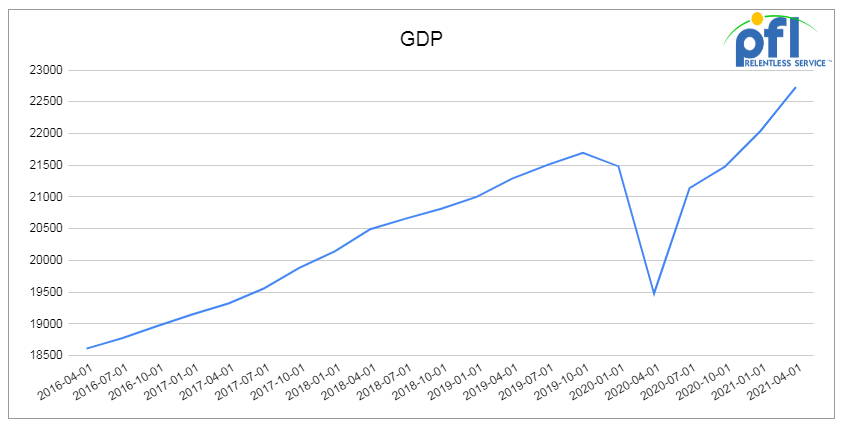
Official U.S. GDP growth in Q2 2021, according to the Bureau of Economic Analysis (BEA), was an annualized 6.7%. It was 6.3% in Q1 2021. The BEA’s first estimate of Q3 2021 growth won’t be released until October 28, but market expectations are that Q3 growth was well below Q1 and Q2.The most recent GDP forecast from the Federal Reserve Bank of Atlanta says Q3 growth was just 1.3%. Many economists have raised their growth forecasts for next year, indicating that some spending and production have been delayed by the Delta surge, rather than lost to it. The Federal Reserve, in its most recent economic projections released on September 22, says GDP will grow 3.8% in 2022. That’s higher than the 3.3% it forecast for 2022 in its June 2021 outlook.
Source: U.S. Bureau of Economic Analysis – PFL Analytics
Consumer Spending
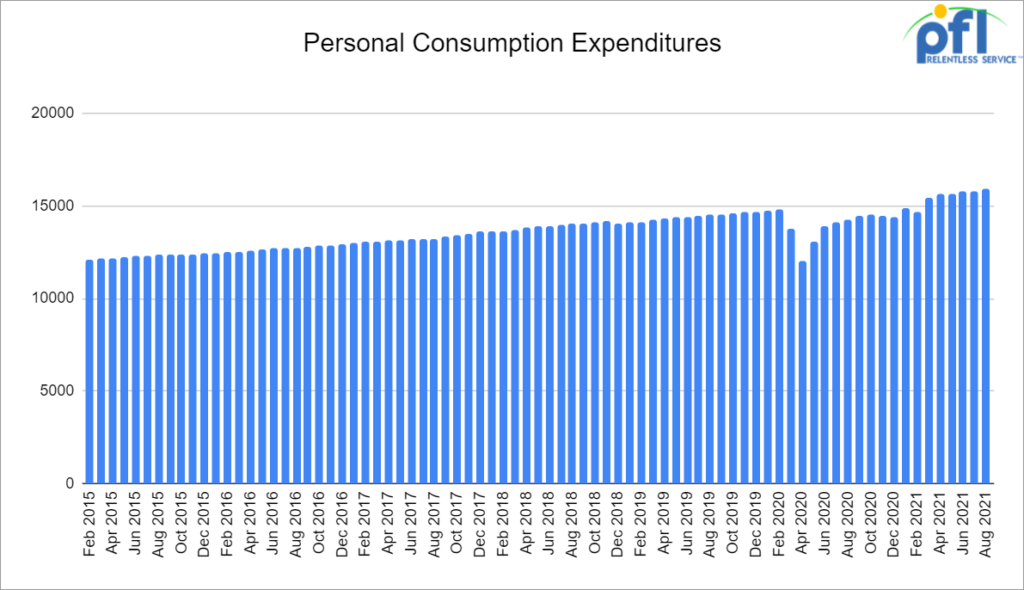
Consumer spending increased a preliminary 0.8% in August, following a revised 0.1% decline in July. The increase in consumer spending is partially a result of consumers having more funds on hand, as personal income increased by 0.2% in August following a 1.1% increase in July. The government child tax credit was distributed in August, contributing to the rise in income alongside increased wages and salaries. Disposable personal income rose $18.9 billion, or 0.1%, in August, from a 1.1% increase in July. Savings as a percentage of disposable income rose in 2020 and early 2021, decreased over the summer, but is still higher than it’s historically been. Spending on goods increased 1.2% in August, in contrast to a 2.1% gain in July. Spending on services rose 0.6% in August, ending five months of consecutive month-to-month gains of at least 1.1%. While consumers are buying more, some products may not be available. Purchases of new cars and trucks fell by 10% last month – a consequence of how ongoing supply-chain problems are keeping dealer lots sparse. Although spending on products like vehicles was down in August, spending on airfare improved, as did spending on entertainment services — signs that consumers are reengaging in leisure activities and business is hitting the road again.
Source: U.S. Bureau of Economic Analysis – PFL Analytics
Industrial output and Capacity Utilization
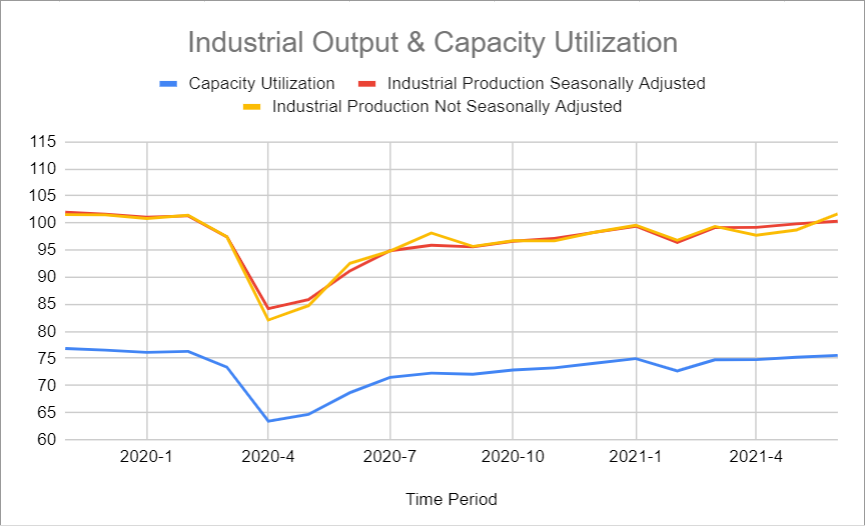
Total U.S. industrial output was up a preliminary and seasonally adjusted 0.4% in August 2021 from July 2021, according to the Federal Reserve. Output has grown sequentially for six straight months. Total output in August 2021 was the highest since December 2019, meaning it’s back above where it was immediately prior to the pandemic. Total output in August 2021 was 5.9% higher than in August 2020; 1.1% lower than in August 2019; and 2.5% lower than in August 2018, which was its most recent peak. The Federal Reserve estimates that late-August shutdowns related to Hurricane Ida held down the gain in industrial production in August by 0.3 percentage points. Manufacturing accounts for around 75% of total output. Manufacturing output was up a preliminary 0.2% in August 2021 from July 2021, following a revised 1.6% gain in July from June. Manufacturing output has alternated good months and not-so-good months for the past eight months. Manufacturing output in August 2021 was the highest since March 2019, but it was still 2.2% below its recent peak in August and September 2018. The Federal Reserve estimates that Hurricane Ida caused manufacturing output in August to be 0.2 percentage points lower than it otherwise would have been, with impacts concentrated in chemical production and petroleum refining. Utility output rose 3.3% in August as unseasonably warm temperatures in much of the country boosted demand for air conditioning. Total capacity utilization in August was a preliminary 76.4%; its most recent peak was 79.9% in August 2018. For just manufacturing, capacity utilization was 76.7% in August, the highest it’s been since January 2019.
Source Data: Federal Reserve – PFL Analytics
We have been extremely busy at PFL with return on lease programs involving rail car storage instead of returning cars to a shop. A quick turnaround is what we all want and need. Railcar storage in general has been extremely active. Please call PFL now at 239-390-2885 if you are looking for rail car storage, want to trouble shoot a return on lease scenario or have storage availability. Whether you are a car owner, lessor or lessee or even a class 1 that wants to help out a customer we are here to “help you help your customer!”
Leasing and Subleasing has been brisk as economic activity picks up. Inquiries have continued to be brisk and strong Call PFL Today for all your rail car needs 239-390-2885
PFL is seeking:
- 30, 29k coiled and insulated CPC1232s for use in biodiesel. Can be dirty with biodiesel, diesel or renewable diesel. Needed for one year.
- 100, 400W pressure cars for Propylene service. Preferred dirty to dirty for one year.
- 10-20 propane cars needed for a short term lease in ND off the CP.
- 30-50 340 Pressure cars for propane starting Nov 3 month lease in Alberta CP or CN
- 70-90 Biodiesel cars C&I any type car in the midwest or TX 1-2 years
- 100 15K Tanks 286 for Molten Sulfur in the Northeast CSX/NS for 6 months negotiable
- 200 117Js 28.3 C&I 286 in the North on the CN for 1 year Crude dirty to dirty Negotiable
- 70, 5150 Covered Hoppers needed in the Midwest for 3 Month starting October. Any class one
- 20 5650 PD Hoppers 286s needed in Montana for talc BNSF for 3-5 years
- 100 Open Top Hoppers needed in the Midwest for coal BNSF 1 year
- 100, 5800 Covered Hoppers 286 can be West or East for Plastic 3-5 years
- 50-100, 4750 Covered Hoppers needed for Pet-coke. Can take in the South.
- 70, 117R or J needed for Ethanol for 3 years. Can take in the South.
- 30, 25.5’s or greater food grade Kosher veg oil cars for 6-12 months
- 50, 6500+ cu-ft Mill Gon or Open Top Hopper for wood chips in the Southeast for 5 Years.
- 25 bulkhead flats 286 any class one for up to 5 years Negotiable
- 10 open top hoppers 2400 C FT in Texas needed for stone on the UP 3-5 years
- 20, 19,000 Gal Stainless cars in Louisiana UP for nitric acid 1-3 years – Oct negotiable
- 10, 6,300CF or greater covered hoppers are needed in the Midwest.
- 15-25, 20K 23.5K cars for chem needed in the South for 1 Year
- 2, 89’ Flat cars for purchase or lease – needed in TX off the BNSF
- 100 Moulton Sulfur cars for purchase – any location – negotiable
- 10 DOT111 or 1232 25.5K 286 GRL for Crude Glycerin anywhere in US 1 year lease
- 12 Plate F 286 GRL Boxcars 12’ plug doors midwest preferred for 1 year lease
PFL is offering:
- Various tank cars for lease with dirty to dirty service including, nitric acid, gasoline, diesel, crude oil, Lease terms negotiable, clean service also available in various tanks and locations including Rs 111s, and Js – Selection is Dwindling. Call Today!
- 200 Clean C/I 25.5K 117J in Texas. Brand New Cars!
- 34 Clean C/I 25.5K CPC 1232’s located in PA.
- 200 117Js 29K OK and TX Clean and brand new – Lined- lease negotiable
- 142 111’s Clean last in gasoline in Texas for lease off the UP – negotiable
- 200 plus 4750 Covered Hoppers 263s off the CN For Sale
- 100 117Rs dirty last in Gasoline in Texas for lease Negotiable
- 20 117R 30K plus tanks for ethanol in Wisconsin off the CN Negotiable
- 90 117Rs 30K located in Alberta CN or CP Refined Products Dirty – negotiable
- 37 BRAND NEW 5161 Sugar Hoppers in Arkansas UP – negotiable
- 99 340W Pressure Cars various locations Butane and Propane dirty negotiable
- 100 73 ft 286 GRL riser less deck, center part for sale,
- 19 auto-max II automobile carrier racks – tri-49 for sale – negotiable
- 10 food grade stainless steel cars
- 20 20K Stainless cars in 3 locations in the south – negotiable
- 30 CPC 1232 25.5K C/I Pennsylvania NS clean negotiable
- 100-150 29K C/I 117J cars for lease. Dirty in Bakken crude and can be returned dirty.
- 100 29K C/I 1232 cars for lease. Dirty in Heavy Crude and can be returned dirty.
- 100 117Rs 29K clean last used in crude Washington State – price negotiable sale or lease
- 21 111s 29K tanks last in alcohol dirty on the CN in Wisconsin for lease price negotiable
- 100 111s of various volumes and locations last in fuel oil dirty price negotiable
- Various Hoppers for sale and lease 3000-5800 CF 263 and 286 multiple locations negotiable
- 45 Boxcars 60ft Plate F’s Located in Tenn CSX – Lease Negotiable
- 28 20K Veg oil cars for lease in Arkansas – Negotiable
- 100 3200 Covered Hoppers for sale price negotiable
- 100 Center beam Flats with risers 73ft in SD and Iowa for sale negotiable
Call PFL today to discuss your needs and our availability and market reach. Whether you are looking to lease cars, lease out cars, buy cars or sell cars call PFL today 239-390-2885
PFL offers turn-key solutions to maximize your profitability. Our goal is to provide a win/win scenario for all and we can handle virtually all of your railcar needs. Whether it’s loaded storage, empty storage, subleasing or leasing excess cars, filling orders for cars wanted, mobile railcar cleaning, blasting, mobile railcar repair, or scrapping at strategic partner sites, PFL will do its best to assist you. PFL also assists fleets and lessors with leases and sales and offer Total Fleet Evaluation Services. We will analyze your current leases, storage, and company objectives to draw up a plan of action. We will save Lessor and Lessee the headache and aggravation of navigating through this rapidly changing landscape.
PFL IS READY TO CLEAN CARS TODAY ON A MOBILE BASIS WE ARE CURRENTLY IN EAST TEXAS
Live Railcar Markets
| CAT | Type | Capacity | GRL | QTY | LOC | Class | Prev. Use | Clean | Offer | Note |
|---|
