
“Iron rusts from disuse; water loses its purity from stagnation… even so does inaction sap the vigor of the mind.” -Leonardo da Vinci
Jobs Update
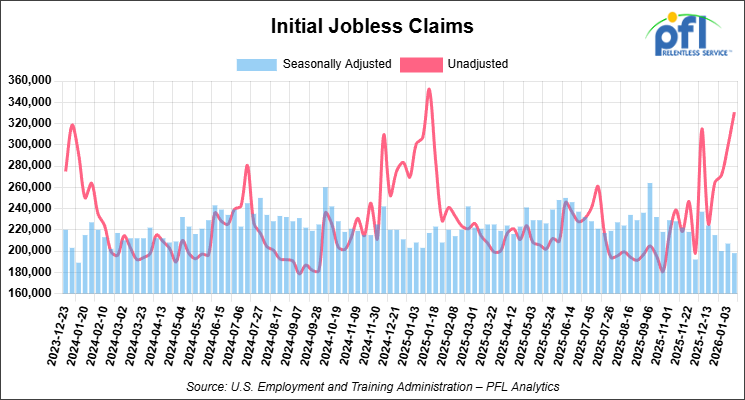
- Initial jobless claims seasonally adjusted for the week ending January 10, 2026 came in at 198,000, versus the adjusted number of 207,000 people from the week prior, down 9,000 people week over week.
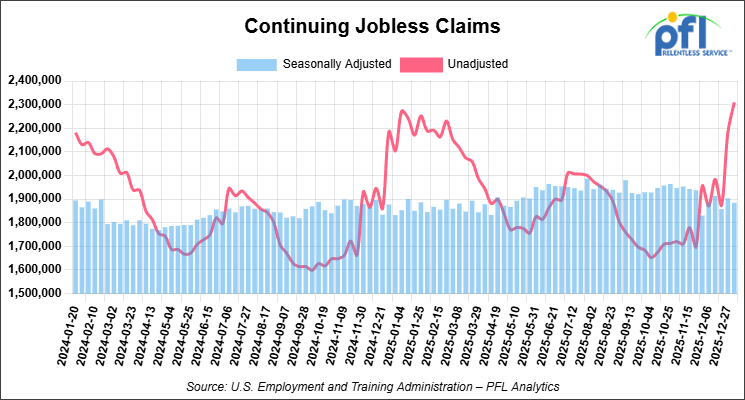
- Continuing jobless claims came in at 1,884,000, versus the adjusted number of 1,903,000 people from the week prior, down 19,000 week-over-week.
Stocks closed lower on Friday of last week and lower week-over-week
The DOW closed lower on Friday of last week, down -83.11 points (-0.17%), closing out the week at 49,359.33, down -144.74 points week-over-week. The S&P 500 closed lower on Friday of last week, down -4.46 points (-0.06%), and closed out the week at 6,940.01, down -26.27 points week-over-week. The NASDAQ closed lower on Friday of last week, down -14.63 points (-0.06%), and closed out the week at 23,515.39, down -155.96 points week-over-week.
In overnight trading, DOW futures traded higher and are expected to open at 48,841 this morning, down -706 points from Friday’s close.
Crude oil closed higher on Friday of last week and higher week-over-week
West Texas Intermediate (WTI) crude closed up 25 cents per barrel (0.4%), to close at $59.44 on Friday of last week, and up $0.32 week-over-week. Brent crude closed up 37 cents per barrel (0.6%), to close at $64.13, and up 79 cents week-over-week.
On a side note, the U.S. Energy Information Administration projected last week that WTI will average $52 per barrel in 2026 and $50 per barrel in 2027, down from $65 per barrel in 2025, as global crude surplus persists. Brent is forecast at $56 per barrel in 2026 and $54 per barrel in 2027. As global oil inventories continue to swell.
U.S. crude production is forecast to hold steady at 13.6 million bpd in 2026 before declining to 13.3 million bpd in 2027. Lower prices also compress netbacks for crude-by-rail movements, as transportation costs consume a larger share of realized pricing.
One Exchange WCS (Western Canadian Select) for February delivery settled on Friday of last week at US$14.20 below the WTI-CMA (West Texas Intermediate – Calendar Month Average). The implied value was US$44.83 per barrel.
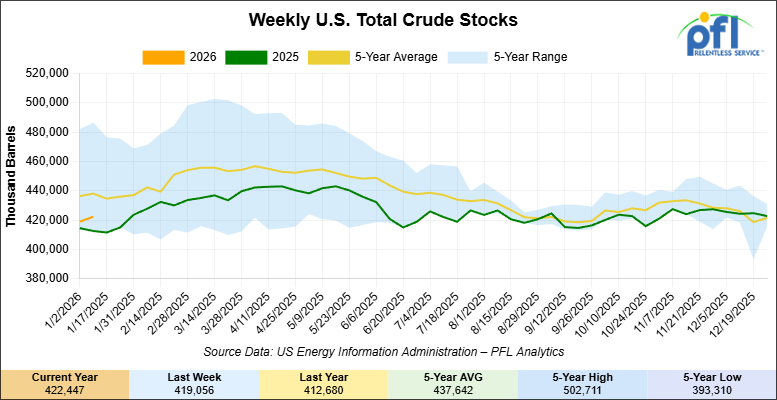
U.S. commercial crude oil inventories (excluding those in the Strategic Petroleum Reserve) increased by 3.4 million barrels week-over-week. At 422.4 million barrels, U.S. crude oil inventories are 3% below the five-year average for this time of year.
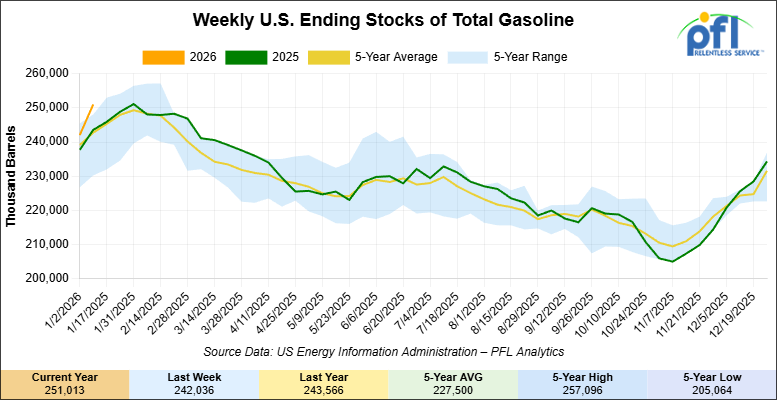
Total motor gasoline inventories increased by 9 million barrels week-over-week and are 4% above the five-year average for this time of year.
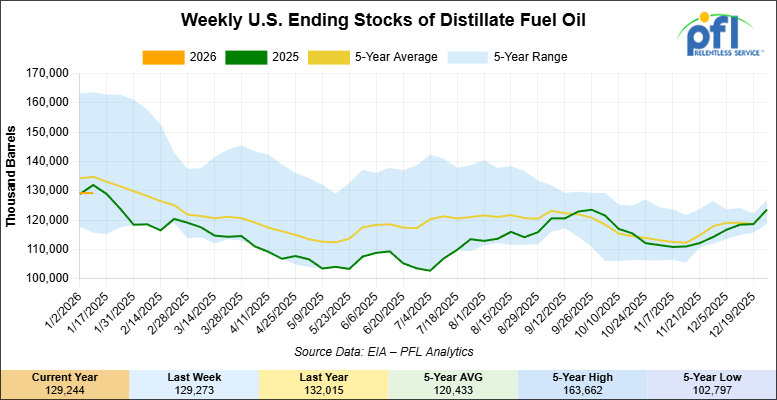
Distillate fuel inventories slightly decreased week-over-week and are 4% below the five-year average for this time of year.
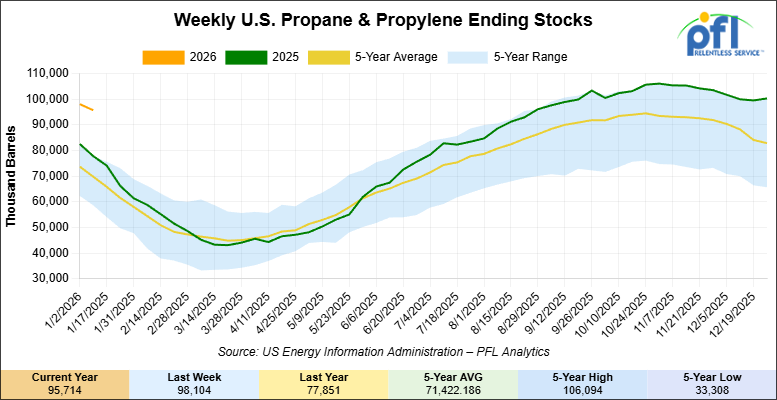
Propane/propylene inventories decreased 2.4 million barrels week-over-week and are 33% above the five-year average for this time of year.
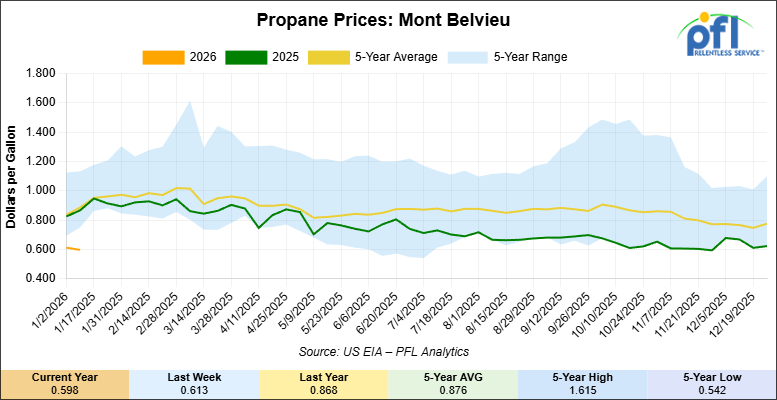
Propane prices closed at 59.8 cents per gallon on Friday of last week, down 1.5 cents per gallon week-over-week, and down 27 cents per gallon year-over-year.
Overall, total commercial petroleum inventories increased by 6.2 million barrels week-over-week, during the week ending January 9, 2026.
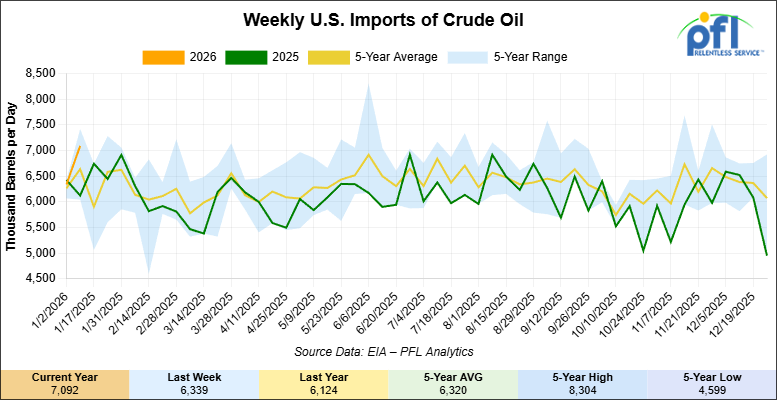
U.S. crude oil imports averaged 7.1 million barrels per day last week, an increase of 752,000 barrels per day week-over-week. Over the past four weeks, crude oil imports averaged 6.1 million barrels per day, 5.7% less than the same four-week period last year. Total motor gasoline imports (including both finished gasoline and gasoline blending components) averaged 448,000 barrels per day, and distillate fuel imports averaged 220,000 barrels per day, during the week ending January 9, 2026.
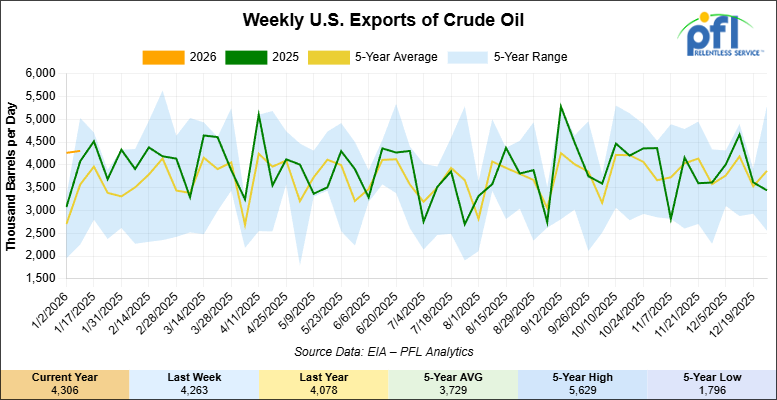
U.S. crude oil exports averaged 4.306 million barrels per day during the week ending January 9, 2026, an increase of 43,000 barrels per day week-over-week. Over the past four weeks, crude oil exports averaged 3.906 million barrels per day.
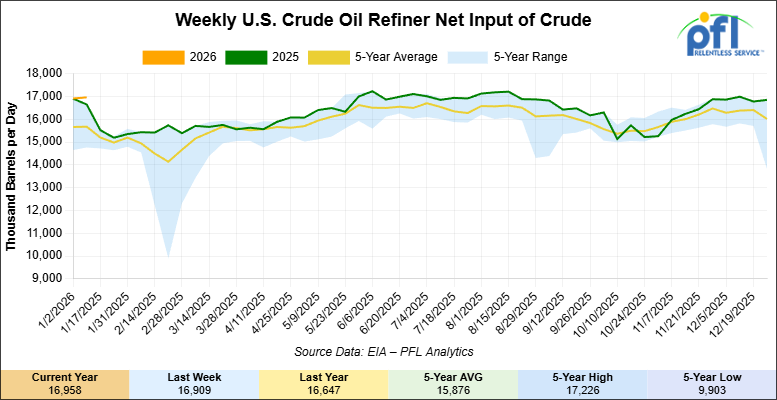
U.S. crude oil refinery inputs averaged 17 million barrels per day during the week ending January 9, 2026, which was 48,000 barrels per day more week-over-week.
WTI futures are poised to open at $59.51, up 17 cents from Friday’s close.
North American Rail Traffic
Week Ending January 14, 2026:
Total North American weekly rail volumes were up (+5.03%) in week 3, compared with the same week last year. Total Carloads for the week ending January 14, 2026 were 319,058, up (+8.75%) compared with the same week in 2024, while weekly Intermodal volume was 324,384, up (+1.62%) year over year. 3 of the AAR’s 11 major traffic categories posted year-over-year decreases. The largest decrease came from Forest Products (-19.30%), while the largest increase was Coal (+32.31%).
In the East, CSX’s total volumes were up (+11.11%), with the largest decrease coming from Metallic Ores and Metals (-14.32%), while the largest increase came from Nonmetallic Minerals (+31.07%). NS’s total volumes were up (+11.10%), with the largest increase coming from Coal (+35.21%), while the largest decrease came from Grain (-8.17%).
In the West, BNSF’s total volumes were up (+6.14%), with the largest increase coming from Coal (+26.07%), while the largest decrease came from Forest Products (-20.30%). UP’s total volumes were up (+3.13%), with the largest increase coming from Grain (+50.66%), while the largest decrease came from Motor Vehicles and Parts (-29.70%).
In Canada, CN’s total volumes were down (-4.13%), with the largest increase coming from Other (+65.18%), while the largest decrease came from Nonmetallic Minerals (-20.61%). CPKCS’s total volumes were down (-19.93%), with the largest increase coming from Nonmetallic Minerals (+39.53%), while the largest decrease came from Forest Products (-67.06%).
Source Data: AAR – PFL Analytics
North American Rig Count Summary
Rig Count
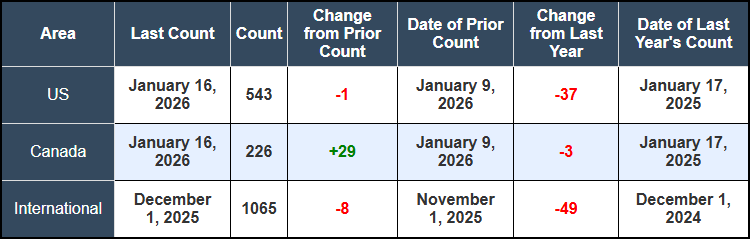
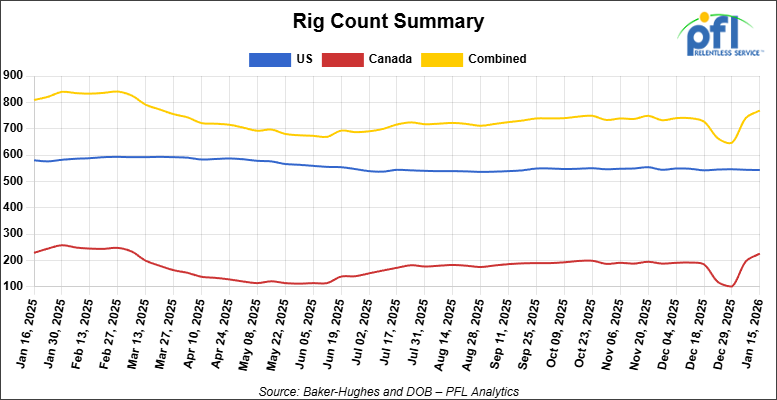
North American rig count was up by +28 rigs week-over-week. The U.S. rig count was down by -1 rig week-over-week, and down by -37 rigs year-over-year. The U.S. currently has 543 active rigs. Canada’s rig count was up by +29 rigs week-over-week, but down by -3 rigs year-over-year. Canada currently has 226 active rigs. Overall, year-over-year we are down by -40 rigs collectively.
We are watching a few things out there for you:
We are Watching Iran
Folks, last week was a volatile and unpredictable week. Large-scale protests in Iran have persisted for three weeks now, and last week was no different, raising supply disruption concerns for a country producing 3.3 million barrels per day. Call skew in crude options hit its highest level since June, with Brent trading above $64/barrel and WTI rallying to early November highs. Bloomberg, however, estimates that only a modest war premium of around $4 per barrel is currently built into prices.
President Trump announced a 25% tariff on goods from countries doing business with Iran, taking effect January 12. Trump stated on Friday of last week that Tehran’s response was subsiding and indicated he was considering “very strong options” for assistance to protesters and is positioning military assets from the China Sea to the Middle East.
Approximately 20% of global oil and LNG shipments transit the Strait of Hormuz, which Iran could theoretically disrupt, though analysts assess extended closure as unlikely given Iran’s dependence on oil export revenue and international security forces.
We are Watching Petroleum Carloads
The four-week rolling average of petroleum carloads carried on the six largest North American railroads rose to 28,731 from 28,391, which was an increase of +340 rail cars week-over-week. Canadian volumes were higher. CPKC’s shipments were higher by +10.0% week-over-week, CN’s volumes were higher by +17.0% week-over-week. U.S. shipments were mixed. The BN had the largest percentage increase and was up by +16.0%. The NS had the largest percentage decrease and was down by -10.0%.
The Canadian strength came despite widening price spreads that typically discourage long-haul crude-by-rail movements. Western Canada Select closed at a $14.20 discount to WTI more than $1.00 wider month over month. CIBC analysts forecast the WCS discount will average -$14.25 in 2026 versus -$11.30 in 2025, driven largely by Venezuelan crude competing for U.S. Gulf coast refinery demand.
More Canadian crude-by-rail volumes seem to be flowing to domestic refineries or shorter-haul destinations rather than long-haul U.S. Gulf coast movements, which have become less economical. The U.S. finalized its first $500 million sale of Venezuelan crude last week. Venezuelan crude production is expected to recover to 1.5 million barrels per day by mid-2026, up from 800,000 barrels per day currently. Texas refiners imported an average of 392,000 barrels per day from Canada between January-October 2025, but Venezuelan heavy crude entering the Gulf coast threatens to displace meaningful Canadian volumes and erode crude-by-rail demand on southbound routes.
We are Watching Trans Mountain
Waterborne crude exports from the Trans Mountain pipeline system fell to 467,000 barrels per day in December, the lowest level since August, signaling softer demand for Canadian heavy crude in Asia-Pacific markets. Heavy crude loadings accounted for 423,000 bpd. China remained the largest destination at 356,000 bpd, down 20% from November.
The decline reflected competitive pricing pressures from rival crudes and the absence of major buyer Yulong, which was sanctioned by the UK and EU in mid-December. Weaker TMX pipeline utilization typically correlates with stronger crude-by-rail demand as producers seek alternative takeaway capacity. However, the concurrent widening of WCS discounts suggests the issue is demand-side rather than pipeline capacity constraints, limiting the spillover benefit to rail.
Alberta Premier Danielle Smith announced last week that the province intends to submit a proposal for a 1 million bpd bitumen pipeline to northwest British Columbia by June 2026, with federal approval targeted within six months. Smith explicitly framed the urgency: “to avoid losing market share to Venezuela”. If constructed, the pipeline would further reduce long-term crude-by-rail demand from Western Canada by adding significant incremental pipeline capacity to Pacific tidewater. Construction could begin as early as 2029 if approval is granted by mid-2028. We are beginning to question the urgency of a new pipeline out to the west coast as a matter of urgency when we are having trouble filling Transmountain right now – hopefully demand will pick up soon!!!
We are Watching Enbridge
Enbridge announced construction on its 150,000 bpd Mainline expansion could begin as early as July 2026, with completion now forecast for December 2027. The project will increase Line 93 capacity from Hardisty to Superior from 760,000 barrels per day to 837,000 barrels per day using drag-reducing agents rather than new pipeline construction.
Enbridge’s mainline apportionment—the percentage by which crude nominations exceed available pipeline capacity—has remained elevated despite optimization efforts. The 150,000 barrel per day expansion, combined with Alberta’s proposed 1 million bpd Pacific pipeline, would add meaningful incremental pipeline capacity over the 2027-2030 period, likely keeping structural demand muted for crude-by-rail in Western Canada. Crude by rail out of Canada will always be needed for stranded barrels and raw bitumen (no diluent added), which can move as a non hazard product.
We are Watching Left Wing Carney
Left-wing Prime Minister Mark Carney announced a landmark trade agreement with China last Friday that could fundamentally alter North American rail traffic flows over the coming decade. The deal reduces Canada’s 100% tariff on Chinese electric vehicles to 6.1% for an initial quota of 49,000 vehicles annually, rising to approximately 70,000 over five years, while China slashes tariffs on Canadian canola from 84% to 15% and eliminates 100% tariffs on canola meal.
For railroads, the agreement has three critical implications. First, the canola tariff relief should support stronger Canadian grain carload volumes to Pacific ports as China resumes large-scale purchases. Canola represents one of the largest export grain commodities by rail in Western Canada, and the 84% Chinese tariff had sharply curtailed demand since 2024. Second, the deal establishes a ministerial energy dialogue covering Canadian oil, LNG, and natural uranium exports to China, potentially supporting long-haul crude-by-rail economics if new commercial purchase commitments materialize. Third, Chinese automotive investment commitments within three years could generate new finished vehicle and automotive parts traffic, particularly if Chinese EV manufacturers establish North American production capacity.
President Trump expressed support for the deal, though U.S. Trade Representative Howard Greer warned Canada would “surely regret” the decision. Ontario Premier Doug Ford criticized the agreement, warning it would “harm our economy and result in job losses,” while Saskatchewan Premier Scott Moe endorsed it as creating “new opportunities for Canadians”.
Carney stated Canada plans to double non-U.S. exports within 10 years. For Class I railroads operating in Canada—CN, CPKC—this represents a structural shift toward Pacific export corridors and away from traditional U.S.-bound traffic, with direct implications for intermodal routing, unit train utilization, and terminal capacity planning on the west coast.
We are Watching the NS
Norfolk Southern reported a 30% year-over-year increase in transformer shipments, driven by electrical grid infrastructure replacement, clean energy deployment, and AI data center construction. The railroad coordinated specialized dimensional shipments, including 160 wind turbine nacelles from Colorado to North Carolina for Vestas and nuclear turbine rotors for Georgia Power’s Vogtle plant.
Dimensional freight – cargo exceeding standard rail car dimensions or the 286,000-pound weight limit – requires specialized flat cars, custom routing using lidar clearance verification, and coordination with network operations centers to prevent conflicts with other traffic. Most dimensional projects are one-time movements rather than recurring traffic, but the volume growth reflects sustained capital investment in energy infrastructure that generates incremental railcar demand.
Virginia’s Hitachi Energy is investing $457 million to expand its power transformer plant in South Boston, which will become the largest U.S. facility for industrial transformers. NS provides rail service to the campus and expects continued dimensional shipment growth as clean energy and data center projects accelerate. Bernie Williams, NS group vice president of industrial products, stated he doesn’t see demand for large transformers falling off anytime soon, given aging grid infrastructure, clean energy buildout, EV adoption, and AI data center growth.
Transformer and heavy equipment movements typically utilize specialized heavy-duty flat cars in the 250-400 ton capacity, a segment dominated by private car owners and leasing companies rather than railroad-owned fleets.
We are Watching West Coast Intermodal
Port of Oakland handled 179,580 twenty-foot equivalents in December, down 1.7% year-over-year, with loaded imports falling 12.8%. For all of 2025, Oakland’s total volume was essentially flat at -0.4%. The port characterized maintaining stability in “an environment defined by uncertainty” as a notable outcome given policy and economic volatility.
West Coast ports outside Southern California faced challenges from Trump’s tariff policies on China, shifting ocean carrier trade patterns, and aggressive growth by Canadian ports Vancouver and Prince Rupert, which have leveraged cross-border rail services to attract U.S.-bound Midwest intermodal traffic. Maritime Director Bryan Brandes noted December reflected “the kind of uneven performance we’ve seen across the industry, with softer imports and strong export activity”.
The weakness in West Coast import volumes flows through to domestic intermodal rail traffic, particularly for BNSF and UP, which serve as primary rail carriers from Oakland and other Pacific coast gateways to inland markets. Carney’s China deal could eventually reverse some of this weakness if it generates stronger bilateral trade flows, though the immediate impact will be felt in Canadian ports rather than U.S. terminals.
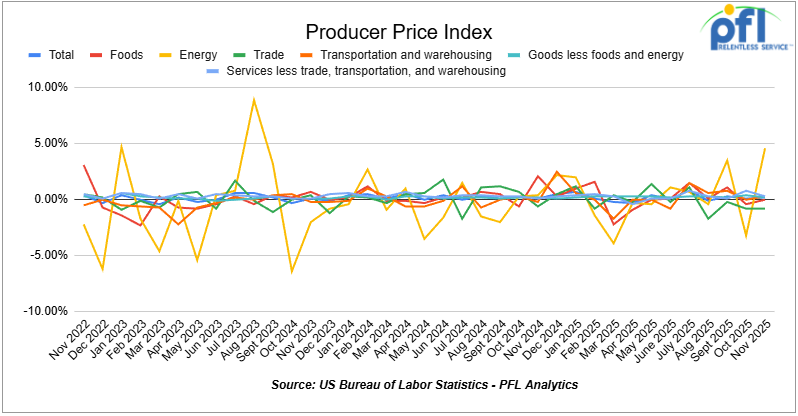
Producer Price Index
In November 2025, the Producer Price Index (PPI) for final demand increased 0.2% month over month, following a 0.1% gain in October, indicating contained but persistent upstream inflation pressures. Core PPI (final demand less foods, energy, and trade services) also rose 0.2% month over month, steady with October. The monthly increase was driven primarily by goods, which advanced 0.9%, reflecting a strong rise in energy prices (+4.6%), while food prices were unchanged (0.0%). Goods, less food and energy, increased 0.2%. Services were flat (0.0%) overall. Within services, trade margins declined 0.8%, transportation and warehousing rose 0.3%, and services excluding trade, transportation, and warehousing increased 0.3%.
In November 2025, the Consumer Price Index (CPI) report indicated that headline consumer prices rose 2.7% on a year-over-year basis, down from 3.0% in September and below market expectations. Because the Bureau of Labor Statistics did not collect sufficient price data during October 2025 due to the federal government shutdown, standard month-over-month percent changes for November are unavailable; instead, the BLS reported the two-month combined change from September to November, which amounts to a 0.2% increase in CPI overall and a 0.2% rise in core CPI (all items less food and energy) over that same period. Shelter inflation contributed moderately, while food and energy subindexes showed modest gains within that bi-monthly comparison. Over 12 months, core CPI rose approximately 2.6%, reflecting slower underlying inflation pressures relative to earlier in the year.
Lease Bids
- 30-50, 6000cf Steel Hopper located off of CSX or NS in East. For use in petcoke service. Period: 5 Years.
- 10, 2500CF Open Top Hopper located off of UP or BN in Texas. For use in aggregate service. Period: 5 years. Need Rapid Discharge Doors.
- 100, 21.9K 117J Tank located off of All Class 1s in Midwest. For use in CO2 service. Period: 6 months.
- 30-50, 30K 117J Tank located off of NS or CSX in Northeast. For use in C5 service. Period: 1 year.
- 60, 33K 340W Tank located off of BNSF in UT/AZ. For use in Propane service. Period: Trip Lease.
Sales Bids
- 28, 3400CF Hopper Covered located off of UP BN in Texas. For use in Cement service.Cement Gates needed.
- 20, 17K Tank DOT111 located off of various class 1s in various locations. For use in corn syrup service.
- 120, Various Gondola Open-Top Aluminum Rotary located off of various class 1s in various locations. For use in Sulphur service.Built 2004 or later.
- 30, 29K Tank DOT111 located off of various class 1s in Chicago. For use in Veg Oil service.
Lease Offers
- 100, 30K CPC1232 Tanks located off of UP or BN in Texas. Last used in Diesel.
- 100, 30K DOT117J Tanks located off of UP or BN in Texas. Last used in Gasoline.
- 100, 29K DOT117J Tanks located off of UP or BN in Texas. Last used in Gasoline. Coiled and Insulated.
- 36, 6351 Covered Hopper located off of CN in Wisconsin. Last used in Grain. through 2/27.
- 29, 6580 Covered Hopper located off of CN in Wisconsin. Last used in Grain. through 2/26.
- 18, 6580 Covered Hopper located off of CN in Wisconsin. Last used in Grain. through 2/27.
- 9, 5400 Covered Hopper located off of CN in Wisconsin. Last used in Grain. through 2/27.
- 21, 6351 Covered Hopper located off of CN in Wisconsin. Last used in DDG. Available until February 2027.
- 29, 6500 Covered Hopper located off of CN in Wisconsin. Last used in DDG. Available until February 2027.
- 50, 5380 Covered Hopper located off of UP or BN in Houston. Last used in Fertilizer. Cars are currently clean. Available until February.
- 50, 20K DOT117J Tank located off of All Class 1s in Moving. Last used in Styrene.
- 29, 25.5K DOT117J Tank located off of UP or BN in Texas. Cars are currently clean. Cars are currently clean.
- 90, 30K DOT117J Tank located off of UP or BN in Corpus Christie. Last used in Diesel.
Sales Offers
- 21, 50′ Boxcar Plate Cs located off of various class 1s in NM. End of Life.
- 3, 50′ Boxcar Plate Cs located off of various class 1s in multiple locations. End of Life.
- 27, 50′ Boxcar Plate Cs located off of various class 1s in PQ. End of Life.
- 100, 3250 Covered Hoppers located off of various class 1s in multiple locations. Sand Cars.
- 5, 2740 Mill Gondolas located off of various class 1s in NC. End of Life.
- 1, 2260 Mill Gondolas located off of various class 1s in AL. End of Life.
- 30, 2740 Mill Gondolas located off of various class 1s in multiple locations. End of Life.
- 21, 2740 Mill Gondolas located off of various class 1s in WA. End of Life.
- 9, 4750 Covered Hoppers located off of various class 1s in multiple locations. End of Life.
- 5, 4750 Covered Hoppers located off of various class 1s in multiple locations. End of Life.
- 50, 31.8K Tank CPC 1232s located off of UP or BN in TX. Requal Due in 2025.
- 100, 4600CF Open Top Hoppers located off of BN or CSX in Southeast.
Call PFL today to discuss your needs and our availability and market reach. Whether you are looking to lease cars, lease out cars, buy cars, or sell cars call PFL today at 239-390-2885
Live Railcar Markets
| CAT | Type | Capacity | GRL | QTY | LOC | Class | Prev. Use | Offer | Note |
|---|
PFL will be at the Following Conferences

- Where: La Quinta, CA
- Attending: David Cohen (954-729-4774)
- Conference Website

- Where: Hyatt Regency Dallas in Dallas, TX
- Attending:Curtis Chandler (239.405.3365), David Cohen (954-729-4774), Brian Baker (239.297.4519), Cyndi Popov(403) 402-5043
- Conference Website