“If you cannot work with love but only with distaste, it is better that you should leave your work.”
– Khalil Gibran
Jobs Update
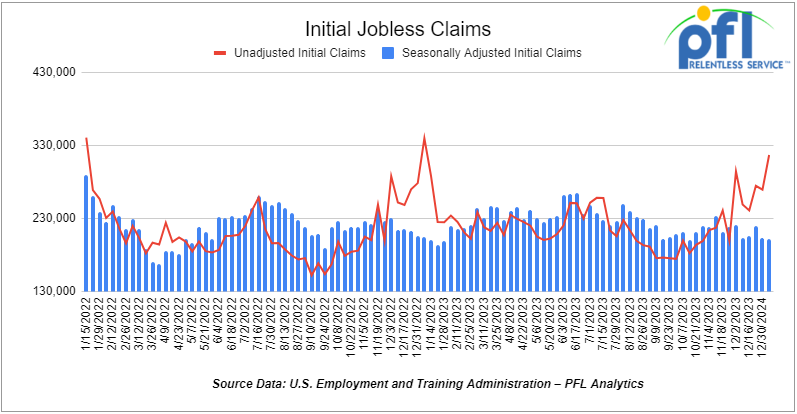
- Initial jobless claims seasonally adjusted for the week ending January 6th, 2023 came in at 202,000, down -1,000 people week-over-week.
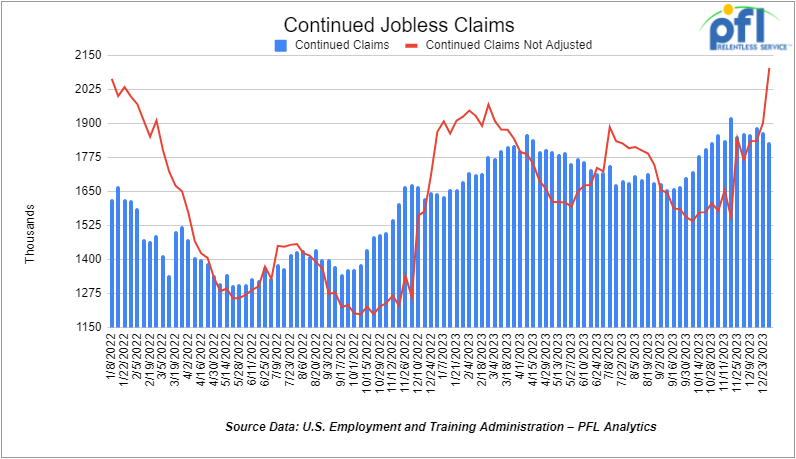
- Continuing jobless claims came in at 1.834 million people, versus the adjusted number of 1.868 million people from the week prior, down -34,000 people week-over-week.
Stocks closed mixed on Friday of last week, but up week over week
The DOW closed lower on Friday of last week, down -118.04 points (-0.31%), closing out the week at 37,592.98, up 126.87 points week-over-week. The S&P 500 closed higher on Friday of last week, up 3.59 points (0.08%), and closed out the week at 4,783.83, up 86.59 points week-over-week. The NASDAQ closed higher on Friday of last week, up 2.58 points (0.02%), and closed out the week at 14,972.76, up 448.69 points week-over-week.
In overnight trading, DOW futures traded lower and are expected to open at 37,602 this morning down -190 points.
Crude oil closed higher on Friday of last week, but lower week over week
WTI traded up $0.66 per barrel (0.92%) to close at $72.68 per barrel on Friday of last week, down $-1.13 per barrel week-over-week. Brent traded up US$0.88 per barrel (1.14%) on Friday of last week, to close at US$78.29 per barrel, down -US$0.47 per barrel week-over-week.
One Exchange WCS for February delivery settled on Friday of last week at US$18.85 below the WTI-CMA. The implied value was US$53.97 per barrel. On Thursday of last week, it settled at US$19.15 below the WTI-CMA for February delivery. The implied value was US$52.97 per barrel.
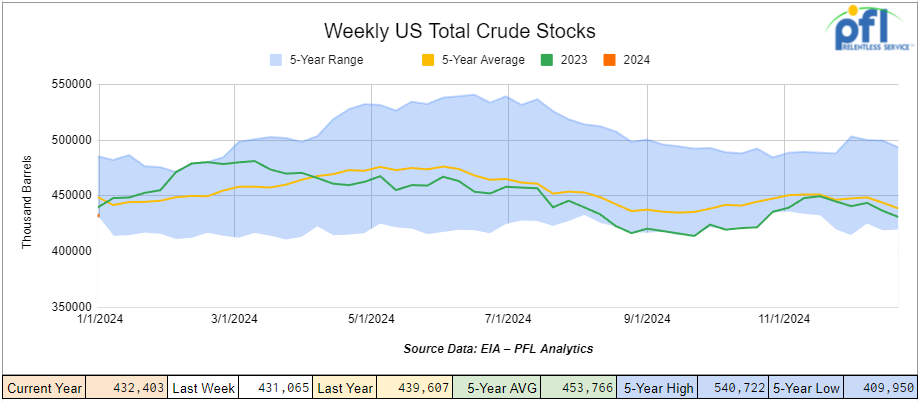
U.S. commercial crude oil inventories (excluding those in the Strategic Petroleum Reserve) increased by 1.3 million barrels week-over-week. At 432.4 million barrels, U.S. crude oil inventories are about 2% below the five-year average for this time of year.
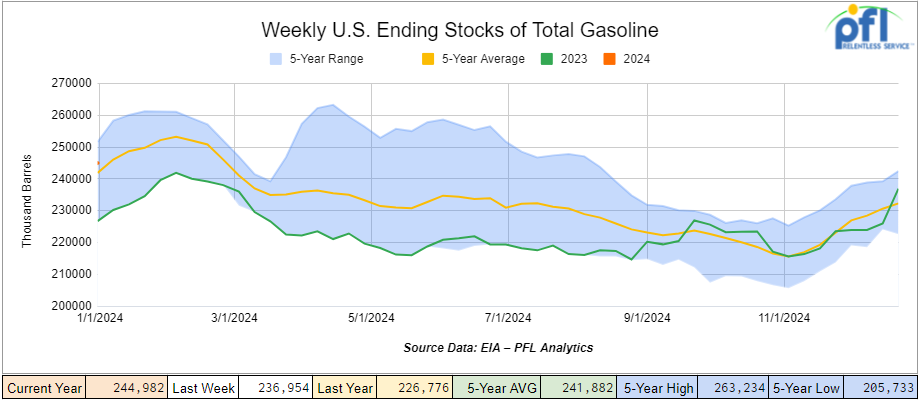
Total motor gasoline inventories increased by 8 million barrels week-over-week and are 1% above the five-year average for this time of year.
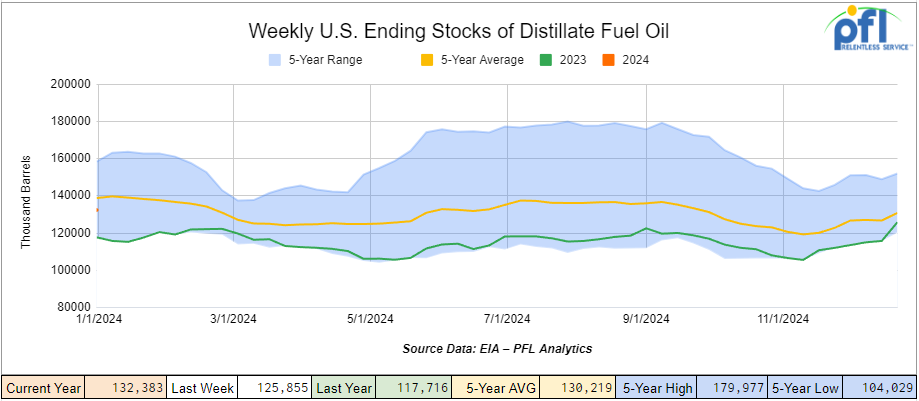
Distillate fuel inventories increased by 6.5 million barrels week-over-week and are 4% below the five-year average for this time of year.
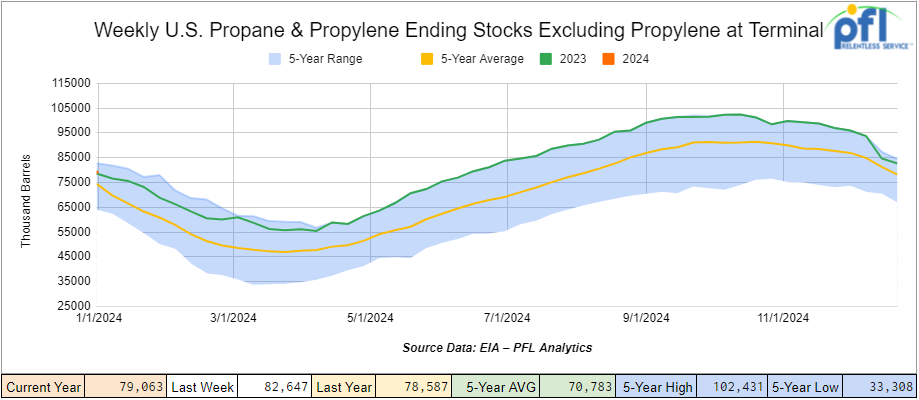
Propane/propylene inventories decreased by 3.6 million barrels week-over-week and are 12% above the five-year average for this time of year.
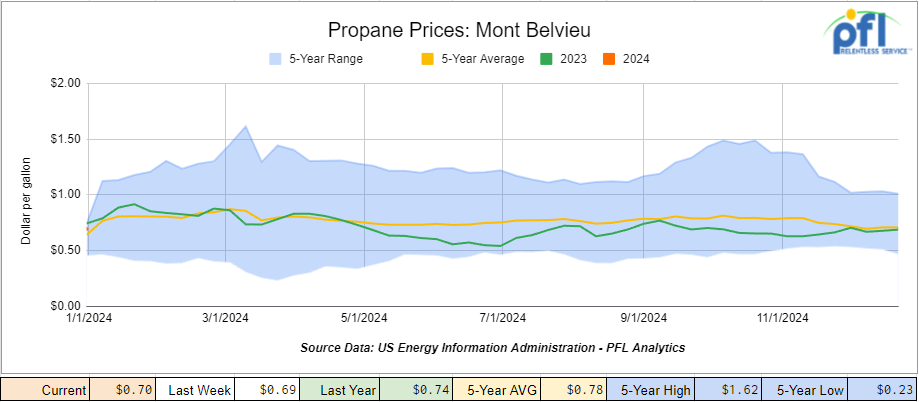
Propane prices closed at 70 cents per gallon, up 1 cent week-over-week, but down 4 cents year-over-year.
Overall, total commercial petroleum inventories increased by 9.5 million barrels during the week ending January 5, 2024.
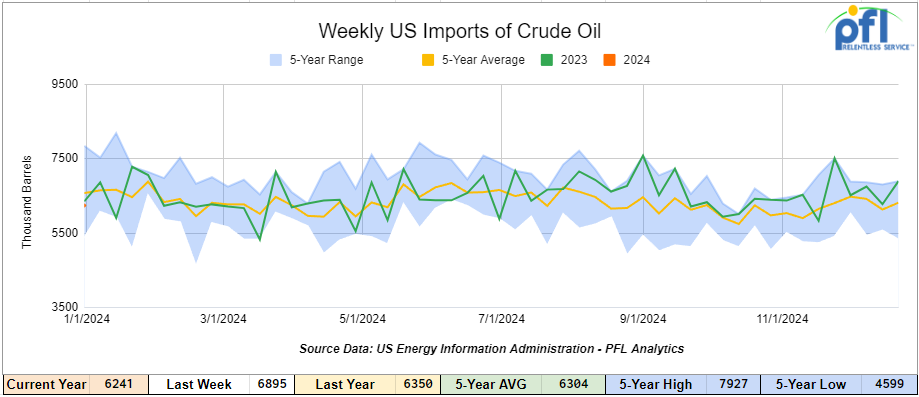
U.S. crude oil imports averaged 6.2 million barrels per day during the week ending January 5, 2024, decreased by 654,000 barrels per day week-over-week. Over the past four weeks, crude oil imports averaged 6.5 million barrels per day, 8.2% more than the same four-week period last year. Total motor gasoline imports (including both finished gasoline and gasoline blending components) averaged 500,000 barrels per day, and distillate fuel imports averaged 274,000 barrels per day. during the week ending January 5, 2024.
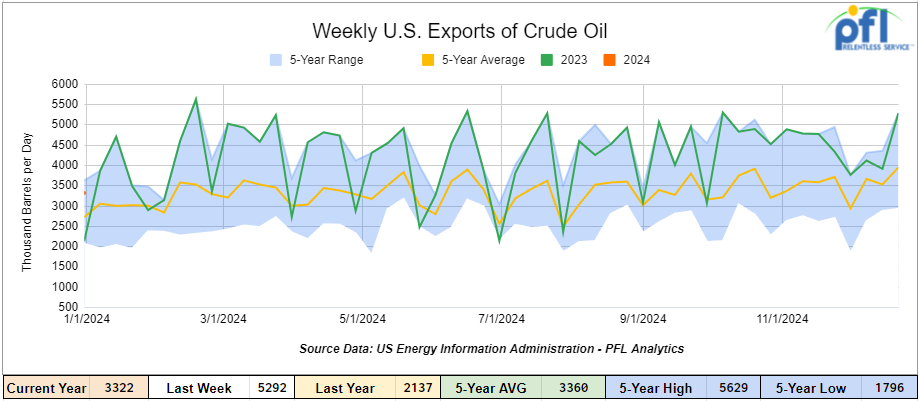
U.S. crude oil exports averaged 3.322 million barrels per day for the week ending January 5th, a decrease of 1.97 million barrels per day week-over-week. Over the past four weeks, crude oil exports averaged 4.163 million barrels per day.
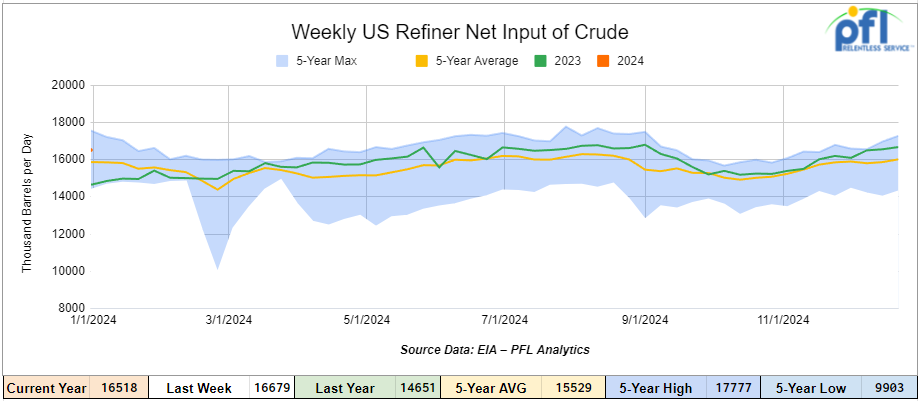
U.S. crude oil refinery inputs averaged 16.5 million barrels per day during the week ending January 5, 2024, which was 161,000 barrels per day less week-over-week.
WTI is poised to open at $73.29, up $0.69 per barrel from Friday’s close.
North American Rail Traffic
Week Ending January 10th, 2023.
Total North American weekly rail volumes were up (0.25%) in week 2, compared with the same week last year. Total carloads for the week ending on January 10th were 320,071, down (-0.96%) compared with the same week in 2023, while weekly intermodal volume was 259,632, up (1.78%) compared to the same week in 2023. 6 of the AAR’s 11 major traffic categories posted year-over-year increases with the most significant increase from Chemicals (+9.2%) while the largest decrease came from Motor Vehicles and Parts, down (-24.64%).
In the East, CSX’s total volumes were down (-0.37%), with the largest increase coming from Forest Products (+10.8%) and the largest decrease coming from Motor Vehicles and Parts, down (-29.77%). NS’s volumes were up (0.66%), with the largest increase coming from Chemicals (+16.12%) while the largest decrease came from Motor Vehicles and Parts, down (-22.33%).
In the West, BN’s total volumes were up (+5.32%), with the largest increase coming from Other (+18.80%) while the largest decrease came from Metallic Ores and Minerals, down (-19.42%). UP’s total rail volumes were down (-2.46%) with the largest increase coming from Petroleum and Petroleum Products (+28.8%) while the largest decrease came from Motor Vehicles and Parts, down (-22.98%).
In Canada, CN’s total rail volumes were down (2.81%) with the largest increase coming from Chemicals (+8.88%) and the largest decrease coming from Motor Vehicles and Parts (-36.23%). CP’s total rail volumes were up (21.32%) with the largest increase coming from Motor Vehicles and Parts (+79.89%) while the largest decrease came from Other, down (-57.14%).
KCS’s total rail volumes were down (-19.32%) with the largest decrease coming from Intermodal (-37.42%) and the largest increase coming from Chemicals (+3.7%).
Source Data: AAR – PFL Analytics
Rig Count
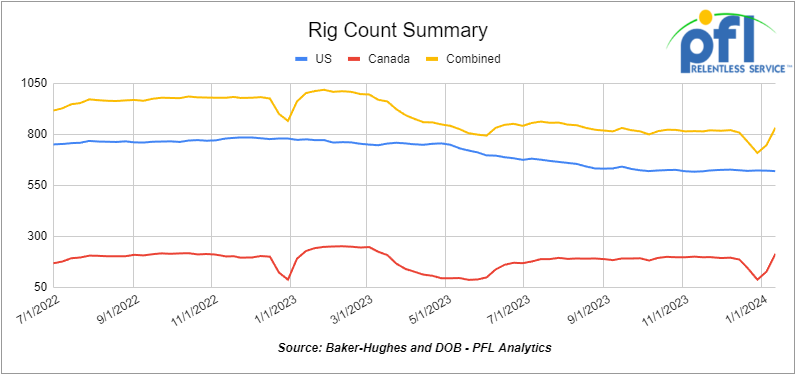
North American rig count was up by 86 rigs week-over-week. U.S. rig count was down by -2 rigs week-over-week, and down by -156 rigs year-over-year. The U.S. currently has 619 active rigs. Canada’s rig count was up by 88 rigs week-over-week , but down by -14 rigs year-over-year. Canada’s overall rig count is 213 active rigs. Overall, year-over-year, we are down -170 rigs collectively.
North American Rig Count Summary

A few things we are watching:
Folks, We Were in Chicago at MARS Last Week
One of our most favorite conferences was a huge success. PFL was out in full force with Brian Baker, David Cohen and Curtis Chandler attending. We are a proud Platinum sponsor of MARS and had a table at the event. We collected roughly 300 cards and we are having a drawing later today as promised. We will be giving away:
- 2 PFL model tank cars
- 2 PFL model box cars
- 8 PFL Swiss Army Knives
- 8 PFL Wireless charges
We will be mailing the 20 winners their prize tomorrow. Thanks for stopping by our table at MARS.
People were there to get business done to kick off the year, and so was PFL. It is busy out there, folks. Surprisingly there were roughly 1,000 people in attendance despite chaotic weather across the country. PFL had delays coming into Chicago and got out just in the nick of time albeit we didn’t make it home at times intended. Tracey Stein did a fantastic job and there was a massive food improvement this year!.
Speakers included – Ian Jeffries, President & CEO, Association of American Railroads, Paul Titterton, EVP & President of Rail North America, GATX amongst others. For more information on MARS, please call PFL today.
We are watching Petroleum Carloads
The four-week rolling average of petroleum carloads carried on the six largest North American railroads fell to 29,937 from 30,583, which was a loss of -646 rail cars week-over-week. Canadian volumes were lower. CPKC’s shipments fell by -11% week over week, CN’s volumes were lower by -19% week-over-week. U.S. shipments were lower across the board. The UP had the largest percentage decrease and was down by -13.2%.
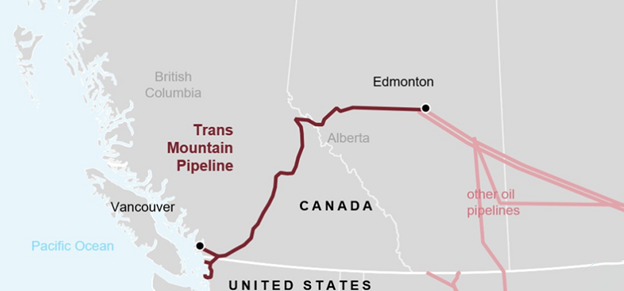
We Continue to Watch Canada’s Trans Mountain Pipeline
We were expecting some more definitive news this week as producers in Alberta anxiously await the crude oil pipeline to start up and start delivering line pack and we got it yesterday. The Trans Mountain pipeline expansion cleared its latest hurdle as the Canadian Energy Regulator approved a request late on Friday afternoon for a pipeline variance from the company. While the regulator imposed a number of conditions, including testing and documentation requirements for the pipe materials, it said Trans Mountain Corporation can begin constructing the variance right away. The previous application had been denied because the CER determined that Trans Mountain did not adequately address concerns about pipeline integrity and related environmental protection impacts.
The Canadian government acquired the pipeline from Kinder Morgan for CA $4.5 billion in 2018 and formed the Trans Mountain Corporation (TMC) to oversee and manage the pipeline and the expansion project. Ever since then you have had the Government fighting Government – a Canadian Federal Government owned pipeline fighting the Canadian Energy Regulator to get it built while at the same time trying to satisfy the hard left. You can’t make this stuff up- tax dollars hard at work in Canada.
Trans Mountain Pipeline Route (December 2023)
Source: EIA
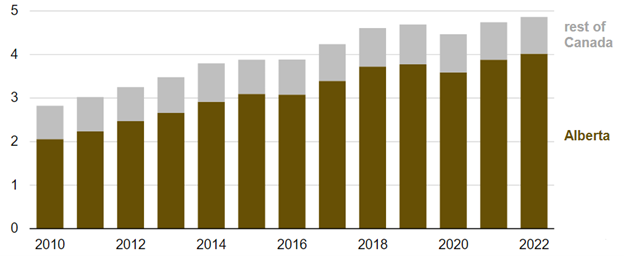
Canada’s crude oil production has increased steadily for the last 13 years and is set to increase again with more pipe. Canada’s average annual production of crude oil and condensate rose nearly 2.0 million barrels per day between 2009 to 2019. In 2020, the effects of the COVID-19 pandemic decreased crude oil production as crude oil prices declined significantly. Canada’s production has since resumed its growth trend. Canada’s production exceeded pre-pandemic levels in 2022 when crude oil and condensate production averaged 4.9 million barrels per day, according to data from the Canada Energy Regulator.
Canada’s Annual Crude Oil and Condensate Production
Source: EIA – Source Data – Canadian Energy Regulator
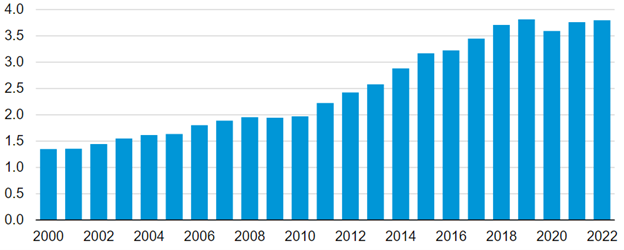
At the same time, the U.S. appetite for the Canadian barrel has risen – it would be more if the Biden administration didn’t cancel the Keystone pipeline on day one of his administration. Currently, more crude oil flows from Canada to the United States than to any other country by a wide margin; U.S. imports from Canada have averaged about 3.7 million barrels per day since 2020. U.S. crude oil imports from Canada accounted for roughly 79% of Canada’s total crude oil production during that time. Canada is also the largest source of crude oil imports to the United States – these imports primarily flow to refineries in the Midwest and the U.S. Gulf Coast.
U.S. Annual Crude Oil Imports from Canada (2000-2022)
Source: U.S. Energy Information – Petroleum Supply Monthly
We are watching The Green New Deal and Electric Vehicles
We have talked about this one for a long time – electric vehicles are not green – not even close to being green. The input costs on the environment and all the hidden taxes does not make sense – hopefully, we close the chapter on this one as soon as possible. Sure some people may want them for putting around town as a second car or if they don’t plan on going out of town on a road trip ever it could make sense for some.
The government is trying to ram this down our throat and the fact is consumers are not buying the cars but the government at the same time continues to support charging stations – U.S. tax dollars that we don’t have hard at work here. Now, Hertz announced last week they are backtracking on its big EV bet where they were expected to buy 100,000 cars for their fleet; they have only bought 60,000 and are selling ⅓ of them!
The car-rental firm said last week it’s selling 20,000 EVs — about one-third of its electric fleet of Teslas, Volvos, Polestars, and more — partly due to repair and maintenance costs. Hertz is starting to sell some of its Tesla Model 3s and they are going pretty cheap – as low as $14,000 with the used EV tax credit.
We are watching the U.S. Strategic Oil Reserves (SPR)
Well folks, we are filling up slowly (no need to update our graph, we are not even making a dent). The U.S. DOE announced on Friday of last week its intent to buy another 3 million barrels for the month of May at the SPR’s Big Spring storage site in Texas. The DOE has awarded contracts from January through March totaling 9 million barrels (less than 1 day’s worth of consumption!) At the current rate of repurchase, it will take 5 years to buy back what the Biden administration sold (roughly 180 Million barrels). Why are they not filling it up quicker you ask? Because they can’t they are doing maintenance. The SPR was not meant to operate as a commercial storage facility but rather as an emergency stockpile; you can’t just pull a bunch of oil out of the SPR and put it back into the ground over and over. The DOE claims it is a good deal for the American taxpayer because the crude was sold for $95 per barrel and the average purchase price was $75 with the $20 arb we have made $180 Million so far – on the surface not so bad, however, we know of at least a $500 Million ask for repairs and upgrades and we have 171 million barrels to buy back – we will see how this plays out. We report, you decide.
Biden Trying to Kill Liquefied Natural Gas Opportunities
The Oil industry slammed Biden over LNG and a risk to energy supplies. Officials with the country’s largest oil and gas lobby lambasted the Biden administration’s record on Wednesday of last week, including reports that the Department of Energy is considering stricter reviews for liquefied natural gas export facilities. The criticisms highlight a political conundrum for President Joe Biden as he heads into the 2024 campaign and works to balance the demand for affordable energy with his climate change concerns. The comments came from the American Petroleum Institute (“API) — which held its annual energy summit in Washington. During the event, API debuted an advocacy campaign called Lights on Energy, which provides industry arguments and recommendations for U.S. policymakers. It includes an eight-figure national TV and digital advertising buy, according to the oil and gas trade group. API represents all segments of America’s oil and natural gas industry. Its nearly 600 members produce, process, and distribute most of the nation’s energy. The industry supports millions of U.S. jobs and is backed by a growing grassroots movement of millions of Americans. API was formed in 1919 as a standards-setting organization. In its first 100 years, API has developed more than 700 standards to enhance operational and environmental safety, efficiency, and sustainability. If you ask us, Natural Gas is the way to go – it is as clean burning as it gets. We should be powering our cars, buses, and trucks with clean-burning natural gas and propane if you ask us – super cheap and we have lots of it, plus it is great for rail – the more natural gas we produce the more LPG’s we produce!
We are watching Unions and The STB
Just what we need folks – more regulation, more cost, and more inflation. Those of you who thought inflation was slowing down or ending, we have a different view on that one. A group of rail labor unions is asking federal regulators to take several actions that the unions say would strengthen the safety, service, and reliability of Class 1’s.
In a report filed Jan. 9 with the Surface Transportation Board, the unions recommended five steps that they say the STB and Federal Railroad Administration should take to improve the Class 1’s. They allege the “railroad industry is on the precipice of a self-made disaster” due to “increasingly dangerous trends of locomotive and equipment failures caused by the freight railroads’ cost-cutting business model known as precision scheduled railroading.”
The unions called for the STB and FRA to:
- establish and implement a uniform model training, qualifications and certification program that would apply to all Class Is and that must be completed by all those railroads’ workers who provide inspection, service and maintenance repairs, or shop-craft work;
- establish and enforce a standard that ensures there is an adequate workforce with the skills necessary to “fulfill the demands of the freight rail industry in the safest and most reliable fashion possible”;
- carry out stronger enforcement of safety regulations and standards by conducting more unplanned focus inspections and random and scheduled safety audits of the Class 1’s;
- carry out the disqualification of railroad managers under 49 CFR Part 209.301; and eliminate loopholes under existing federal regulations that “the railroads exploit to maximize profits rather than ensure safety and reliable services.”
To read the unions’ entire 81-page report, click here.
We are Watching Some Key Economic Indicators
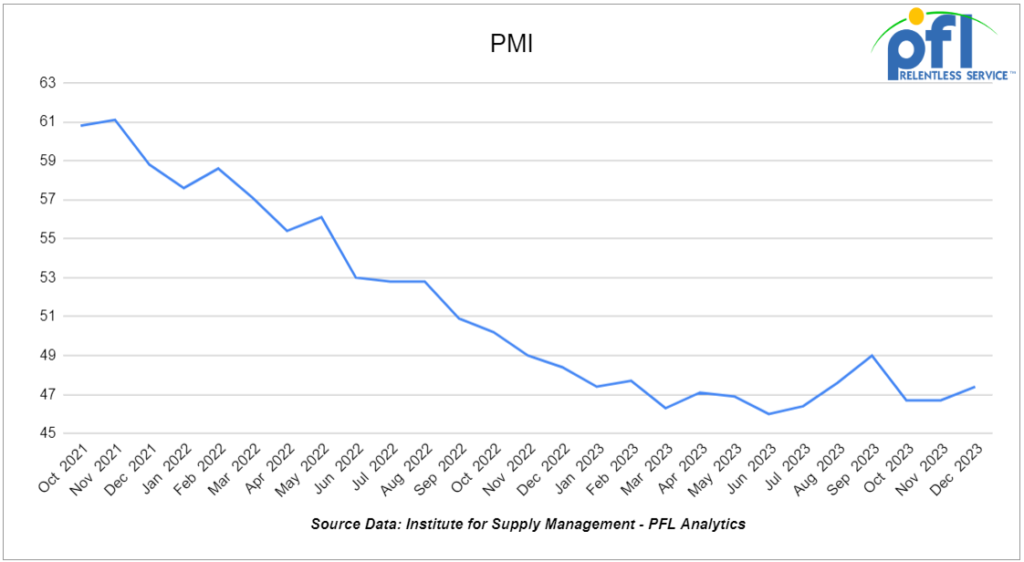
Purchasing Managers Index (PMI)
The Institute for Supply Management releases two PMI reports – one covering manufacturing and the other covering services. These reports are based on surveys of supply managers across the country and track changes in business activity. A reading above 50% on the index indicates expansion, while a reading below 50% signifies contraction, with a faster pace of change the farther the reading is from 50. The overall Manufacturing PMI was 47.4% in December, up from 46.7% in November and October. The index has been relatively flat throughout 2023, with December marking the 14th straight month it’s been below 50%. The new orders subindex in December was 47.1%, down from 48.3% in November.
The Manufacturing PMI averaged 47.1% in 2023. Since 2006, only 2008 (46.4%) was lower. The averages for 2021 and 2022 were 60.7% and 53.5%, respectively.
The Services PMI, the service sector’s answer to the Manufacturing PMI, was 50.6% in December, a decrease from November’s 52.7%, the lowest it’s been in three months, and below what most economists were expecting. Still, December marks the 12th consecutive month in which the Services PMI has been in “expansion” territory. Since the pandemic, the Services PMI index has typically been higher than the Manufacturing PMI. In 2023, the Services PMI averaged 52.8%. Since 2008, when the Services PMI began, only 2009 (46.3%) and 2008 (47.4%) were lower.
Industrial Output & Capacity Utilization
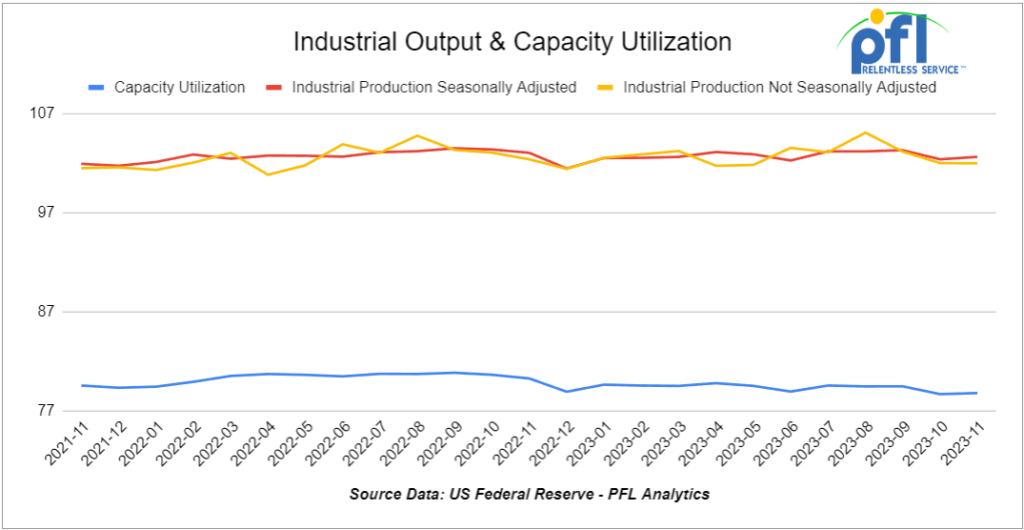
Total U.S. industrial output rose a preliminary and seasonally adjusted 0.2% in November 2023 from October 2023, while manufacturing output (which is about 75% of total output) rose 0.3%, according to data released December 15 by the Federal Reserve. The Federal Reserve collects data from various trade associations, other government agencies, and others to compile its industrial production figures.
Total output in November 2023 was down a preliminary 0.4% from November 2022, down from a revised 1.0% year-over-year decline in October and the fourth in a row. Manufacturing output in November 2023 was down 0.8% from November 2022, its ninth straight year-over-year decline.
As the Federal Reserve reports, “The increase in manufacturing output [in November] was more than accounted for by a 7.1 percent bounce-back in motor vehicles and parts production following the resolution of strikes at several major automakers.” Manufacturing output excluding motor vehicles and parts fell 0.2% in November from October.
Overall capacity utilization was a preliminary 78.8% in November, up from 78.7% in October, but still one of its lowest levels in the past two years. Capacity utilization for manufacturing was 77.2% in November, also up slightly from October and well below where it’s been for most of the past two years.
U.S Unemployment
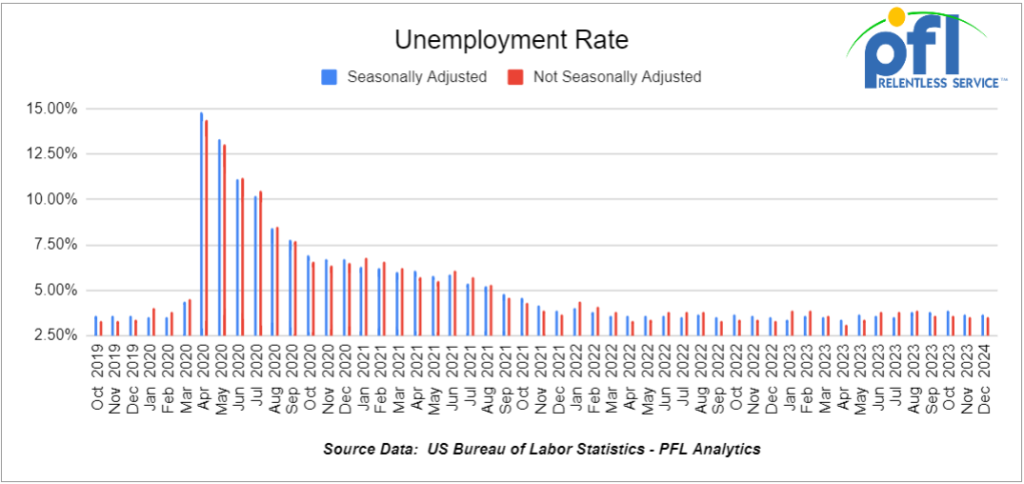
According to the Bureau of Labor Statistics (BLS), a preliminary 216,000 net new jobs were created in December 2023, better than what most economists expected. Job gains in October and November were 105,000 and 173,000, respectively.
There will be revisions later, but for now 2.7 million net new jobs were created in 2023, or an average of 225,000 per month. The problem is of the 2.7 million net new jobs in 2023, 672,000 were in various levels of government; 654,000 were in health care; 298,000 were in food services (mainly restaurants and bars); and 266,000 were in social assistance.
The official unemployment rate was 3.7% in December, the same as November.
Consumer Confidence
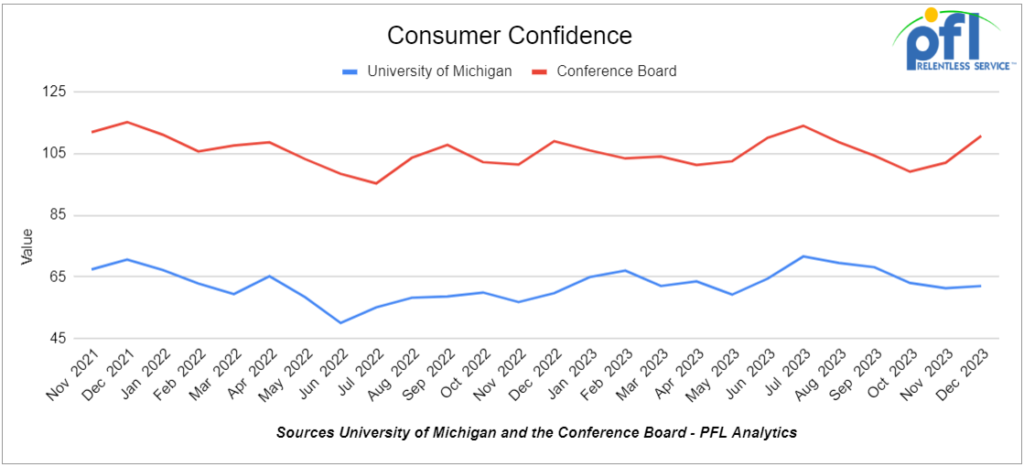
The Conference Board’s Index of Consumer Confidence rose to 110.7 in December from 101.0 in November. It’s the highest it’s been since July 2023 and, before that, January 2022.
The index of consumer sentiment from the University of Michigan also rose – from 61.3 in November to 69.7 in December, the highest it’s been since July 2023 and, before that, December 2021.
Don’t ask why consumer confidence and sentiment are higher – maybe people are seeing change right around the corner!
Consumer Spending
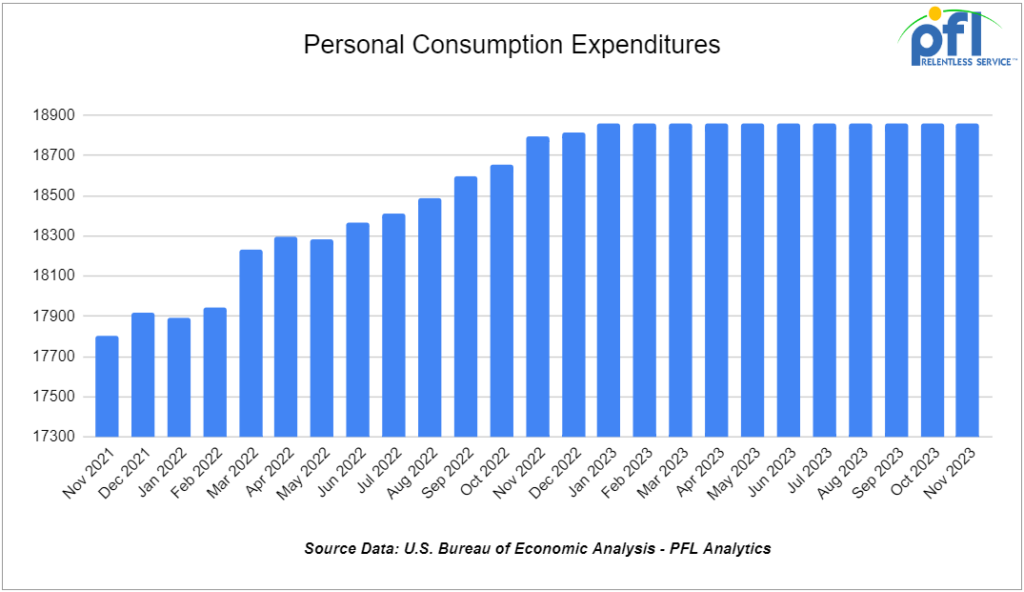
Not adjusted for inflation, total U.S. consumer spending rose a preliminary 0.2% in November 2023 over October 2023 – the eighth consecutive month-over-month gain. Spending on goods fell a preliminary 0.2% in November; spending on services rose 0.5%. Adjusted for inflation, total consumer spending rose 0.3% in November, up from 0.1% in October; on a year-over-year basis, total spending in November 2023 was up 2.7%, its biggest increase since March 2022.
We have been extremely busy at PFL with return-on-lease programs involving rail car storage instead of returning cars to a shop. A quick turnaround is what we all want and need. Railcar storage in general has been extremely active. Please call PFL now at 239-390-2885 if you are looking for rail car storage, want to troubleshoot a return on lease scenario, or have storage availability. Whether you are a car owner, lessor or lessee, or even a class 1 that wants to help out a customer we are here to “help you help your customer!”
Leasing and Subleasing has been brisk as economic activity picks up. Inquiries have continued to be brisk and strong Call PFL Today for all your rail car needs at 239-390-2885
Lease Bids
- 10, 5200cf PD Hoppers needed off of UP in Colorado for 1-3 years. Cars are needed for use in Silica service. Call for details
- 25-50, 5000CF-5100CF Covered Hoppers needed off of BNSF, CSX, KCS, UP in Gulf LA for 3-10 years. Cars are needed for use in Dry sugar service. 3 bay gravity dump, Hempel 37700
- 50-100, 4550 Covered Hoppers needed off of UP or BN in Texas for 5 years. Cars are needed for use in Grain service.
- 10, 2500CF Open Top Hoppers needed off of UP or BN in Texas for 5 years. Cars are needed for use in aggregate service. Need Rapid Discharge Doors
- 25, 3230 PD Hoppers needed off of NS or CSX in Ohio for 5 years. Cars are needed for use in Flyash service.
- 10, 33K 340W Pressure Tanks needed off of CN in LA for 1 year. Cars are needed for use in Butane service.
- 25-50, 32K 340W Pressure Tanks needed off of NS or CSX in Marcellus for 1-2 years. Cars are needed for use in Propane service. Q1
- 14, 23.5K DOT111 Tanks needed off of UP in Morrilton, AR for 1 year. Cars are needed for use in Turpentine service.
- 50, 19k DOT111 Tanks needed off of UP or BN in Nevada or CA for 1 year. Cars are needed for use in Sulfuric Acid service. March or April
- 10, 30k any Tanks needed off of UP BN in Texas for 1 year plus. Cars are needed for use in Fuel Oil service.
- 25-50, 30K DOT111, DOT117, CPC 1232 Tanks needed off of CN or CP in WI, Sarnia for 1-2 years. Cars are needed for use in Diesel service. Q2-Q3
- 108, 28.3K Any Tanks needed off of CN in Canada for 1-3 years. Cars are needed for use in Crude service.
- 10, 28.3K DOT 111, 117, CPC 1232 Tanks needed off of UP or BN in Iowa for 2 years. Cars are needed for use in Biodiesel service.
- 150, 23.5K DOT111 Tanks needed off of any class 1 in LA for 2-3 years. Cars are needed for use in Fluid service. Needed July
- 30-40, 28.3K DOT117R, DOT117J, DOT111 Tanks needed off of UP in Iowa for 2-3 years. Cars are needed for use in Feedstocks service.
- 15, 28.3K DOT117J Tanks needed off of any class 1 in any location for 3 years. Cars are needed for use in Glycerin & Palm Oil service.
- 30, 17K-20K DOT117J Tanks needed off of UP or BN in Midwest/West Coast for 3-5 years. Cars are needed for use in Caustic service.
- 25, 20.5K CPC1232 or DOT117J Tanks needed off of BNSF or UP in the west for 3-5 years. Cars are needed for use in Magnesium chloride service. SDS onhand
- 25-50, 25.5K DOT117J Tanks needed off of NS CSX in Northeast for 5 years. Cars are needed for use in Asphalt / Heavy Fuel Oil service.
- 100, 28.3K Any Tanks needed off of UP or BN in Midwest/Texas for 5 years. Cars are needed for use in Veg Oils / Biodiesel service. Need to be Unlined
- 20-25, 30K DOT117 Tanks needed off of UP or BN in Illinois for 5 years. Cars are needed for use in Ethanol service.
- 8, 28-30K Any Tanks needed off of UP BN in Texas and Gulf for 5 years. Cars are needed for use in Chlorobenzene service. Need Magrods
- 25, 30K Any Tanks needed off of in Houston for December -June. Cars are needed for use in Diesel service.
- 75, 30K Any Tanks needed off of Any Class 1 in Chicago for December 23-May 24. Cars are needed for use in Gasoline service.
- 50, 23.5-25.5 DOT111 Tank s needed off of Any Class 1 in USA for 5 years. Cars are needed for use in Asphalt service.
- 10, 30K 117R or 117J Tanks needed off of Any Class 1 in USA for 1 year. Cars are needed for use in Glycerin service.
Sales Bids
- 100, Plate F Boxcars needed off of BN or UP in Texas.
- 10, 2770 Mill Gondolas needed off of any class 1 in St. Louis. Cars are needed for use in Cement service.
- 20, 2770-3400 Mill Gondolas needed off of any class 1 in South Texas. Cars are needed for use in scrap metal service.
- 20, 2770 Mill Gondolas needed off of CSX in the northeast. Cars are needed for use in non-haz soil service. 52-60 ft
- 100-150, 3400CF Covered Hoppers needed off of UP BN in Texas. Cars are needed for use in Sand service.
- 8, 5200 Covered Hoppers needed off of various class 1s in various locations. Cars are needed for use in Plastic Pellet service.
- 20-30, 3000 – 3300 PDs Hoppers needed off of BN or UP preferred in West. Cars are needed for use in Cement service. C612
- 10, 4000 Open Hoppers needed off of CSX in the northeast. Cars are needed for use in scrap metal service. Open top hopper
- 10, 6400 Open Hoppers needed off of CSX in the northeast. Cars are needed for use in wood chip service. Open top hopper, flat bottom
- 45, 3000 cf PD Hoppers needed off of any class 1 in Texas. Negotiable
- 200+, 5000cf Covered Hoppers needed off of any class 1 in various locations.
- 5, 3400CF Closed Hoppers needed off of any class 1 in Ohio. Cars are needed for use in Sand service.
- 20, 17K DOT111 Tanks needed off of various class 1s in various locations. Cars are needed for use in corn syrup service.
- 100, 15.7K DOT111 Tanks needed off of CSX or NS in the east. Cars are needed for use in Molten Sulfur service.
- 30, 17K-20K DOT111 Tanks needed off of UP or BN in Texas. Cars are needed for use in UAN service.
- 20-25, 25.5K DOT117, DOT111, CPC 1232 Tanks needed off of UP or BN in Texas. Cars are needed for use in Veg Oil service. Coiled and insulated
- 15, 30K DOT117, DOT111, CPC 1232 Tanks needed off of UP or BN in Texas. Cars are needed for use in Veg Oil service.
- 1-2, Any DOT117, DOT111, CPC 1232 Tanks needed off of any class 1 in Texas. Coiled and Insulated
- 2-4, 28K DOT111 Tanks needed off of BNSF Preferred in Minnesota. Cars are needed for use in Biodiesel service. Coiled and insulated
Lease Offers
- 15, Plate E and F Boxs located off of NS in New Orleans. Cars are clean Double Sliding Doors
- 10, 28.3K, DOT117R Tanks located off of All Class Ones in St Louis. Cars are clean Call 239-390-2885 for more information
- 10, 21.9K, Tanks located off of UP in Longview, TX. Cars are clean CO2 Cars. Brand New. 2-5 Year Lease
- 38, 4750 plus, 3-4 Hatch Gravity Covered Hopperss located off of CSX CN CP in Florida. Sub-lease 12-18 months
- 125, 28.3K, 117J Tanks located off of Various Class 1s in Multiple locations. Cars are clean Long Term Lease, 5 Years +
- 80, 25.5K, 117J Tanks located off of UP in Texas. Cars are clean Long-term Lease.
Sales Offers
- 20, Refer, Box Boxcars located off of UP in ID.
- 100-200, 31.8K, CPC1232 Tanks located off of BN in Chicago. Mix of dirty and clean cars
- 100, 28.3K, DOT117J Tanks located off of various class 1s in multiple locations.
- 100, 17K, DOT111 Tanks located off of various class 1s in multiple locations.
- 100, 19K, DOT111 Tanks located off of various class 1s in multiple locations.
- 120, 31.8K, CPC1232 Tanks located off of various class 1s in multiple locations.
- 300-500, 3250s, Covered Hoppers located off of various class 1s in multiple locations.
- 140, 60ft, Boxcars located off of various class 1s in multiple locations.
- 150, 29.2K, DOT117R Tanks located off of various class 1s in multiple locations.
- 100-300, 3400, Covered Hoppers located off of various class 1s in multiple locations.
Call PFL today to discuss your needs and our availability and market reach. Whether you are looking to lease cars, lease out cars, buy cars, or sell cars call PFL today at 239-390-2885
PFL offers turn-key solutions to maximize your profitability. Our goal is to provide a win/win scenario for all and we can handle virtually all of your railcar needs. Whether it’s loaded storage, empty storage, subleasing or leasing excess cars, filling orders for cars wanted, mobile railcar cleaning, blasting, mobile railcar repair, or scrapping at strategic partner sites, PFL will do its best to assist you. PFL also assists fleets and lessors with leases and sales and offers Total Fleet Evaluation Services. We will analyze your current leases, storage, and company objectives to draw up a plan of action. We will save Lessor and Lessee the headache and aggravation of navigating through this rapidly changing landscape.
PFL IS READY TO CLEAN CARS TODAY ON A MOBILE BASIS WE ARE CURRENTLY IN EAST TEXAS
Live Railcar Markets
| CAT | Type | Capacity | GRL | QTY | LOC | Class | Prev. Use | Clean | Offer | Note |
|---|
