
“Discipline is choosing what you want most over what you want now.” – Unknown Author
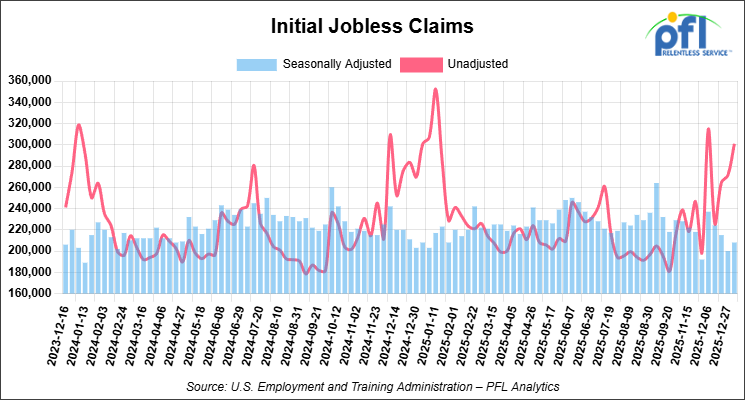
Jobs Update
- Initial jobless claims seasonally adjusted for the week ending January 3, 2026, came in at 208,000, versus the adjusted number of 200,000 people from the week prior, up 8,000 people week over week.
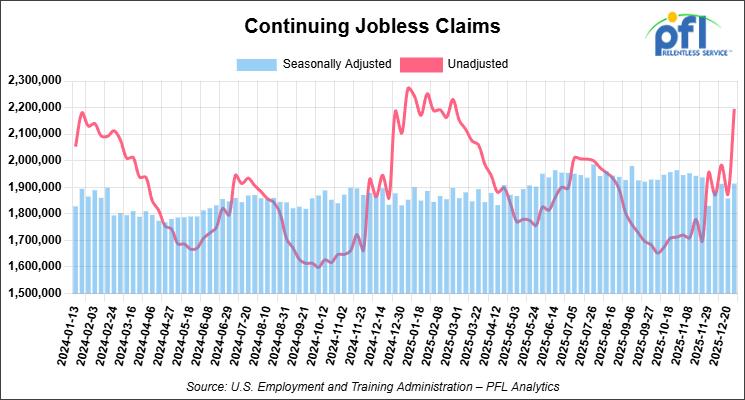
- Continuing jobless claims came in at 1,914,000, versus the adjusted number of 1,858,000 people from the week prior, up 56,000 week-over-week.
Stocks closed higher on Friday of last week and higher week-over-week
The DOW closed higher on Friday of last week, up 237.96 points (0.48%), closing out the week at 49,504.07, up 1,121.68 points week-over-week. The S&P 500 closed higher on Friday of last week, up 44.82 points (0.65%), and closed out the week at 6,966.28, up 107.81 points week-over-week. The NASDAQ closed higher on Friday of last week, up 191.33 points (0.81%), and closed out the week at 23,671.35, up 435.72 points week-over-week.
In overnight trading, DOW futures traded higher and are expected to open at 49,373 this morning, down 353 points from Friday’s close.
Crude oil closed higher on Friday of last week and higher week-over-week
West Texas Intermediate (WTI) crude closed up $1.36 per barrel (2.35%), to close at $59.12 on Friday of last week, up $1.80 cents per barrel week-over-week. Brent crude closed up $1.35 per barrel (2.18%), to close at $63.34, up $2.59 per barrel week-over-week.
One Exchange WCS (Western Canadian Select) for February delivery settled on Friday of last week at US$14.75 below the WTI-CMA (West Texas Intermediate – Calendar Month Average). The implied value was US$42.85 per barrel.
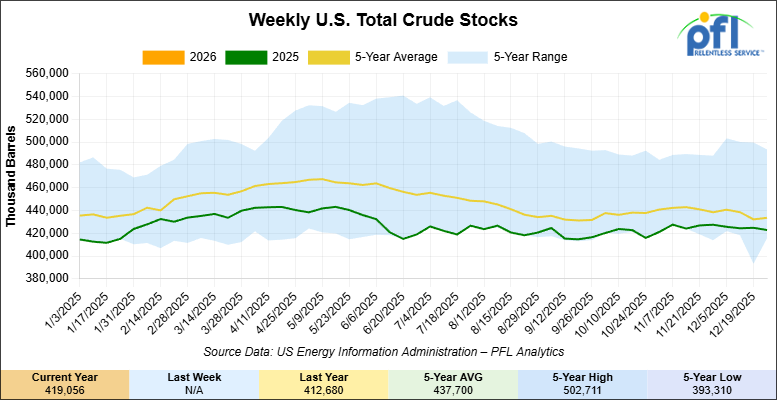
U.S. commercial crude oil inventories (excluding those in the Strategic Petroleum Reserve) decreased by 3.8 million barrels week-over-week. At 419.1 million barrels, U.S. crude oil inventories are 3% below the five-year average for this time of year.
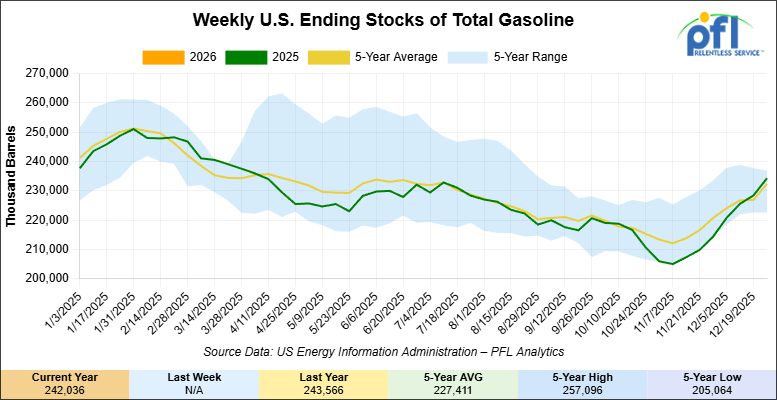
Total motor gasoline inventories increased by 7.7 million barrels week-over-week and are 3% above the five-year average for this time of year.
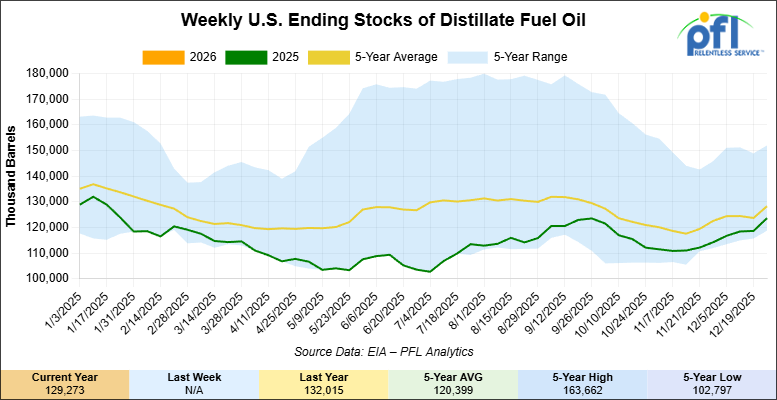
Distillate fuel inventories increased by 5.6 million barrels week-over-week and are 3% below the five-year average for this time of year.
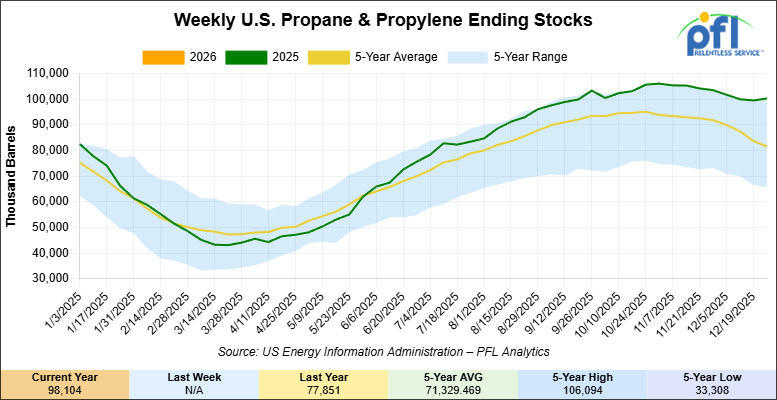
Propane/propylene inventories decreased 2.2 million barrels week–over-week and are 29% above the five-year average for this time of year.
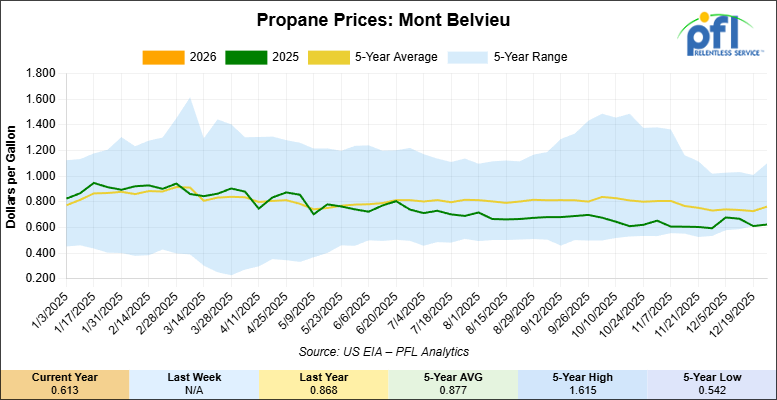
Propane prices closed at 61.3 cents per gallon on Friday of last week, down 1.1 cents per gallon week-over-week, and down 25.5 cents year-over-year.
Overall, total commercial petroleum inventories increased by 8.1 million barrels week-over-week, during the week ending January 2, 2026.
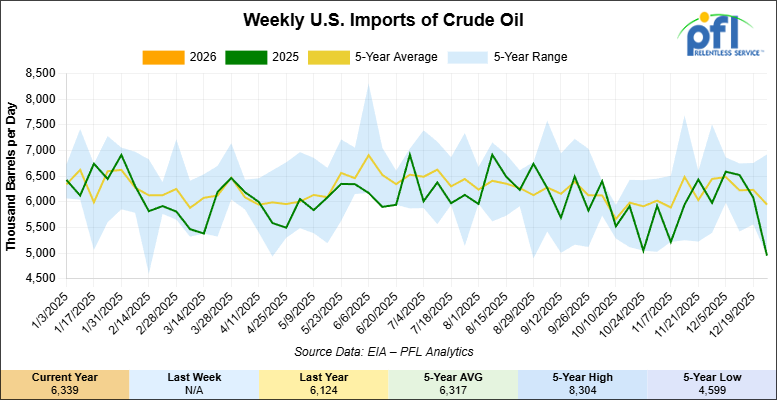
U.S. crude oil imports averaged 6.3 million barrels per day during the week ending January 2, 2026, an increase of 1.4 million barrels per day week-over-week. Over the past four weeks, crude oil imports averaged 6 million barrels per day, 9.7% less than the same four-week period last year. Total motor gasoline imports (including both finished gasoline and gasoline blending components) averaged 549,000 barrels per day, and distillate fuel imports averaged 207,000 barrels per day during the week ending January 2, 2026.
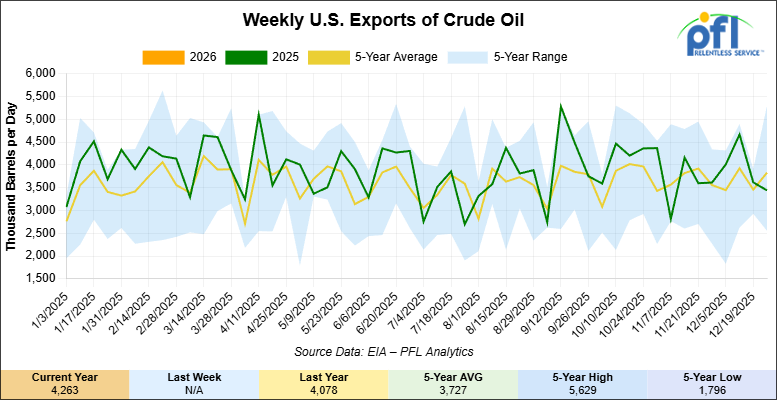
U.S. crude oil exports averaged 4.263 million barrels per day during the week ending January 7, 2026, an increase of 823,000 barrels per day week-over-week. Over the past four weeks, crude oil exports averaged 3.996 million barrels per day.
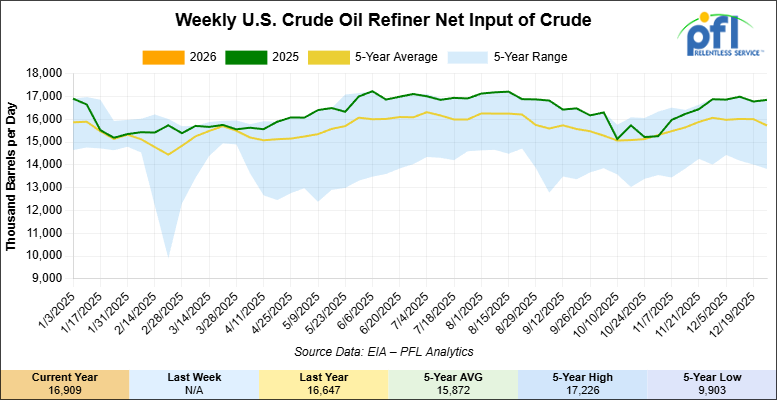
U.S. crude oil refinery inputs averaged 16.9 million barrels per day during the week ending January 2, 2026, which was 62,000 barrels per day more week-over-week.
WTI futures are poised to open at $58.57, down $0.55 from Friday’s close.
North American Rail Traffic
Week Ending January 7, 2026
Total North American weekly rail volumes were up (+1.99%) in week 2, compared with the same week last year. Total Carloads for the week ending January 7, 2026 were 284,761, up (+4.38%) compared with the same week in 2024, while weekly Intermodal volume was 255,363, down (-0.54%) year over year. 5 of the AAR’s 11 major traffic categories posted year-over-year decreases. The largest decrease came from Motor Vehicles and Parts (-28.19%), while the largest increase was Coal (+23.56%).
In the East, CSX’s total volumes were up (+3.78%), with the largest decrease coming from Motor Vehicles and Parts (-35.24%), while the largest increase came from Grain (+36.10%). NS’s total volumes were up (+0.50%), with the largest increase coming from Petroleum & Petroleum Products (+50.54%), while the largest decrease came from Motor Vehicles and Parts (-31.61%).
In the West, BNSF’s total volumes were up (+6.16%), with the largest increase coming from Grain (+23.00%), while the largest decrease came from Motor Vehicles and Parts (-22.50%). UP’s total volumes were up (+1.50%), with the largest increase coming from Coal (+25.94%), while the largest decrease came from Motor Vehicles and Parts (-18.73%).
In Canada, CN’s total volumes were down (-1.93%), with the largest increase coming from Grain (+69.94%), while the largest decrease came from Motor Vehicles and Parts (-38.13%). CPKCS’s total volumes were down (-9.03%), with the largest increase coming from Coal (+62.52%), while the largest decrease came from Forest Products (-55.67%).
Source Data: AAR – PFL Analytics
North American Rig Count Summary
Rig Count
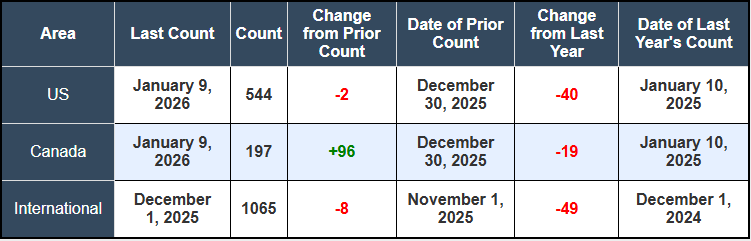
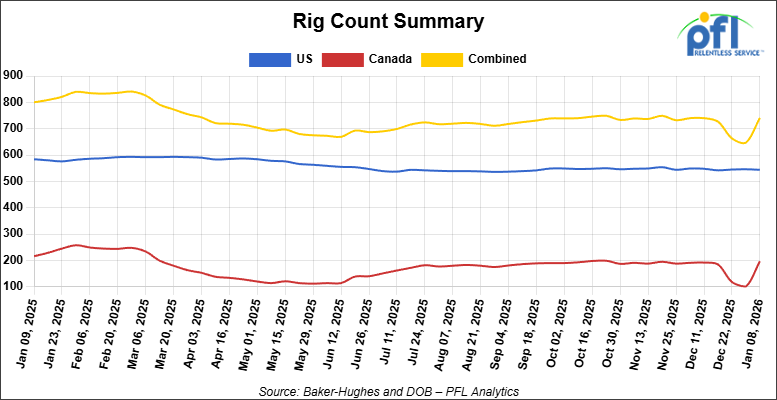
North American rig count was up by +94 rigs week-over-week. The U.S. rig count was down by -2 rigs week-over-week, and down by -40 rigs year-over-year. The U.S. currently has 544 active rigs. Canada’s rig count was up by +96 rigs week-over-week, but down by -19 rigs year-over-year. Canada currently has 197 active rigs. Overall, year-over-year we are down by -59 rigs collectively.
We are watching a few things out there for you:
We are Watching Petroleum Carloads
The four-week rolling average of petroleum carloads carried on the six largest North American railroads fell to 28,391 from 29,082, which was a decrease of -691 rail cars week-over-week. Canadian volumes were higher. CPKC’s shipments were higher by +9.0% week-over-week, CN’s volumes were higher by +8.0% week-over-week. U.S. shipments were mostly higher. The NS had the largest percentage increase and was up by +22.0%. The BNSF was the sole decliner and was down by -3.0%.
We are Watching Geopolitical Oil Risk
Crude markets face renewed supply uncertainty last week as large-scale protests continued in Iran last week affecting its economy and the energy sector. Large demonstrations -the most significant since 2009 – have forced shutdowns of petrochemical plants due to gas supply shortages, and the Iranian Rial has collapsed to record lows at 1.47 million to the dollar.
President Trump issued direct warnings that the Iranian regime will “pay hell” if protesters are killed, injecting geopolitical risk premium into the market. With Iran producing more than three million barrels per day, disruption concerns are legitimate. Options market trading in crude futures shows call skew at its highest level since June, indicating traders are actively hedging against sudden price spikes.
West Texas Intermediate closed the week at $59.12 per barrel, up $1.80 from the prior week and Brent futures closed over $63 per barrel on the back of the continued pretests. Geopolitical volatility sustains the premium valuations currently embedded in long-haul transportation rates, particularly on longer-duration Canadian crude movements where hedging via alternative logistics gains value during uncertain periods.
We are Watching the SPR
The Trump Administration is pursuing an unconventional path to replenish the Strategic Petroleum Reserve without direct congressional appropriations. At the Goldman Sachs Energy Conference on Tuesday of last week, U.S. Energy Secretary Chris Wright disclosed plans to negotiate deals with private oil companies that would generate crude barrels and route them into SPR storage without requiring any government cash outlay.
The current SPR holds approximately 401 million barrels – roughly 60 percent of designed capacity.
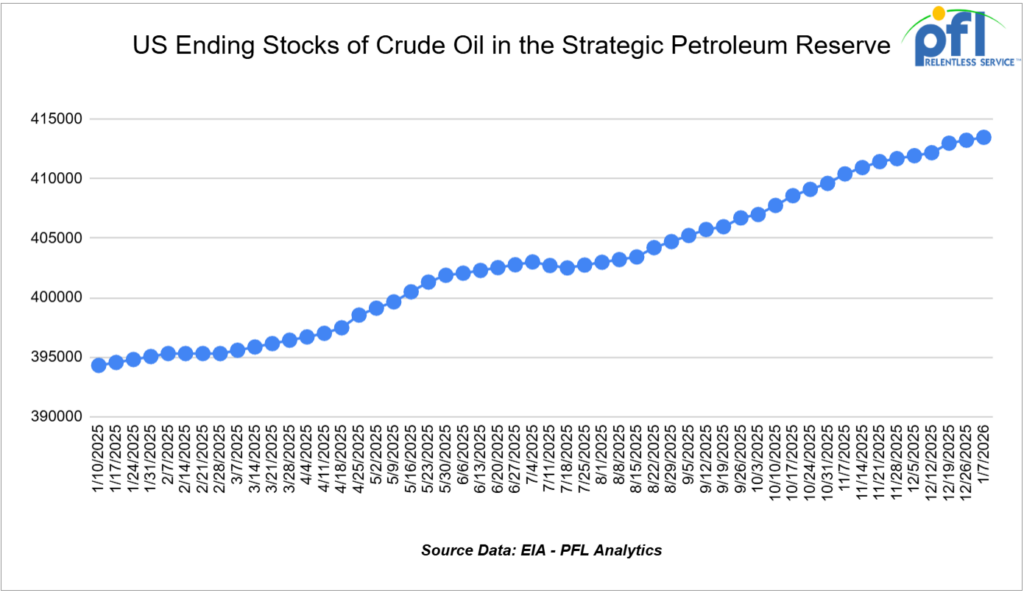
Achieving Trump’s stated goal of filling the reserve “right to the top” would require acquiring an additional 280 million barrels, at an estimated cost exceeding $16 billion at current market prices. The administration indicated that additional details regarding the oil acquisition program will be released within the next year.
A SPR Reserve in Freeport, Texas
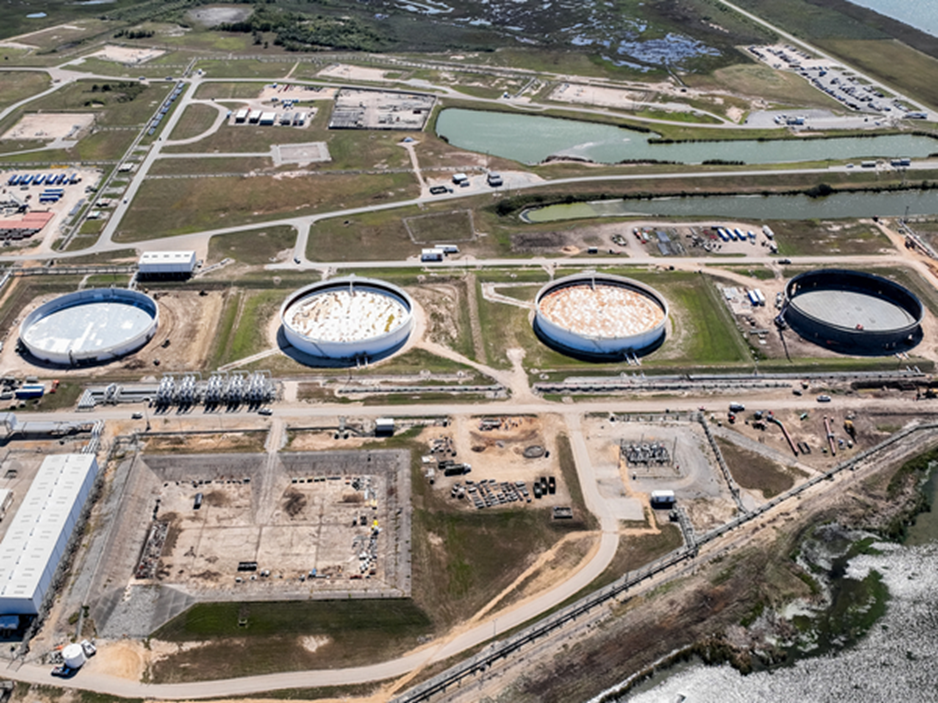
Source: EIA – PFL Analytics
The Treasury has one formal mechanism already in motion: Congress allocated $171 million last year (a reduction from an initial $1.3 billion proposal) to purchase crude for SPR. Additionally, oil companies have committed to returning 13 million barrels of long-term crude loans to the SPR by year-end. These routine purchases alone will bring SPR levels up only modestly, leaving the reserve at approximately 60 percent capacity even after all current commitments are fulfilled.
The administration’s preference for “creative” structures echoes historical precedent. Former President George W. Bush in 2001 created a royalty-in-kind program where U.S. Gulf producers paid government royalties in the form of oil delivered directly to SPR. That program operated until 2009 when the Department of Energy identified improper relationships between program staff and oil industry employees. The Trump Administration’s model will likely differ in structure, but serves the same objective: bypassing appropriations gridlock while increasing strategic inventory.
SPR refill activity, regardless of mechanism, supports sustained demand for crude logistics and potentially incentivizes new crude-by-rail movements if producers take advantage of favorable pricing windows to book SPR deliveries.
We are Watching Alberta
Alberta last week launched a centralized project hub tied to a proposed oil pipeline to Canada’s northwest coast, signaling renewed provincial interest in export diversification beyond existing U.S.-bound infrastructure. The hub’s stated objective is to align early technical work and move toward a formal federal project submission by mid-2026.
Critical caveats accompany the announcement. There is no approved route, no construction start date, and no committed shipper volumes. The initiative is structured as private-sector-led with the government playing a facilitation role rather than a capital provider or operator. Projects of this scale and regulatory complexity involving Indigenous consultation, environmental review, potential court challenges, and multi-year permitting routinely require a decade or longer to advance from the conceptual stage to operation.
The pipeline’s strategic logic is compelling. Western Canadian crude production continues to grow alongside recent pipeline expansions, however takeaway capacity relative to production tightens quickly when crude prices strengthen or refining demand rebounds. Existing systems run at full capacity faster than expected, exposing producers to pricing discounts and logistics congestion risk. A northwest coast pipeline would eventually provide a direct outlet to Pacific refining centers and Asian markets, reducing reliance on a single export path and enhancing producer optionality.
The multi-year lag between project initiation and operation directly sustains crude-by-rail demand. Historical precedent demonstrates that when pipeline capacity lags production growth, rail volumes do not vanish; they remain steady or increase as shippers seek flexibility and market access. Canadian Producers have shown they do not slow crude output while infrastructure sits in planning stages. Instead, storage, staging, and rail movements become strategic tools, not backup plans. During the pipeline’s approval and construction timeline, rail remains the only transportation mode capable of scaling quickly (subject to rail car availability) without new environmental or regulatory permits.
At least for now, from a U.S. perspective, the extended infrastructure timeline in Alberta supports continued cross-border crude rail movements into U.S. Gulf Coast and Midwest refineries.
We are Watching Crude Transportation Rates
Petroleum Transportation rates remained relatively stable last week, with modest pressure from lower crude prices balancing against supply tightness in select regions.
Canadian Crude-by-Rail: Rates from Alberta to the U.S. Gulf Coast held steady at $15.39 per barrel, unchanged week over week, indicating stable logistics costs despite near-term price volatility. Western Canadian Select crude at Hardisty posted a $14.75 per barrel discount to CMA Nymex, approximately $2.35 wider than a month earlier. This discount widening reflects tightening pipeline capacity from Alberta combined with seasonal demand softness coupled with higher production possibly creating opportunities for producers to examine rail optionality when price differentials favor incremental transportation cost.
Trans Mountain Pipeline and Pacific Movements: The 890,000 barrel-per-day Trans Mountain system accepted all January nominations from shippers, yet the expanded system continues to operate below full capacity. Market participants noted softer demand from Asia-Pacific for Canadian heavy crude during the January trading cycle, partly reflecting the absence of major Shandong refiner Yulong, which has ceased operations. Yulong previously purchased three to five cargo lots of the approximately 25 heavy crude shipments exported monthly.
Refined Products and Market Structure: U.S. Gulf Coast medium-range tanker spot rates rose to their highest level in over one month following the holiday season, as market participants positioned for Q1 maintenance season within the Gulf refining complex. U.S. Gulf Coast refinery utilization reached 98.6 percent on January 2nd- the highest level since June 2023 – but historical data indicate utilization typically drops 20 percentage points between early and late February as seasonal maintenance begins.
We are Watching Trans-Pacific Container Shipping
Container rates on major trans-Pacific trade lanes strengthened significantly last week, with carriers’ general rate increases taking effect and pre-Lunar New Year demand supporting pricing resilience.
Eastbound trans-Pacific rates (China-U.S. West Coast) increased 22%to $2,617 per forty-foot equivalent unit and are now more than 30%higher than mid-December levels. East Coast rates climbed 12% to $3,757 per FEU after a 20% gain month over month.
The rate recovery reflects shippers positioning inventory ahead of the Lunar New Year holiday in mid-February, when Chinese factories close for several weeks. Unlike several general rate increase attempts during Q4 of 2025, which subsequently retreated as the market tested pricing, current GRI levels have held firm, suggesting that underlying demand is supporting higher rate structure.
Asia-Europe and Asia-Mediterranean rates also posted significant gains, with Mediterranean prices increasing 20 percent to $4,800 per FEU and rising 23 to 45 percent since mid-December. While ample retail inventories in the U.S. are expected to temper January volumes approximately 10% below year-ago levels, ongoing capacity additions among ocean carriers are forecast to weaken trans-Pacific rates year-on-year, despite seasonal strength.
We are Watching the STB
In a significant deregulation move, the Surface Transportation Board announced on Thursday of last week a proposed rulemaking that would fundamentally reshape rail competition and shipper access. The unanimous decision calls for repealing 49 C.F.R. part 1144, which has governed reciprocal switching restrictions since 2001.
The current framework has proven exceptionally rigid. Under existing regulations, no rail customer has ever successfully obtained reciprocal switching, a stark indicator that regulatory barriers have effectively blocked competitive options. The proposed NPRM would replace prescriptive rules with case-by-case STB review, allowing shippers to petition for access to secondary carriers at nearby rail interchange points where geographic or operational feasibility exists.
STB Chairman Patrick Fuchs framed the initiative as alignment with statutory intent and market principles: “This proposal would embrace market forces, enable meaningful choice for American businesses as provided under the statutes, and eliminate regulatory barriers unnecessarily stifling rail competition.” The rule change flows from the Department of Justice’s Anticompetitive Regulations Task Force, established in March 2025 following Executive Order 14192.
The American Chemistry Council, a major freight shipper constituency, strongly praised the proposal. ACC officials noted that reciprocal switching provides captive shippers – those served by a single railroad with no practical alternative – access to competitive service options at interchanges. The council explicitly stated that current restrictions have “failed” and that case-specific review offers genuine competitive relief.
Comment periods are tight. Interested parties must submit comments by March 10th and reply comments by April 24th. If reciprocal switching becomes viable, shippers gain leverage to negotiate alternative routing for refined products and specialty chemicals, potentially fragmenting long-haul unit train movements into smaller, multi-carrier shipments. Simultaneously, expanded competitive access may pressure per-car lease rates on commodity routes while supporting premium pricing on specialized services where single-carrier operation remains optimal.
We are Watching Canadian Grain
Canadian National reported on Thursday of last week that December 2025 grain movements set a new monthly record, continuing an unprecedented streak. CN transported 2.82 million metric tonnes of grain from Western Canada in December alone, exceeding the previous December 2020 record by 80,000 tonnes.
The full-year 2025 performance was equally noteworthy. CN moved 31.3 million metric tonnes from Western Canada during 2025, surpassing the previous annual record. When including Eastern Canadian grain, CN’s total 2025 grain movement reached 32.7 million metric tonnes, breaking 2024’s previous all-time record of 32.25 million tonnes.
The streak represents four consecutive monthly records and reflects robust harvest conditions, strong export demand, and improved rail operating efficiency. The performance highlights the resilience of rail logistics during periods of sustained commodity supply and export opportunity, contrasting with the softer intermodal and automotive environments that pressured overall traffic in late 2025.
We are Watching the Howard Street Tunnel
CSX announced on January 9th the completion of final paving on the Guilford Avenue Bridge in Baltimore, marking a major milestone in the Howard Street Tunnel modernization project. The historic tunnel, originally constructed in 1895, has been the bottleneck limiting East Coast double-stack intermodal train movements for decades.
CSX finished the tunnel expansion itself in September 2025. The bridge paving work immediately following completion eliminated a critical height constraint. The expanded vertical clearance now permits double-stack intermodal trains to transit the tunnel smoothly, dramatically improving freight efficiency for the Port of Baltimore, regional intermodal operators, and shippers requiring East Coast rail access.
Howard Street Tunnel
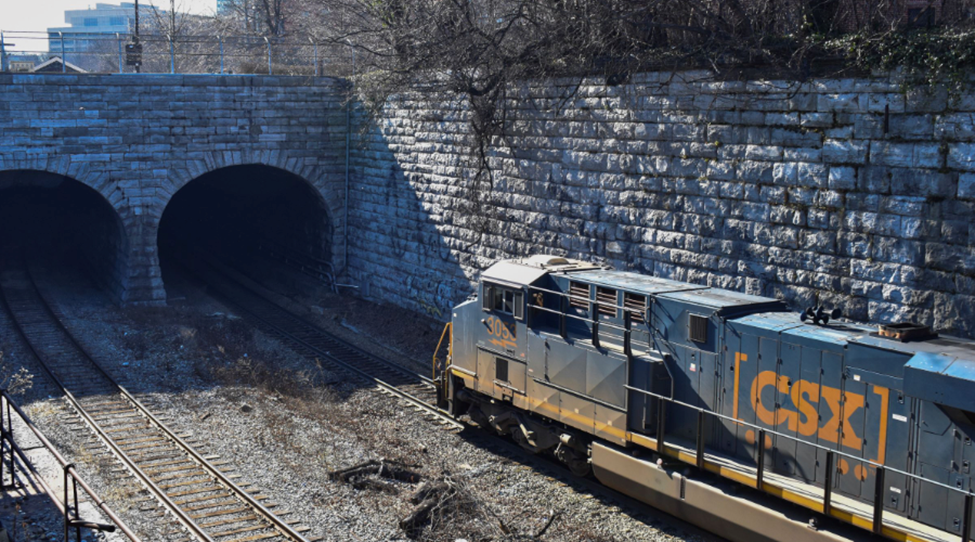
Source: CSX – PFL Analytics
The phased completion strategy “allowed us to avoid major disruptions and keep the project on track for the community and our customers.” The infrastructure investment positions Baltimore as a more competitive gateway for international container movements and domestic intermodal service relative to competing East Coast ports and rail hubs.
Additionally, CSX was named to the CDP “A” List for climate leadership on January 9th, regaining its top climate disclosure score after two years at the B level. CSX is the only Class I railroad to earn this 2026 distinction, placing the company among global environmental leaders in governance and transparency.
The Howard Street milestone represents incremental capacity improvement for competing intermodal and automotive traffic, which can marginally reduce congestion and improve velocity on East Coast rail corridors. The primary impact is on containerized and automotive freight, rather than petroleum logistics, which predominantly flow via unit train and dedicated tank car corridors.
We are watching Key Economic Indicators
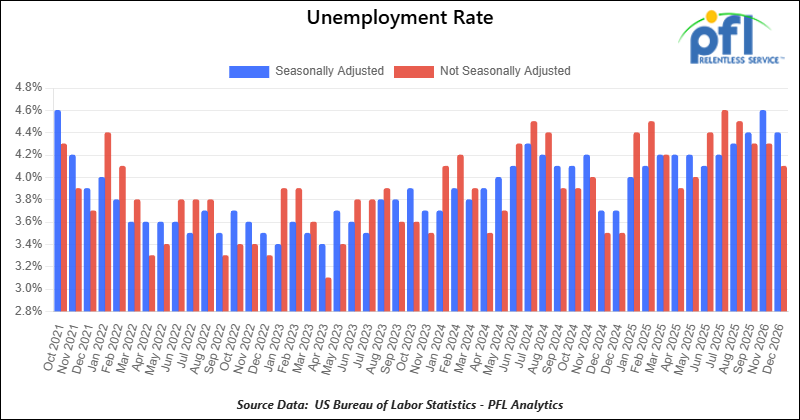
Unemployment Rate
On January 9, 2026, the BLS reported that a preliminary 50,000 net new jobs were created in December 2025. Figures for prior months remain weak, with job gains showing little net change over recent months.
According to the BLS, 2025’s net new job gains have totaled 584,000. The official unemployment rate was 4.4% in December, down slightly month over month.
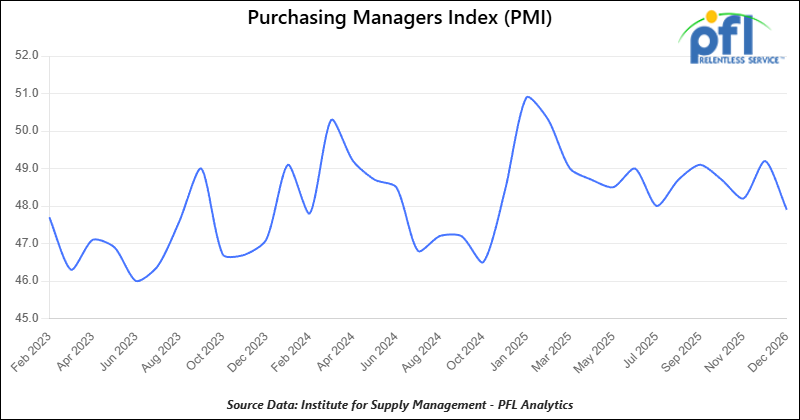
Purchasing Managers Index (PMI)
The Institute for Supply Management releases two PMI reports – one covering manufacturing and the other covering services. These reports are based on surveys of supply managers across the country and track changes in business activity. A reading above 50% on the index indicates expansion, while a reading below 50% signifies contraction, with a faster pace of change the farther the reading is from 50.
The Manufacturing PMI in December was 47.9%, down from 48.2% in November. This remains in contraction territory, marking the tenth straight month below 50%. On the Services PMI side, the most recent reading is 54.4% (December), up from 52.6% in November, signaling continued expansion in the services sector.
Lease Bids
- 30-50, 6000cf Steel Hopper located off of CSX or NS in East. For use in petcoke service. Period: 5 Years.
- 10, 2500CF Open Top Hopper located off of UP or BN in Texas. For use in aggregate service. Period: 5 years. Need Rapid Discharge Doors.
- 100, 21.9K 117J Tank located off of All Class 1s in Midwest. For use in CO2 service. Period: 6 months.
- 30-50, 30K 117J Tank located off of NS or CSX in Northeast. For use in C5 service. Period: 1 year.
- 60, 33K 340W Tank located off of BNSF in UT/AZ. For use in Propane service. Period: Trip Lease.
Sales Bids
- 28, 3400CF Hopper Covered located off of UP BN in Texas. For use in Cement service.Cement Gates needed.
- 20, 17K Tank DOT111 located off of various class 1s in various locations. For use in corn syrup service.
- 120, Various Gondola Open-Top Aluminum Rotary located off of various class 1s in various locations. For use in Sulphur service.Built 2004 or later.
- 30, 29K Tank DOT111 located off of various class 1s in Chicago. For use in Veg Oil service.
Lease Offers
- 100, 30K CPC1232 Tanks located off of UP or BN in Texas. Last used in Diesel.
- 100, 30K DOT117J Tanks located off of UP or BN in Texas. Last used in Gasoline.
- 100, 29K DOT117J Tanks located off of UP or BN in Texas. Last used in Gasoline. Coiled and Insulated.
- 36, 6351 Covered Hopper located off of CN in Wisconsin. Last used in Grain. through 2/27.
- 29, 6580 Covered Hopper located off of CN in Wisconsin. Last used in Grain. through 2/26.
- 18, 6580 Covered Hopper located off of CN in Wisconsin. Last used in Grain. through 2/27.
- 9, 5400 Covered Hopper located off of CN in Wisconsin. Last used in Grain. through 2/27.
- 21, 6351 Covered Hopper located off of CN in Wisconsin. Last used in DDG. Available until February 2027.
- 29, 6500 Covered Hopper located off of CN in Wisconsin. Last used in DDG. Available until February 2027.
- 50, 5380 Covered Hopper located off of UP or BN in Houston. Last used in Fertilizer. Cars are currently clean. Available until February.
- 50, 20K DOT117J Tank located off of All Class 1s in Moving. Last used in Styrene.
- 29, 25.5K DOT117J Tank located off of UP or BN in Texas. Cars are currently clean. Cars are currently clean.
- 90, 30K DOT117J Tank located off of UP or BN in Corpus Christie. Last used in Diesel.
Sales Offers
- 21, 50′ Boxcar Plate Cs located off of various class 1s in NM. End of Life.
- 3, 50′ Boxcar Plate Cs located off of various class 1s in multiple locations. End of Life.
- 27, 50′ Boxcar Plate Cs located off of various class 1s in PQ. End of Life.
- 100, 3250 Covered Hoppers located off of various class 1s in multiple locations. Sand Cars.
- 5, 2740 Mill Gondolas located off of various class 1s in NC. End of Life.
- 1, 2260 Mill Gondolas located off of various class 1s in AL. End of Life.
- 30, 2740 Mill Gondolas located off of various class 1s in multiple locations. End of Life.
- 21, 2740 Mill Gondolas located off of various class 1s in WA. End of Life.
- 9, 4750 Covered Hoppers located off of various class 1s in multiple locations. End of Life.
- 5, 4750 Covered Hoppers located off of various class 1s in multiple locations. End of Life.
- 50, 31.8K Tank CPC 1232s located off of UP or BN in TX. Requal Due in 2025.
- 100, 4600CF Open Top Hoppers located off of BN or CSX in Southeast. N/A.
Call PFL today to discuss your needs and our availability and market reach. Whether you are looking to lease cars, lease out cars, buy cars, or sell cars call PFL today at 239-390-2885
Live Railcar Markets
| CAT | Type | Capacity | GRL | QTY | LOC | Class | Prev. Use | Offer | Note |
|---|
PFL will be at the Following Conferences

- Where: La Quinta, CA
- Attending: David Cohen (954-729-4774)
- Conference Website

- Where: Hyatt Regency Dallas in Dallas, TX
- Attending:Curtis Chandler (239.405.3365), David Cohen (954-729-4774), Brian Baker (239.297.4519), Cyndi Popov(403) 402-5043
- Conference Website