
“If people like you, they’ll listen to you, but if they trust you, they’ll do business with you.”
— Zig Ziglar
Jobs Update
Initial and Continuing Jobless Claims
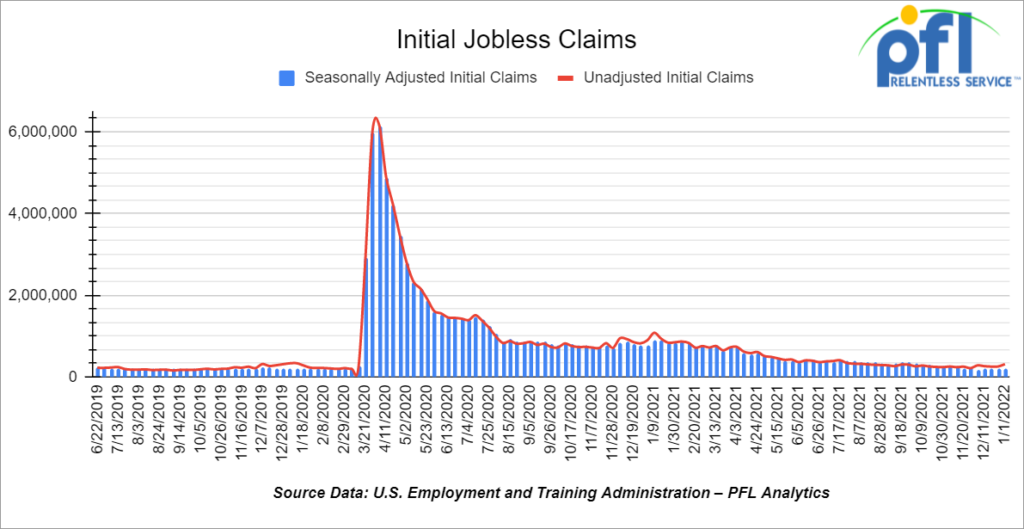
- Initial jobless claims for the week ending January 1st came in at 207,000, up 7,000 people week over week.
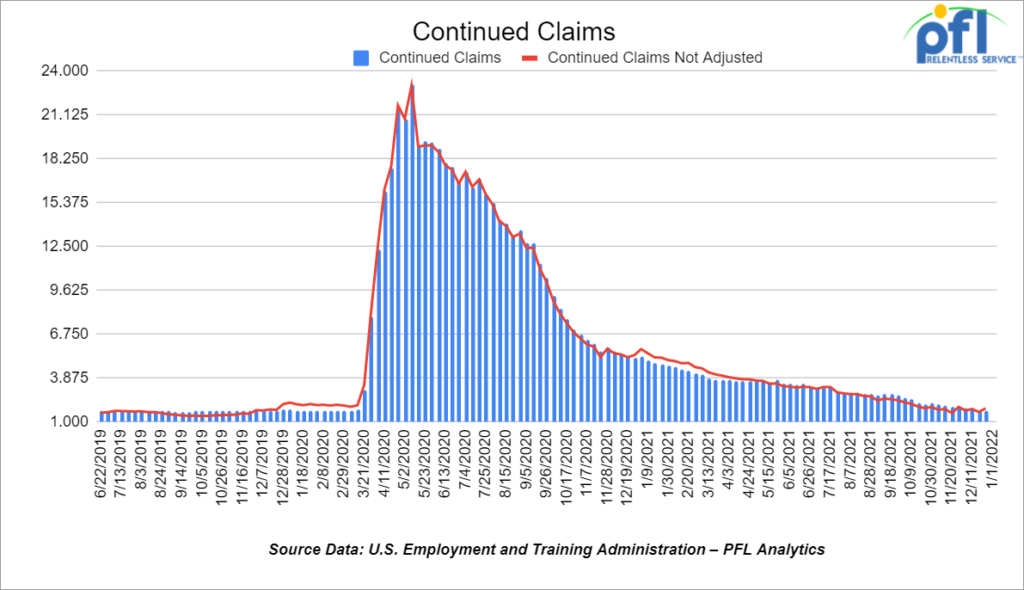
- Continuing claims came in at 1.754 million people versus the adjusted number of 1.718 million people from the week prior, up 36,000 people week over week.
Stocks closed lower on Friday of last week and lower week over week
The DOW closed lower on Friday of last week, down -4.81 points (-.01%), closing out the week at 36, 231.66 points, down -106.64 points week over week. The S&P 500 closed lower on Friday of last week, down -19.02 points (-.41 %) and closed out the week at 4,677.03, down -89.15 points week over week. The Nasdaq closed lower on Friday of last week, down -144.98 points (-.96%) and closed out the week at 14,935.90, down -717.50 points week over week.
In overnight trading, DOW futures traded higher and are expected to open at 36,124 this morning up 17 points.
Oil closed down on Friday of last week but up week over week on Geopolitical Concerns
Oil prices edged lower on Friday as the market weighed supply concerns from the unrest in Kazakhstan and outages in Libya against a U.S. jobs report that missed expectations and its potential impact on Federal Reserve policy. West Texas Intermediate (WTI) crude closed down -56 cents a barrel on Friday of last week to settle at $79.80 per barrel (-0.07%) but up +$2.81 a barrel week over week, while Brent futures closed down -24 cents (-0.03%) per barrel to settle at $81.75 per barrel, up $2.43 per barrel week over week.
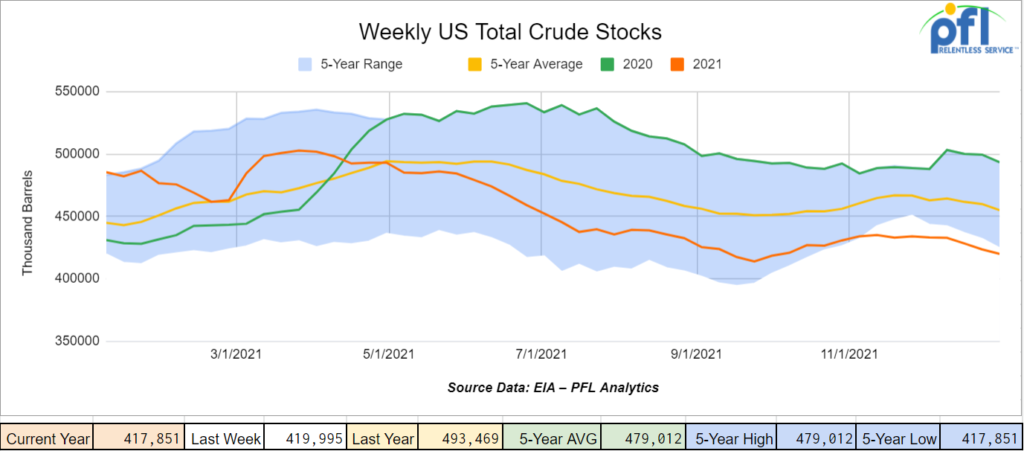
U.S. commercial crude oil inventories (excluding those in the Strategic Petroleum Reserve) decreased by 2.1 million barrels week over week. At 417.9 million barrels, U.S. crude oil inventories are 8% below the five-year average for this time of year.
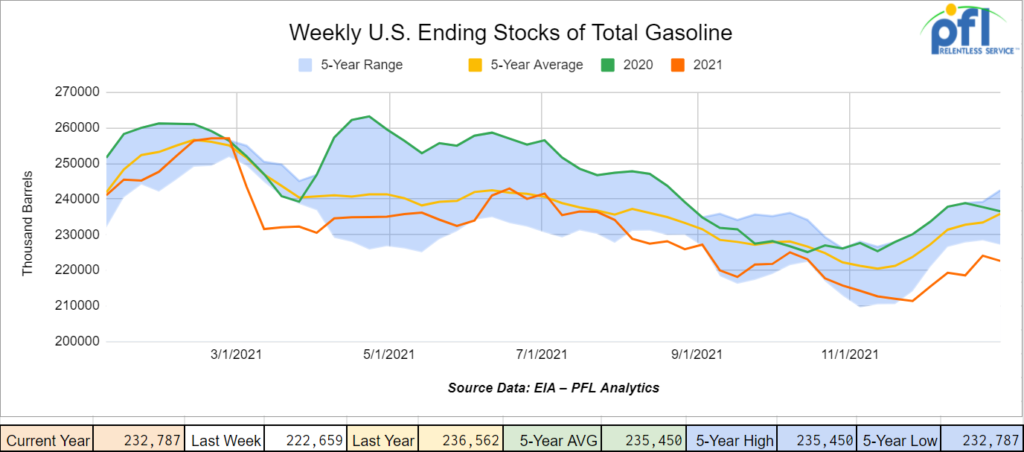
Total motor gasoline inventories increased by 10.1 million barrels week over week and are 4% below the five-year average for this time of year.
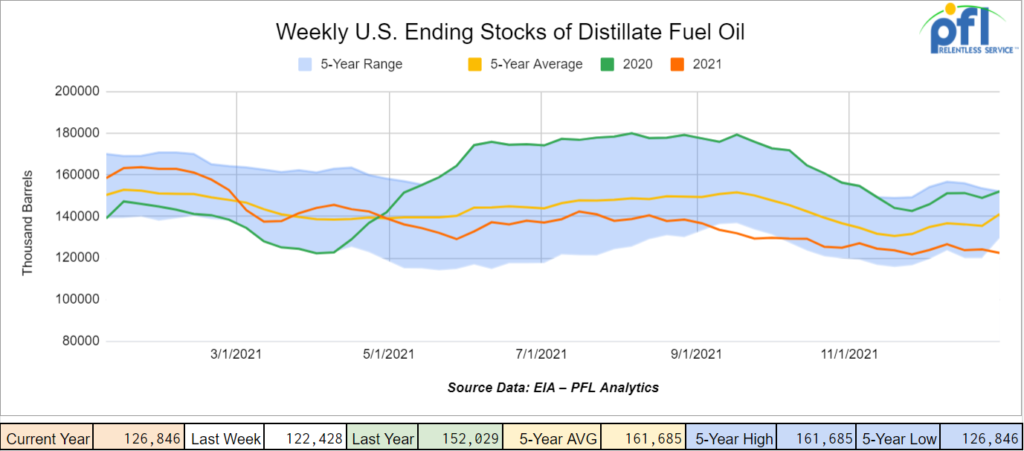
Distillate fuel inventories increased by 4.4 million barrels week over week and are 16% below the five year average for this time of year.
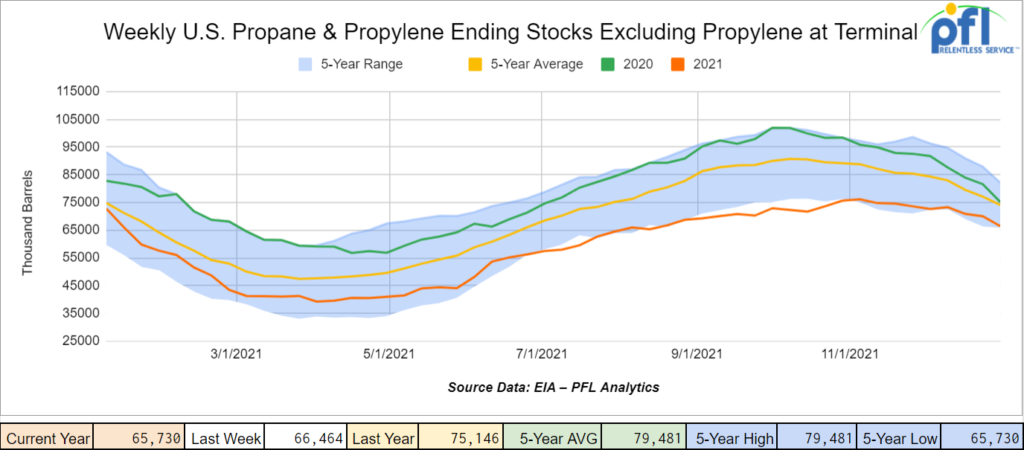
Propane/propylene inventories decreased by 700,000 barrels week over week and are 7% below the five-year average for this time of year.
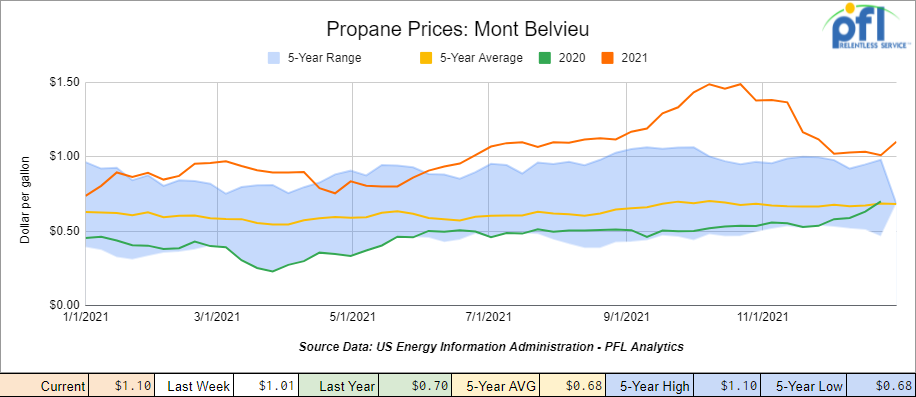
Propane prices were up 9 cents per gallon week over week, closing at $1.10 per gallon as cold weather hit North America with a vengeance.
Overall, total commercial petroleum inventories increased by 10.2 million barrels last week.
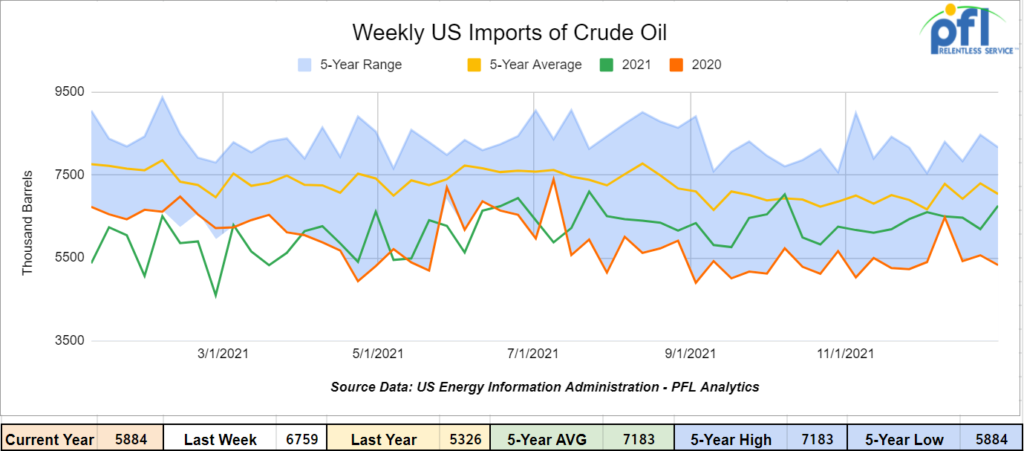
U.S. crude oil imports averaged 5.9 million barrels per day for the week ending December 31, 2021, a decrease of 900,000 barrels per day for the week over week. Over the past four weeks, crude oil imports averaged 6.3 million barrels per day, 16.7% more than the same four-week period last year. Total motor gasoline imports (including both finished gasoline and gasoline blending components) averaged 596,000 barrels per day, and distillate fuel imports averaged 217,000 barrels per day for the week ending December 31, 2021..
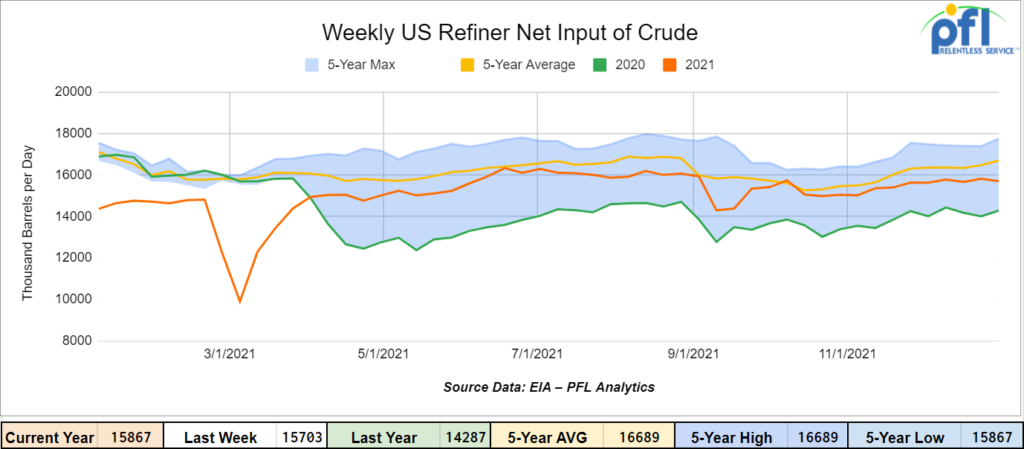
U.S. crude oil refinery inputs averaged 15.9 million barrels per day during the week ending December 31, 2021 which was 163,000 barrels per day more week over week. Refineries operated at 89.8% of their operable capacity for the week ending December 31, 2021.
As of the writing of this report, WTI is poised to open at $78.83 , down 7 cents per barrel from Thursday’s close.
North American Rail Traffic
Total North American rail volumes were down 8.4% year over year in week 52 (U.S. -6.3%, Canada -20.9%, Mexico +26.2%) resulting in fourth quarter 2021 volumes that finished down 5.0% and 2021 volumes that finished up 4.5% year over year (U.S. +5.7%, Canada +0.6%, Mexico +4.7%). 7 of the AAR’s 11 major traffic categories posted year over year declines with the largest decreases coming from intermodal (-13.5%) and grain (-26.2%). The largest increase came from nonmetallic minerals (+12.7%).
In the East, CSX’s total volumes were up 0.5%, with the largest increase coming from intermodal (+3.7%). NS’s total volumes were down 4.1%, with the largest decrease coming from intermodal (-9.9%). The largest increase came from coal (+17.1%).
In the West, BN’s total volumes were down 10.7%, with the largest decreases coming from intermodal (-18.0%) and grain (-25.1%). The largest increase came from coal (+8.2%). UP’s total volumes were down 6.5%, with the largest decreases coming from intermodal (-17.2%) and grain (-32.2%). The largest increases came from coal (+15.4%) and stone sand & gravel (+34.9%).
In Canada, CN’s total volumes were down 17.0%, with the largest decreases coming from intermodal (-21.0%) and grain (-50.9%). Revenue per ton miles were down 24.2%. CP’s total volumes were down 20.9%, with the largest decreases coming from farm products (-77.6%), coal (-38.2%), intermodal (-10.6%) and grain (-31.9%). Revenue per ton miles were down 27.0%.
KCS’s total volumes were down 2.1%, with the largest decrease coming from petroleum (-53.1%).
Source Data: Stephens
Rig Count
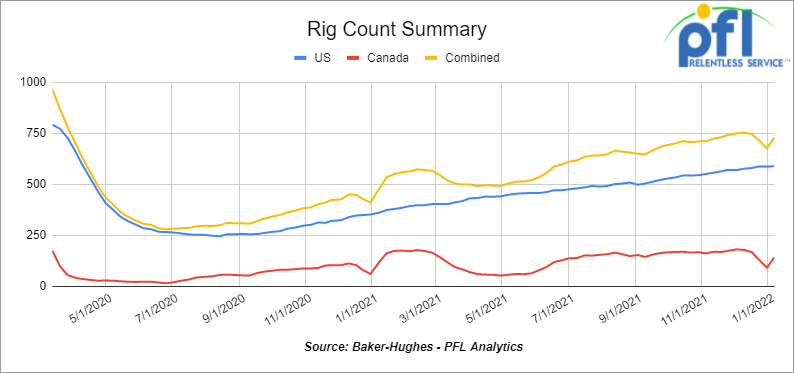
North American rig count is up by 53 rigs week over week. The U.S. rig count was up by 2 rigs week over week and up by 228 rigs year over year. The U.S. currently has 588 active rigs. Canada’s rig count was up by 51 rigs week over week and up by 24 rigs year over year and Canada’s overall rig count is 141 active rigs. Overall, year over year, we are up 252 rigs collectively.
International rig count which comes out monthly is up by 17 rigs month over month and up 169 rigs year over year. Internationally there are 834 active rigs.
North American Rig Count Summary

A few things we are keeping an eye on:
Petroleum Carloads
The four-week rolling average of petroleum carloads carried on the six largest North American railroads declined to 24,139 from 25,056, a loss of 917 rail cars week over week. Canadian volumes were down: CP volumes were down by 30.5% and CN volumes were down by 16.9% week over week. U.S. volumes were mostly higher with the CSX having the largest percentage increase (up by 19.4%) and the BN having the largest percentage decrease (down by 10.2%).
Earthquake Hits Permian Basin
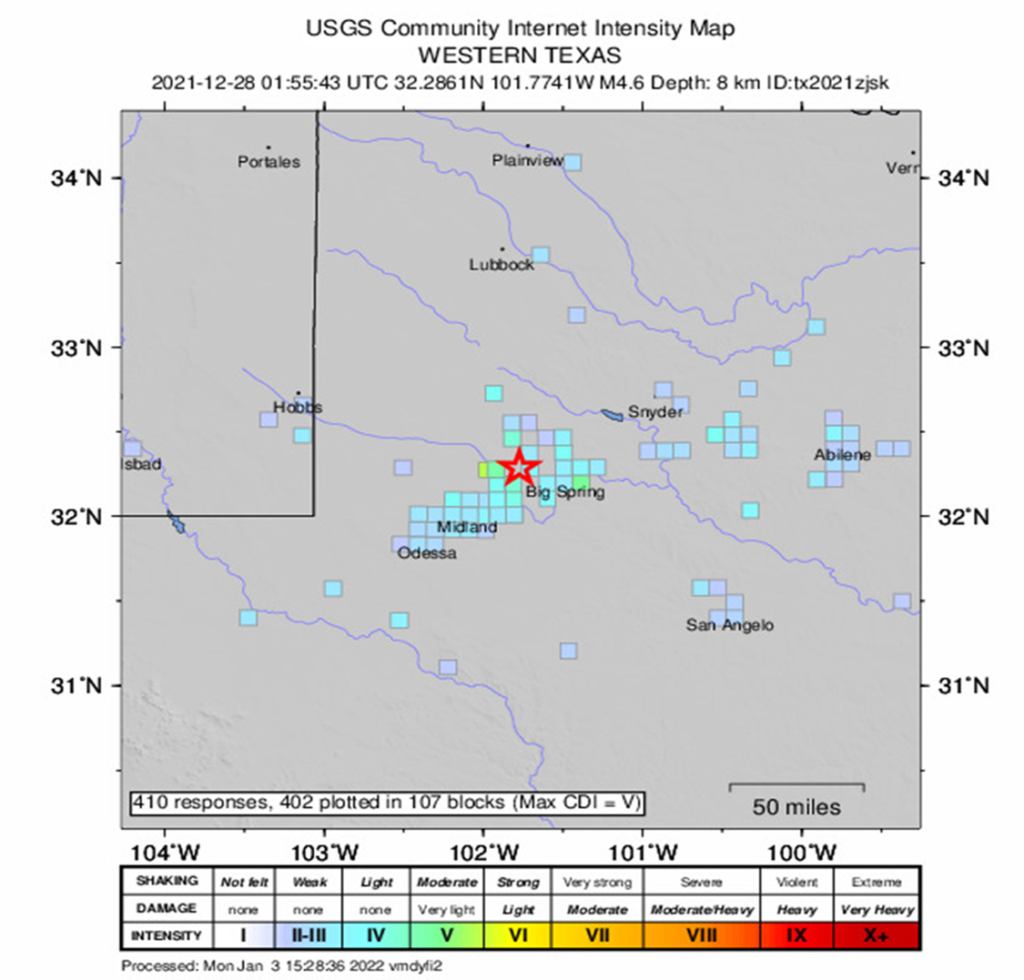
An earthquake of 4.5 magnitude struck near Stanton in West Texas on Monday of last week, the U.S. Geological Survey (USGS) reported. The quake struck at a depth of 7.8 km (4.8 miles), the USGS said. The earthquake happened in the Permian Basin, home of the largest shale oil and gas field. This was the second strongest earthquake in West Texas in the last 10 years. After a series of smaller earthquakes in recent months, the state’s energy regulator, Texas Railroad Commission, in September set limits on the volume of wastewater that oil and gas producers could inject underground.
Senator Ted Cruz Wants Sanctions Slapped on Russia on Nord Stream Line 2
The U.S. State Department said that a bill being pushed by Republican Senator Ted Cruz to slap sanctions on the Nord Stream 2 natural gas pipeline would undermine the united front in response to Russia, spokesperson Ned Price said on Thursday.
“Our concern is that, if passed, the legislation would only serve to undermine unity amongst our European allies at a crucial moment when we need to present a unified front in response to Russian threats against Ukraine.”
Cruz struck a deal with Democrats last month to get a vote before Jan. 14 on the Russia-to-Germany natural gas pipeline in exchange for lifting his hold on dozens of Democratic President Joe Biden’s ambassador nominations.
Under the deal, Cruz’s bill, which would impose measures on the pipeline under previous mandates, would need 60 votes to pass, a hurdle in the 50-50 Senate, where bipartisanship is scarce.
Canada’s Export volumes and Production Numbers Surge Crude by Rail Down
Canada exported a record amount of crude oil to the U.S. Gulf Coast last month driven by more pipeline capacity into the region and strong Asian demand. Shipments jumped to more than 266,000 per barrel in December after averaging over 180,000 through the year.
The recent reversal of Marathon Pipe Line Inc.’s Capline pipeline has allowed more crude to reach the U.S. Gulf Coast and in turn shipped to other countries. India has been the leading destination, followed by China and then South Korea.
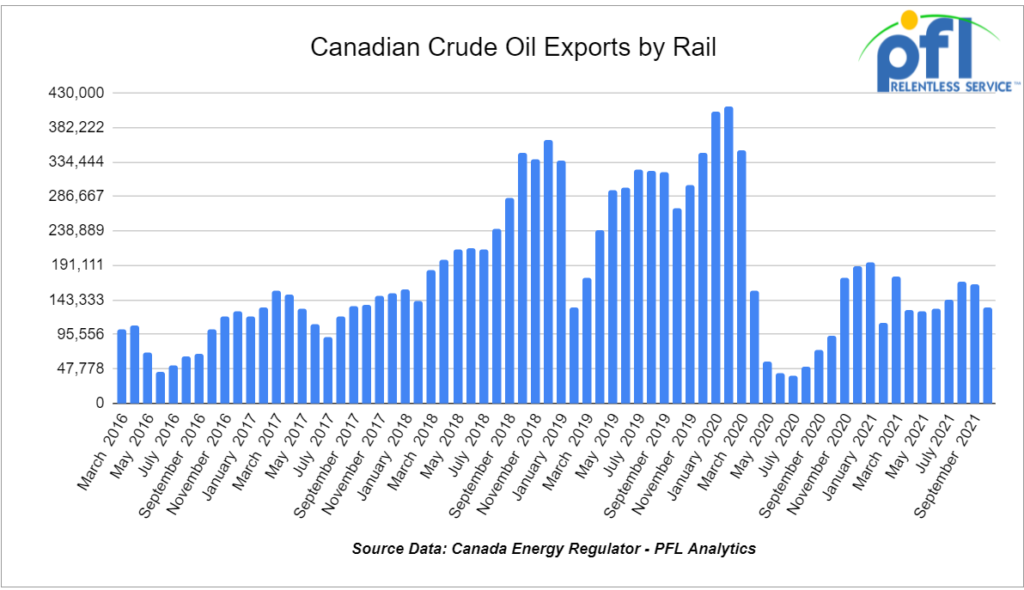
The development marks a sea change for Canada’s oil industry — the country holds the third highest reserves in the world, but exports to markets beyond the U.S. have been limited due to a lack of infrastructure. Canadian crude exports to the U.S. Gulf Coast averaged just 25,000 barrels per day in 2018, before rising to average roughly 70,000 barrels per day in both 2019 and 2020. “Looking ahead, Canadian crude exports into the U.S. Gulf should continue to show strength,” With Venezuelan crude exports having fallen dramatically in recent years and now with the prospect of Mexican crude being taken off the market by the Mexican government who wants Pemex to refine more, Canadian crude appears to be one of the leading beneficiaries. In October, overall Canadian shipments of oil to the U.S. jumped to more than 4 million barrels per day, it’s highest volume since the start of the year thanks in part to the startup of Enbridge Inc.’s Line 3 replacement project. Crude by rail on the other hand month over month (September over October) dropped from 164,180 barrels per day to 132,587 barrels per day according to the Canadian Energy Regulator.
Some Key Economic Indicators
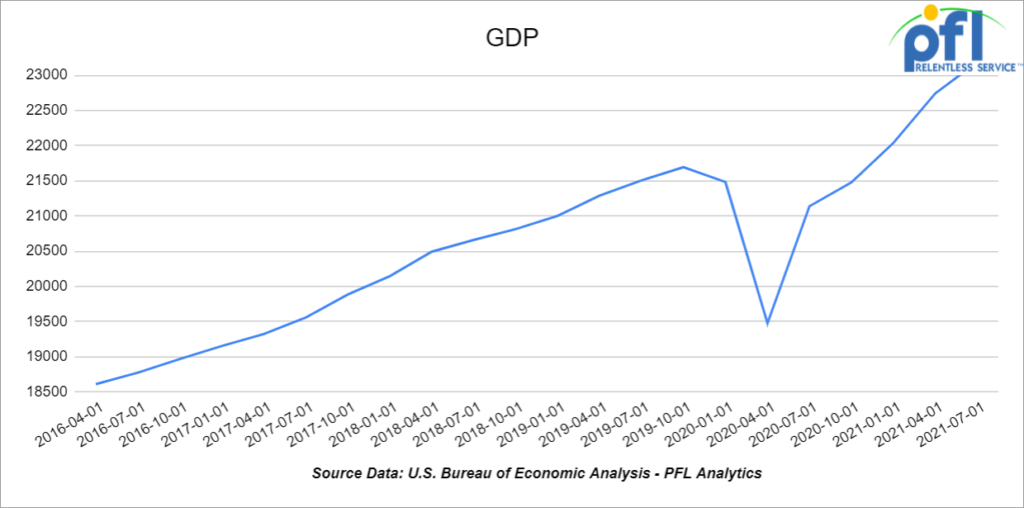
Gross Domestic Product (“GDP”) Going into 2021, there was uncertainty as with everything else how GDP would measure up. At the time, most economists expected growth of 3.5% for the year. The first official estimate from the Bureau of Economic Analysis (BEA) won’t be released until January 27, but most economists think GDP actually grew around 5% in 2021.
As we start 2022, though, uncertainty remains. Consumer spending accounts for 70% of GDP. Inflation is another cause of economic uncertainty as 2022 gets underway. Through November 2021, the year-over-year increase in the consumer price index has been 5%.
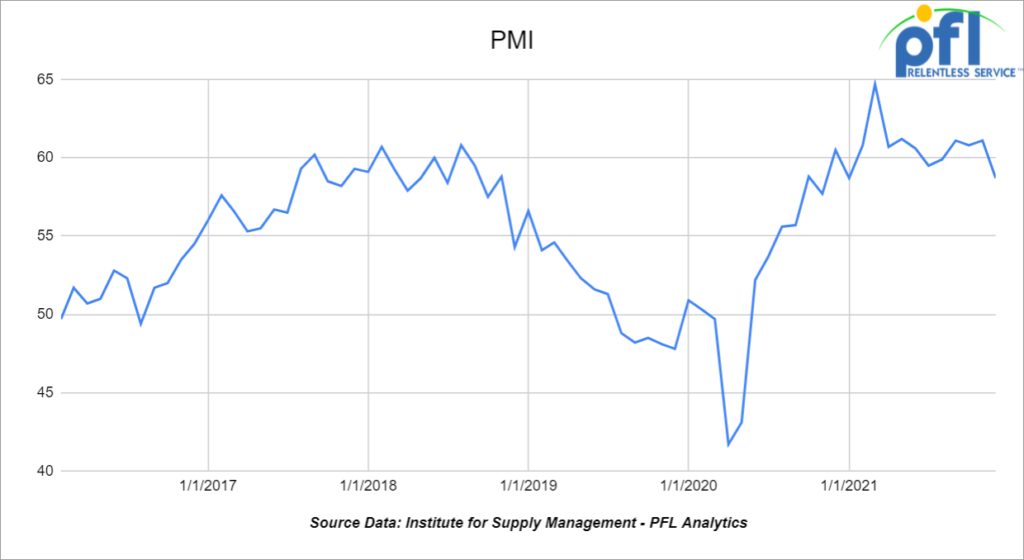
Purchasing Managers Index (“PMI”) – The PMI (which covers manufacturing) and the Services PMI (covering services) are both from the Institute for Supply Management. They are based on surveys of supply managers around the country. The surveys track the direction of changes in business activity. An index reading above 50% indicates expansion; below 50% means contraction. The more above or below 50, the faster the pace of change.
The PMI fell from 61.1% in November to 58.7% in December. The last time it was that low was January 2021. The new orders component of the PMI fell to 60.4% in December from 61.5% in November
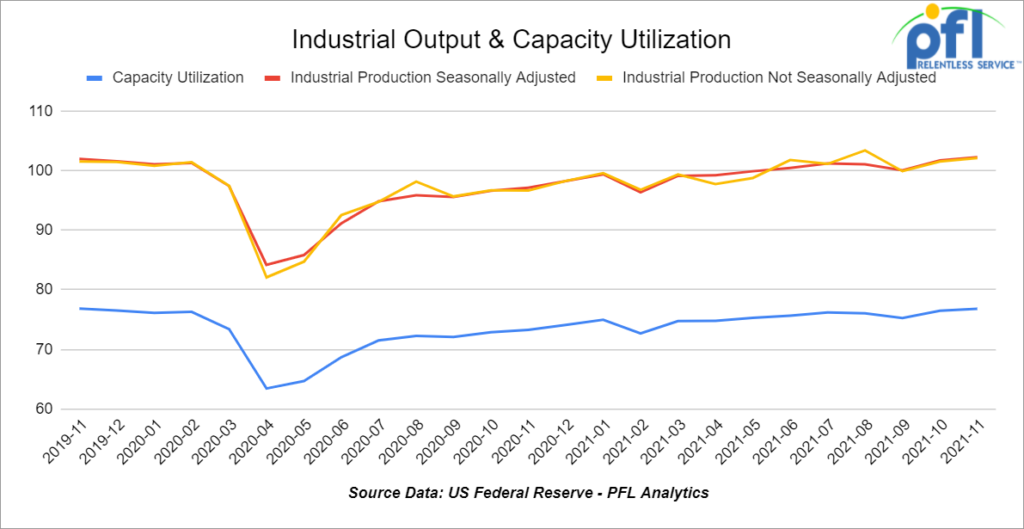
Industrial Output and Capacity Utilization – Total U.S. industrial production rose a preliminary 0.5% in November 2021 over October 2021, the eighth month-to-month increase in the first 11 months of 2021. Total output in November 2021 was 5.3% higher than in November 2020 and its highest level since September 2019. Manufacturing output, which is around 75% of total output, rose a preliminary 0.7% in November, its sixth increase in 2021 through November. Manufacturing output in November was the highest since January 2019.
Auto output rose 2.2% in November after a 10.1% gain in October. It was 5.4% lower than a year earlier. Excluding autos, manufacturing output rose 0.6% in November following a 0.8% gain in October.
Capacity utilization is meant to capture the highest output a plant or industry can maintain assuming a realistic work schedule, normal downtime, and sufficient availability of inputs to operate the capital in place. Utilization above 82%-85% is generally considered “tight.” The farther below this level, the more slack there is.
Total U.S. capacity utilization in November was a preliminary 76.8%, up from a 76.5% in October and the highest it’s been in two years. Still, in November it was 2.8 percentage points below its long-run average. Capacity utilization for manufacturing was 77.3% in November, its highest since December 2018 but also materially below its long-run average.
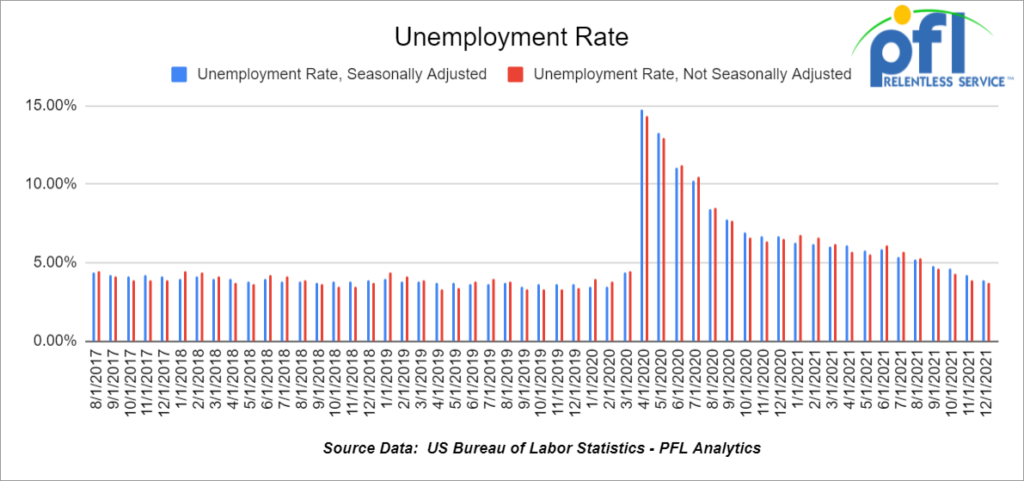
U.S. Unemployment Rate – On January 7, the Bureau of Labor Statistics (BLS) announced that a preliminary and seasonally adjusted 199,000 net new jobs were created in December 2021. That’s down from a revised 249,000 in November and about half what most economists were expecting.
The official unemployment rate fell to 3.9% in December 2021 from 4.2% in November 2021. That’s close to the 3.5% pre-pandemic low and far below December 2020’s 6.7%. December’s job gains were unexpectedly (and disappointingly) low if for no other reason than firms need so many workers. Today’s labor market is all about finding workers to fill open slots. A separate BLS report released January 4 found there were 10.6 million job openings in November, or a record 1.6 job openings for every officially unemployed person.
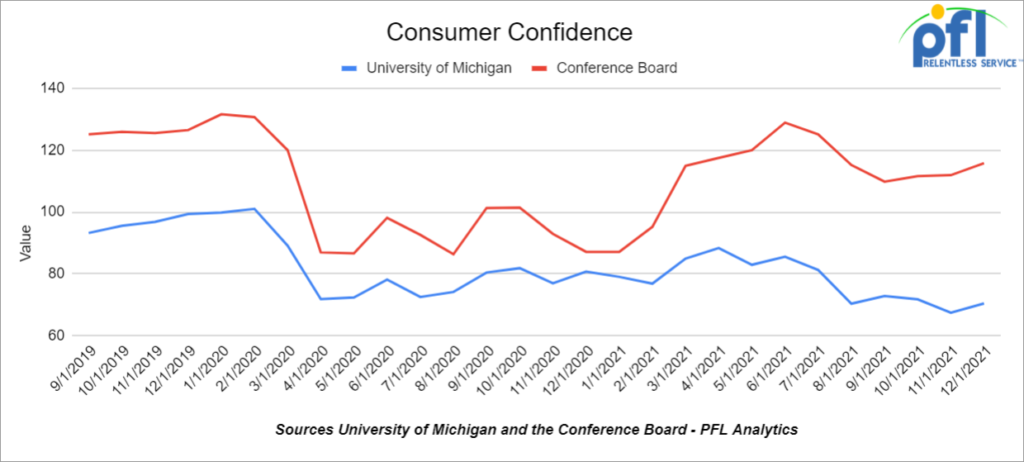
Consumer Confidence – The index of consumer confidence from the Conference Board was 115.8 in December, up from 111.9 in November and its highest level since July 2021. For all of 2021, the index averaged 112.7. That’s a big improvement from 2020’s average of 101.0, but well below 2019’s 128.3 and 2018’s 130.2.
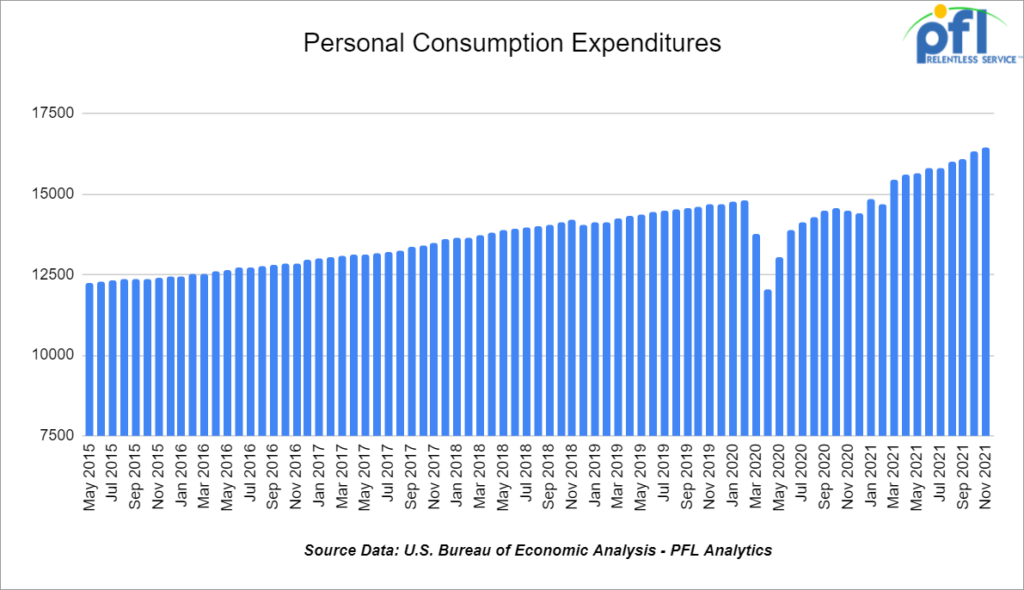
Consumer Spending – Total consumer spending not adjusted for inflation rose a preliminary 0.6% in November 2021 over October 2021, down from a 1.4% gain in October from September. In November, spending on goods was up 0.1%, the least in four months; spending on services was up 0.9%, the most in four months.
Adjusted for inflation, total consumer spending was flat in November from October, its worst inflation-adjusted performance in four months.
We have been extremely busy at PFL with return on lease programs involving rail car storage instead of returning cars to a shop. A quick turnaround is what we all want and need. Railcar storage in general has been extremely active. Please call PFL now at 239-390-2885 if you are looking for rail car storage, want to trouble shoot a return on lease scenario or have storage availability. Whether you are a car owner, lessor or lessee or even a class 1 that wants to help out a customer we are here to “help you help your customer!”
Leasing and Subleasing has been brisk as economic activity picks up. Inquiries have continued to be brisk and strong Call PFL Today for all your rail car needs 239-390-2885
PFL is seeking:
- 50 25.5 Tanks C&I for heavy fuel oil in Texas dirty to dirty 1-2 years negotiable
- 50 29K C&I Tanks for veg oil to purchase – Immediate need
- 20 pressure cars 340’s in SE clean or last in butane or propane 1-2 years Immediate Need
- 15 5200-5500 PD hoppers in the west UP for 5 years for soda ash negotiable
- 30 5800 and 6250 covered gons for sale
- 100 117Js Coiled and Insulated dirty to dirty service BNSF CN or CP
- 50, 5800cuft or larger Covered Hopper for the use in DDG needed in the Midwest for 3-4 years. Immediate need.
- 10 25-28K C&I tanks for veg oil needed in the south for 2 years negotiable
- 10-20 Covered hopper grain cars in the midwest 5200-5500 2-3 years
- 20-30, 19K Tank Cars for Caustic Soda needed in Texas off the UP or BN.
- Unit Train of 28.3K 117Js for use in Crude service off the CN or BN in MT, ND, or Alberta.
- 100-150 340 pressure cars for LPG service in Texas
- 70-90 Biodiesel cars C&I any type car in the midwest or TX 1-2 years
- 15-25, 23.5K cars for chem needed in the South for 1 Year.
- 50 117R 30K+ for gasoline in the midwest CSX or NS for 6 months negotiable
- 100 Moulton Sulfur cars for purchase – any location – negotiable
- 10 DOT111 or 1232 25.5K 286 GRL for Crude Glycerin anywhere in US 1 year lease
- 12 Plate F 286 GRL Boxcars 12’ plug doors midwest preferred for 1 year lease
- 30-50 Log Flats with stanchions 286K GRL in the midwest/east CSX NS 1-3 years negotiable
- 50 Ag Gons 2500-2800cuft 286k GRL in the east CSX for 5 years negotiable
- 25 Covered wood chip Gons 6000CF 286 GRL any location for 1-3 years negotiable
- 25 Boxcars for paper 6000CF 286 GRL 1-3 years anywhere
- 10-20 propane cars needed for a short term lease in ND off the CP.
- 100 15K Tanks 286 for Molten Sulfur in the Northeast CSX/NS for 6 months negotiable
- 200 117Js 28.3 C&I 286 in the North on the CN for 1 year Crude dirty to dirty Negotiable
- 20 5650 PD Hoppers 286s needed in Montana for talc BNSF for 3-5 years
- 100 Open Top Hoppers needed in the Midwest for coal BNSF 1 year
- 100, 5800 Covered Hoppers 286 can be West or East for Plastic 3-5 years
- 50-100, 4750 Covered Hoppers needed for Pet-coke. Can take in the South.
- 70, 117R or J needed for Ethanol for 3 years. Can take in the South.
- 30, 25.5’s or greater food grade Kosher veg oil cars for 6-12 months
- 50, 6500+ cu-ft Mill Gon or Open Top Hopper for wood chips in the Southeast for 5 Years.
- 25 bulkhead flats 286 any class one for up to 5 years Negotiable
- 20, 19,000 Gal Stainless cars in Louisiana UP for nitric acid 1-3 years – Oct negotiable
- 10, 6,300CF or greater covered hoppers are needed in the Midwest.
- 2, 89’ Flat cars for purchase or lease – needed in TX off the BNSF
PFL is offering:
- Various tank cars for lease with dirty to dirty service including, nitric acid, gasoline, diesel, crude oil, Lease terms negotiable, clean service also available in various tanks and locations including Rs 111s, and Js – Selection is Dwindling. Call Today!
- 200 Clean C/I 25.5K 117J in Texas. Brand New Cars!
- 150 117R’s 31.8 clean for lease in Texas – negotiable
- 31.8K Tank Cars last in Diesel. Dirty to dirty in Texas
- 200 117Js 29K OK and TX Clean and brand new – Lined- lease negotiable
- 142 111’s Clean last in gasoline in Texas for lease off the UP – negotiable
- 100 117Rs dirty last in Gasoline in Texas for lease Negotiable
- 90 117Rs 30K located in Alberta CN or CP Refined Products Dirty – negotiable
- 25 BRAND NEW 5161 Sugar Hoppers in Arkansas UP – negotiable
- 99 340W Pressure Cars various locations Butane and Propane dirty negotiable
- 100 73 ft 286 GRL riser less deck, center part for sale,
- 19 auto-max II automobile carrier racks – tri-49 for sale – negotiable
- 10 food grade stainless steel cars
- 20 20K Stainless cars in 3 locations in the south – sale or lease – negotiable
- 30 CPC 1232 25.5K C/I Pennsylvania NS clean negotiable
- 100-150 29K C/I 117J cars for lease. Dirty in Bakken crude and can be returned dirty.
- 100 29K C/I 1232 cars for lease. Dirty in Heavy Crude and can be returned dirty.
- 50 29K 117Js in Nebraska for sale or lease clean last in crude – available Feb 2022
- 100 117Rs 29K clean last used in crude Washington State – price negotiable sale or lease
- 21 111s 29K tanks last in alcohol dirty on the CN in Wisconsin for lease price negotiable
- 100 111s of various volumes and locations last in fuel oil dirty price negotiable
- Various Hoppers for sale and lease 3000-5800 CF 263 and 286 multiple locations negotiable
- 45 Boxcars 60ft Plate F’s Located in Tenn CSX – Lease Negotiable
- 28 20K Veg oil cars for lease in Arkansas – Negotiable
- 100 3200 Covered Hoppers for sale price negotiable
- 100 Center beam Flats with risers 73ft in SD and Iowa for sale negotiable
Call PFL today to discuss your needs and our availability and market reach. Whether you are looking to lease cars, lease out cars, buy cars or sell cars call PFL today 239-390-2885
PFL offers turn-key solutions to maximize your profitability. Our goal is to provide a win/win scenario for all and we can handle virtually all of your railcar needs. Whether it’s loaded storage, empty storage, subleasing or leasing excess cars, filling orders for cars wanted, mobile railcar cleaning, blasting, mobile railcar repair, or scrapping at strategic partner sites, PFL will do its best to assist you. PFL also assists fleets and lessors with leases and sales and offer Total Fleet Evaluation Services. We will analyze your current leases, storage, and company objectives to draw up a plan of action. We will save Lessor and Lessee the headache and aggravation of navigating through this rapidly changing landscape.
PFL IS READY TO CLEAN CARS TODAY ON A MOBILE BASIS WE ARE CURRENTLY IN EAST TEXAS
Live Railcar Markets
| CAT | Type | Capacity | GRL | QTY | LOC | Class | Prev. Use | Clean | Offer | Note |
|---|
