“Do the difficult things while they are easy and do the great things while they are small. A journey of a thousand miles must begin with a single step” – Lao Tzu
Jobs Update
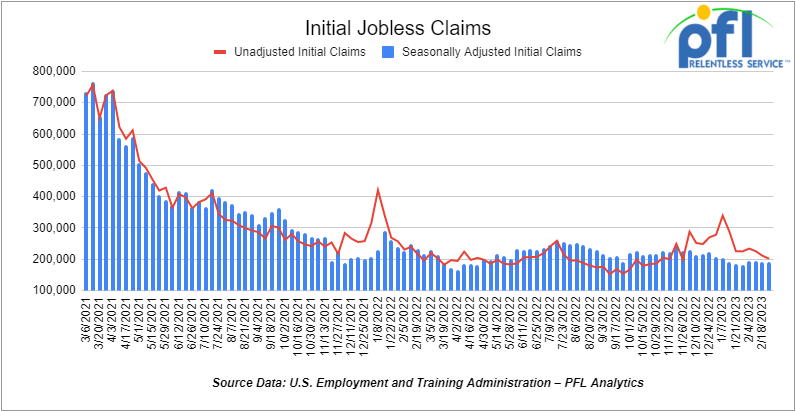
- Initial jobless claims for the week ending February 25th, 2023 came in at 190,000, down -2,000 people week-over-week.
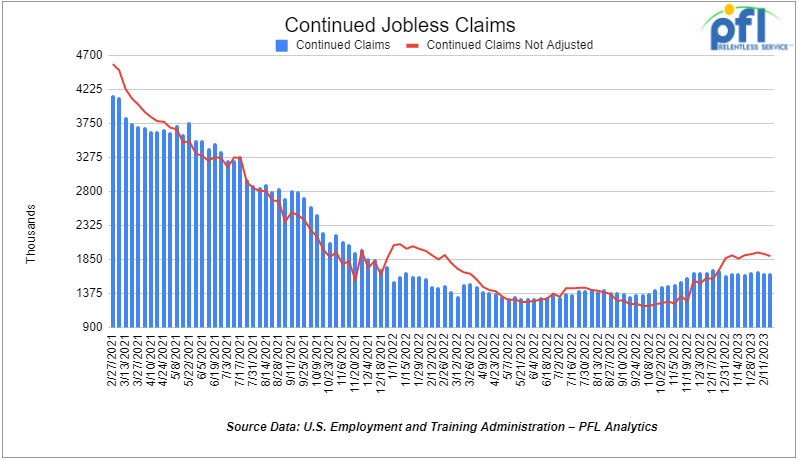
- Continuing jobless claims came in at 1.655 million people, versus the adjusted number of 1.66 million people from the week prior, down -5,000 people week over week.
Stocks closed higher on Friday of last week and up week over week
The DOW closed higher on Friday of last week, up 387.4 points (+1.17%), closing out the week at 33,390.97 up 237.06 points week over week. The S&P 500 closed higher on Friday of last week, up 64.2 points (+1.61%), and closed out the week at 4,045.64, up 75.6 points week over week. The NASDAQ closed higher on Friday of last week, up 226.02 points (+1.98%), and closed the week at 11,689.01, up 294.07 points week over week.
In overnight trading, DOW futures traded higher and are expected to open at 33,416 this morning up 2 points.
WTI closed higher on Friday of last week and up week over week
WTI traded up $0.47 per barrel (+0.6%) to close at $78.16 per barrel on Friday of last week, up $1.84 per barrel week over week. Brent traded up US$0.44 per barrel (+0.5%) on Friday of last week, to close at US$84.75 per barrel, up US$1.59 per barrel week over week.
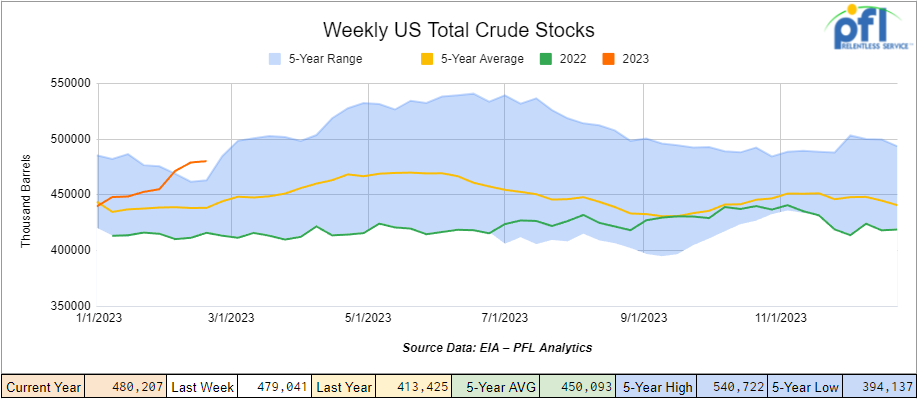
U.S. commercial crude oil inventories (excluding those in the Strategic Petroleum Reserve) increased by 1.2 million barrels week over week. At 480.2 million barrels, U.S. crude oil inventories are 9% above the five-year average for this time of year.
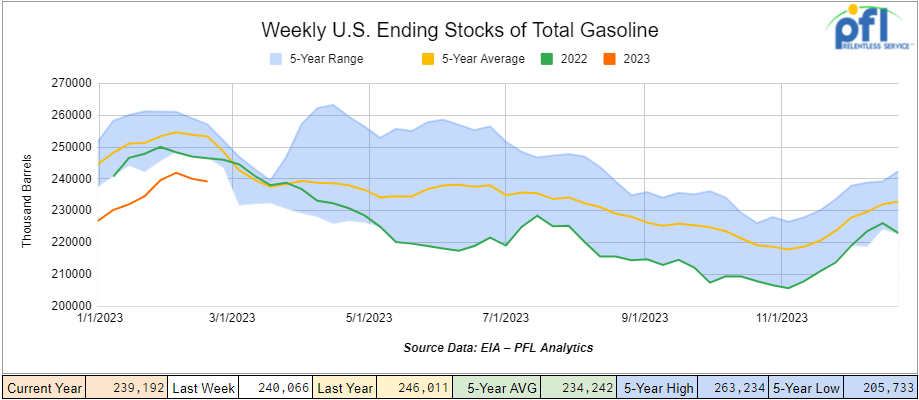
Total motor gasoline inventories decreased by 900,000 barrels week over week and are 5% below the five-year average for this time of year.
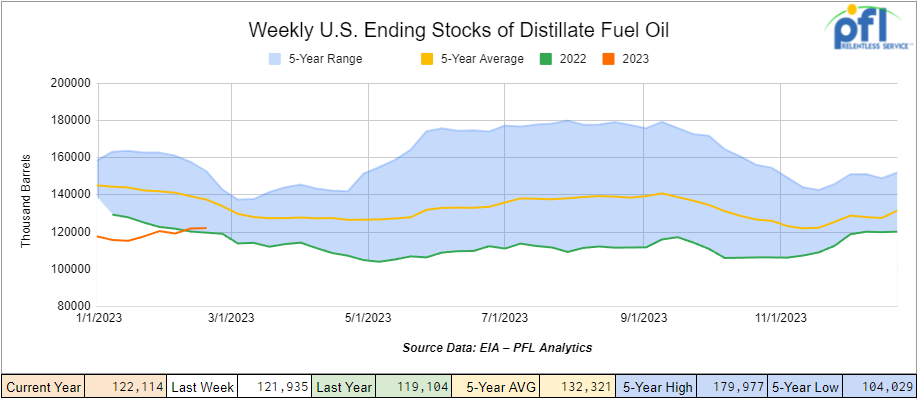
Distillate fuel inventories increased by 200,000 barrels week over week and are 10% below the five-year average for this time of year
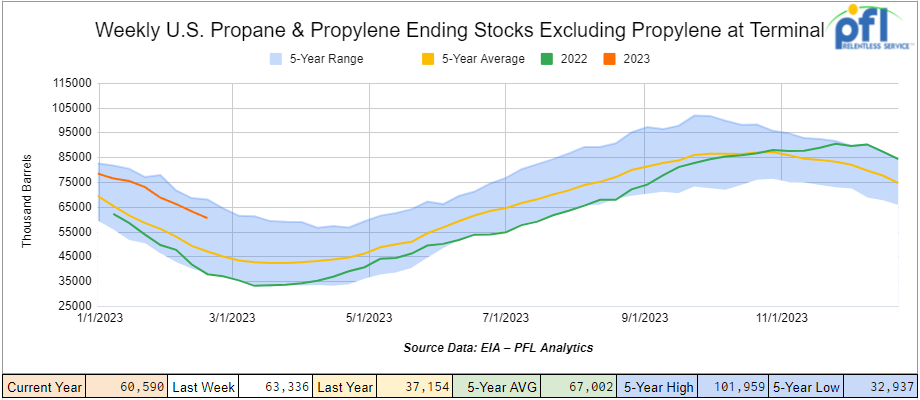
Propane/propylene inventories decreased by 2.7 million barrels week over week and are 30% above the five-year average for this time of year.
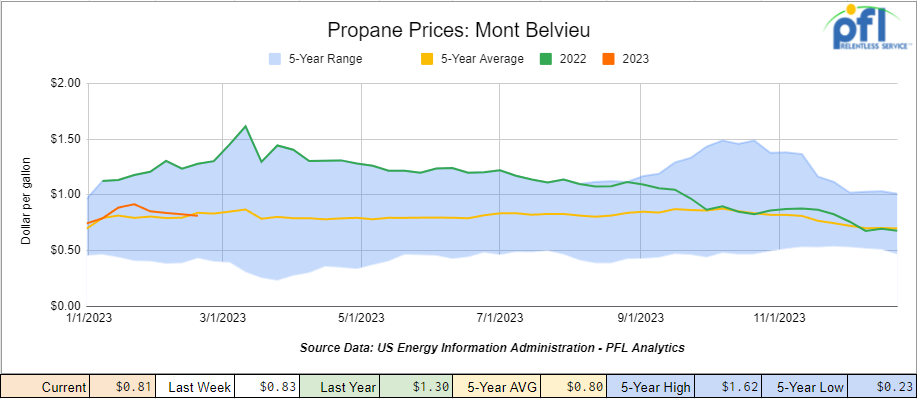
Propane lost 2 cents per gallon week over week, closing at 81 cents a gallon, down 49 cents per gallon year over year.
Overall, total commercial petroleum inventories decreased by 3 million barrels week over week.
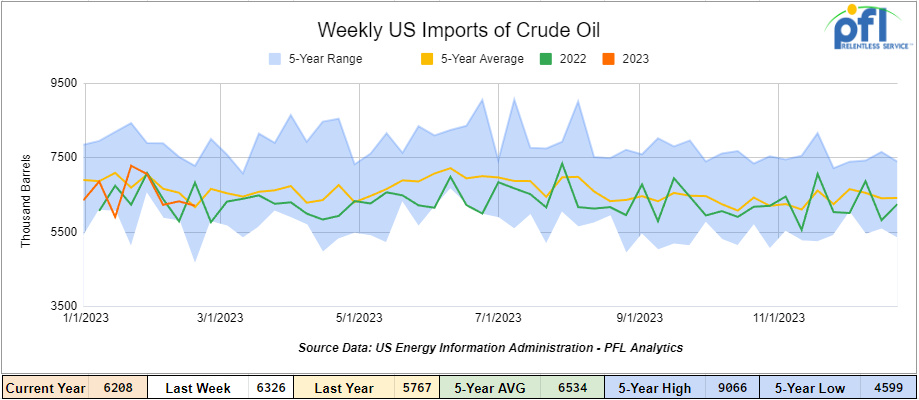
U.S. crude oil imports averaged 6.2 million barrels per day during the week ending February 24th, 2023, a decrease of 118,000 barrels per day week over week. Over the past four weeks, crude oil imports averaged 6.5 million barrels per day, 4.2% more than the same four-week period last year. Total motor gasoline imports (including both finished gasoline and gasoline blending components) averaged 672,000 barrels per day, and distillate fuel imports averaged 197,000 barrels per day during the week ending February 24th, 2023.
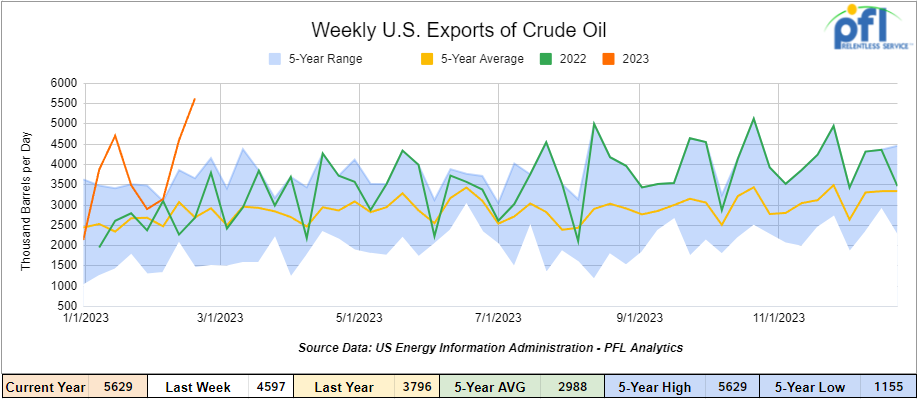
U.S. crude oil exports averaged 5.629 million barrels per day for the week ending February 24th, 2023, an increase of 1.032 million barrels per day week over week. Over the past four weeks, crude oil exports averaged 4.068 million barrels per day.
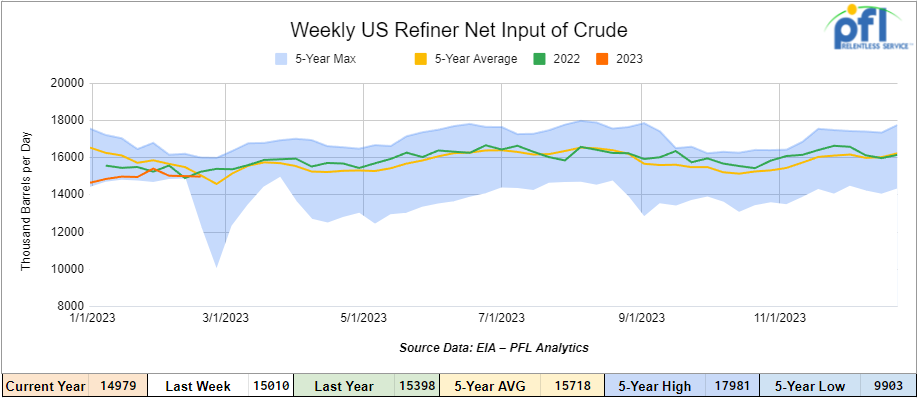
U.S. crude oil refinery inputs averaged 15 million barrels per day during the week ending February 24, 2023 which was 31,000 barrels per day less week over week.
As of the writing of this report, WTI is poised to open at $78.47 down -$1.24 per barrel from Monday’s close.
North American Rail Traffic
Week Ending March 1st, 2023.
Total North American weekly rail volumes were down (-4.43%) in week 8 compared with the same week last year. Total carloads for the week ending on March 1st were 347,541, up (+2.1%) compared with the same week in 2022, while weekly intermodal volume was 296,296, down (-11.10%) compared to the same week in 2022. 6 of the AAR’s 11 major traffic categories posted year over year decreases with the most significant decrease coming from Intermodal (-11.10%). The largest increase was from Motor Vehicles and Parts (+11.68%).
In the east, CSX’s total volumes were down (-1%), with the largest decrease coming from Intermodal (-8.52%) and the largest increase Grain (+23.59%). NS’s volumes were down (-0.3%), with the largest decrease coming from Forest Products (-4.82%) and the largest increase from Motor Vehicles and Parts (+17.2%).
In the West, BN’s total volumes were down (-13.46%), with the largest decrease coming from Intermodal Units (-21.57%), and the largest increase coming from Nonmetallic Minerals (+14.31%). UP’s total rail volumes were down (-1.35%) with the largest decrease coming from Forest Products (-17.03%) and the largest increase coming from Nonmetallic Minerals (+19.40%).
In Canada, CN’s total rail volumes were up (+1.19%) with the largest increase coming from Motor Vehicles and Parts (+21.25%) and the largest decrease coming from Grain (-20.95). CP’s total rail volumes were down (-19.47%) with the largest decrease coming from Grain (-58.75%) and the largest increase coming from Petroleum and Petroleum Products (+50%).
KCS’s total rail volumes were down (-1.7%) with the largest decrease coming from Farm Products (-17.55%) and largest increase coming from Petroleum and Petroleum Products (+28.13%).
Source Data: AAR – PFL Analytics
Rig Count
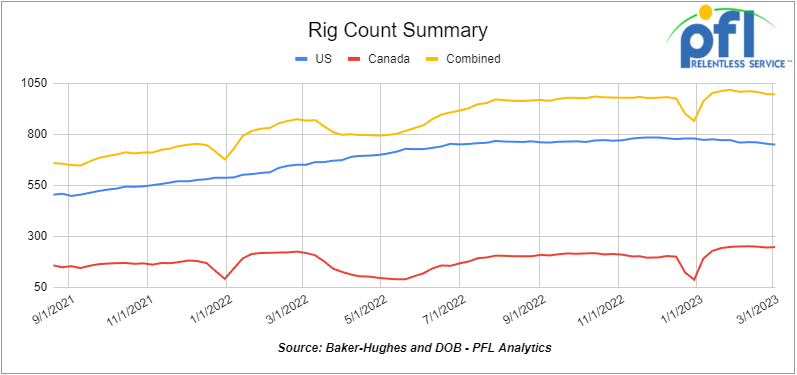
North American rig count was down by -2 rigs week over week. U.S. rig count was down -4 rigs week over week and up by +99 rigs year over year. The U.S. currently has 749 active rigs. Canada’s rig count was up by 2 rigs week-over-week and up by 29 rigs year over year. Canada’s overall rig count is 246 active rigs. Overall, year over year, we are up +128 rigs collectively.
International rig count which is reported monthly was up by 14 rigs month- over month and up 102 rigs year over year. Internationally, there are 915 active rigs.
North American Rig Count Summary

A few things we are keeping an eye on
We are watching Petroleum Carloads
The four-week rolling average of petroleum carloads carried on the six largest North American railroads fell to 25,327 from 25,649, which was a loss of -322 railcars week-over-week. Canadian volumes were down; CP’s shipments decreased by -3.1% week over week, and CN’s volumes were lower by -0.2% week over week. U.S. shipments were mixed. The CSX had the largest percentage increase up by +8.2% and the BN had the largest percentage decrease and was down by -8.1%.
Clean Natural Gas on the Way
The Energy Department exploring clean natural gas designation. The DOE is exploring a plan to offer a government endorsement for natural gas that meets a minimum standard for cleanliness, a move aimed at helping U.S. gas producers maintain sales even as nations ratchet down fossil fuels dependency to address what they call climate change. A number of companies have sprung up to certify the carbon footprint of natural gas collected in Texas, New Mexico and other places, but there is no federal government program verifying the legitimacy of these private sector efforts. The DOE effort would set a minimum standard that has to be met to help build confidence in the marketplace, The DOE has invited industry and environmental groups to send representatives to a roundtable the agency plans on hosting at CERAWeek, one of the biggest U.S. energy conferences, scheduled for Houston next month. This is a step in the right direction folks.
We are watching the Ohio Fallout – New Rules Headed our way
A bipartisan group of legislators are co-sponsoring a bill calling for changes to rail safety rules. The proposed legislation would raise maximum fines for safety violations and mandate two-person crews on trains carrying any hazardous material among other measures. President Biden has expressed support for this proposal. Additionally, NS’s CEO has been asked to testify at a Senate hearing next week on the environmental and health impacts of the derailment. The safety bill will likely be introduced in Congress once bipartisan support is gauged during the hearings. Heightened public scrutiny of the Class I rails’ safety programs will persist in the near term. For the U.S. Class 1’s, the proportion of rail accidents involving hazardous materials has dropped over the course of the decade. The East Palatine train derailment has been a public disaster for the NS.
We are Watching Some Key Economic Indicators
Purchasing Managers Index (PMI)
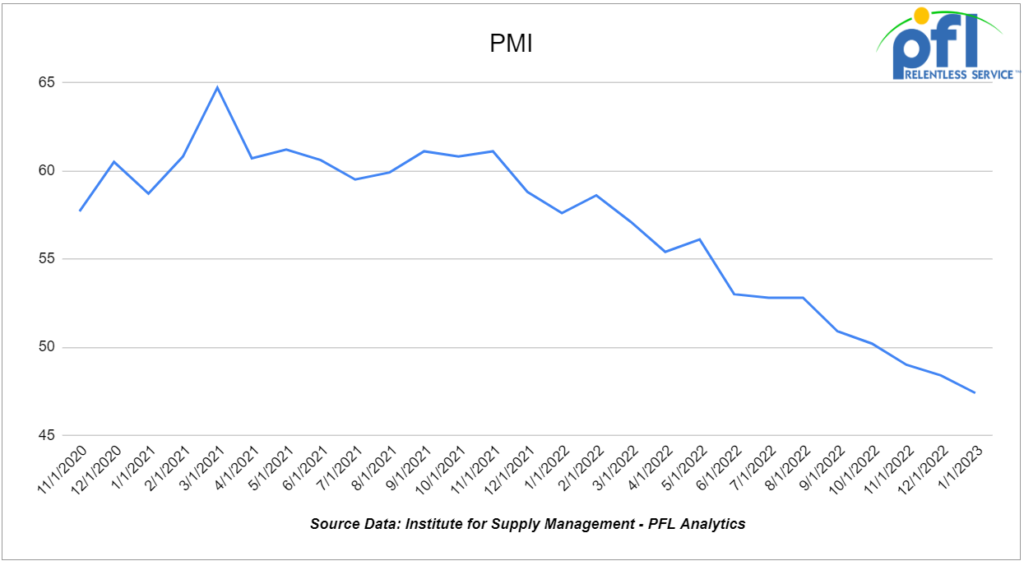
The Institute for Supply Management releases two PMI reports – one covering manufacturing and the other covering services. These reports are based on surveys of supply managers across the country and track changes in business activity. A reading above 50% on the index indicates expansion, while a reading below 50% signifies contraction, with a faster pace of change the farther the reading is from 50. In February, the PMI increased to 47.7% from January’s 47.4%, marking the fourth consecutive month of readings below 50%. However, this is a 0.3% increase month over month from January which marked the first increase in six months that the index rose from one month to the next. Meanwhile, the new orders component improved from 42.5% in January to 47.0% in February.
Industrial Output & Capacity Utilization
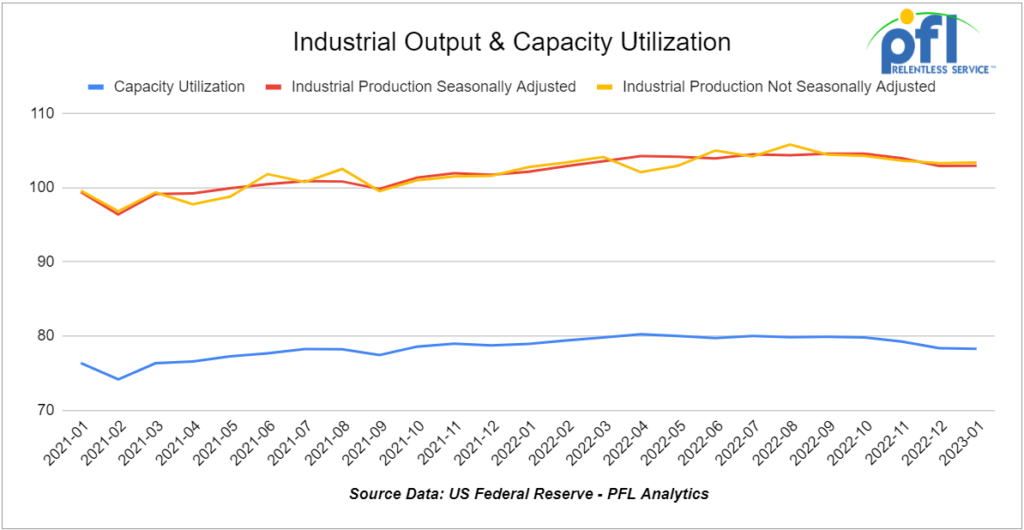
The Federal Reserve reported that U.S. industrial output slightly increased in January 2023 over December 2022, with a 1.0% increase in manufacturing output being its biggest month-to-month increase in 11 months. However, manufacturing output in January was still below the 2022 average. The year over year gain in manufacturing output was 0.3%, the smallest in 23 months. Total industrial output also had its smallest year over year percentage gain in 23 months with a gain of 0.8% in January 2023 compared to January 2022. Industries with output gains in January included agricultural chemicals, nonmetallic minerals, petroleum refineries, and paper products. The capacity utilization rate for manufacturing increased in January to 77.7% from 77.1% in December, while the rate for utilities fell to its lowest in the Fed’s data history.
The report indicates that while there was a slight increase in U.S. industrial output in January, there are signs of weakness in some sectors, particularly in utilities. The year over year gain in manufacturing output, which accounts for around 75% of total output, was the smallest in 23 months, and manufacturing output in January was still below the 2022 average. While some industries such as agricultural chemicals, nonmetallic minerals, petroleum refineries, and paper products saw output gains in January, it is important to note that the figures are preliminary, and there may be some revisions in the future. The report raises questions about the broader economic landscape and potential implications for the economy.
U.S. Unemployment Rate
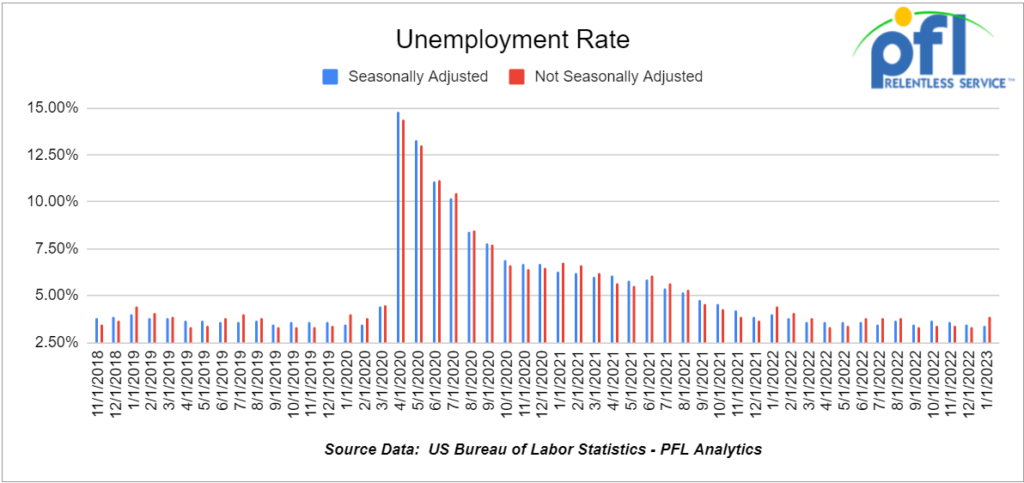
The Bureau of Labor Statistics’ February employment report, which will be released on March 10, is expected to show another month of solid job growth and an unemployment rate similar to January’s 3.4%. January’s job gains indicated that recent high-profile job cuts, particularly in the tech sector, have not yet had a significant impact on the overall labor market. The number of initial claims for unemployment insurance has remained low, averaging 192,000 in January and 193,000 in February, the fewest since April 2022. The BLS reported 11.0 million job openings at the end of December, a 57% increase from February 2020, but private recruiting companies suggest job openings in December were only 26% higher than pre-Covid levels and have decreased in January and February, potentially indicating that the labor market may not be as strong as official government data indicates.
Consumer Confidence
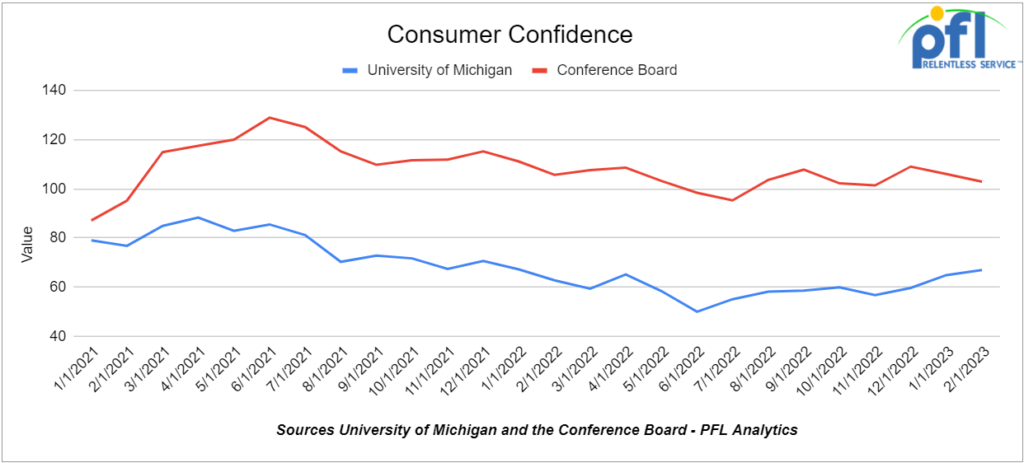
The Conference Board’s Index of Consumer Confidence was 102.9 in February 2023, a decrease from 106.0 in January and 109.0 in December 2022. The Present Situation Index improved slightly due to a better view of job availability, but expectations for jobs, incomes, and business conditions over the next six months fell sharply. Meanwhile, the index of consumer sentiment from the University of Michigan rose to from 64.9 in January to 67.0 in February, the highest it’s been in over a year, with a 12% improvement in the short-run economic outlook. The February results highlight the challenge of accurately gauging consumer sentiment.
Consumer Spending
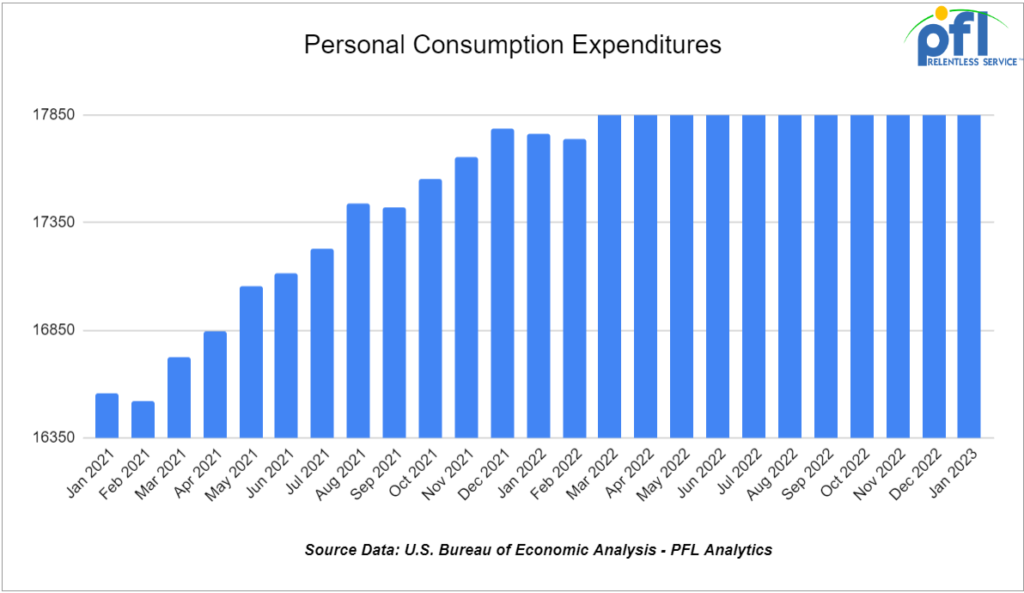
In January 2023, total consumer spending in the US rose by a preliminary 1.8%, the largest month-to-month increase since March 2021. Adjusted for inflation, the increase was 1.1%, also the most since March 2021. Spending on services increased a preliminary 1.3% not adjusted for inflation, and spending on goods, which is more important for transportation providers like railroads, increased by 2.8%, the most in a year. Retail sales, which account for around 25% of consumer spending, had their biggest gain since March 2021, rising by 3.0% in January. Economists suggest that these figures suggest that consumers are in good financial shape and that the Federal Reserve’s rate hikes haven’t had a significant impact on spending.
We have been extremely busy at PFL with return-on-lease programs involving rail car storage instead of returning cars to a shop. A quick turnaround is what we all want and need. Railcar storage in general has been extremely active. Please call PFL now at 239-390-2885 if you are looking for rail car storage, want to troubleshoot a return on lease scenario, or have storage availability. Whether you are a car owner, lessor or lessee, or even a class 1 that wants to help out a customer we are here to “help you help your customer!”
Leasing and Subleasing has been brisk as economic activity picks up. Inquiries have continued to be brisk and strong Call PFL Today for all your rail car needs 239-390-2885
Lease Bids
• 25-50, 5000-5100 Lined Hoppers needed off of BNSF, CSX, KCS, UP in Gulf LA for 3-10 years. Cars are needed for use in dry sugar service. 3-bay gravity dump
• 25-50, 25.5K 117J Tanks needed off of NS CSX in NorthEast for 5 Years. Cars are needed for use in Asphalt/Heavy Fuel Oil service.
• 10-20, 20-25 CPC 1232 or 117J tanks needed off of UP CN in Illinois for 3-5 years. Cars are needed for use in Liquid feed service.
• 100-150, 4000CF Covered Hoppers needed off of UP BN in Texas for Purchase or 5 years. Cars are needed for use in Aggregate service.
• 25, 30K 117Rs or Js Tanks needed off of UP or BN in Texas for 1-2 Years. Cars are needed for use in Diesel service.
• 25, 340W Pressure Tanks needed off of UP or BN in Texas for 1-2 Years. Cars are needed for use in Propane service.
• 25, 30K 117Rs or Js Tanks needed off of Any Class One in Midwest for 2-3 years. Cars are needed for use in Ethanol service.
• 10, any capacity Stainless Steel Tanks needed off of any class 1 in Canada for 5-10 years. Cars are needed for use in Alcohol service.
• 50-100, 25.5K CPC1232 or 117J Tanks needed off of Any in any location for 5 Years. Cars are needed for use in Veg Oil service. Unlined
• 30-50, 30K 117 Tanks needed off of any class 1 in Northeast or Midwest for 1 Year. Cars are needed for use in C5 service. Must have Magrods
• 10-12, 340W Pressure Tanks needed off of UP in Utah to Cali for 1 year. Cars are needed for use in propane service. Needs them in April 2023
• 100-300, 31.8k CPC1232 or 117J Tanks needed off of various class 1s in Canada/US for 1-3 years. Cars are needed for use in Crude service. Various needs in the market to move crude immediately
• 100, 340W Pressure Tanks needed off of various class 1s in various locations for 6 months to a year. Cars are needed for use in Propane service. Immediate need
• 100-200, 25.5K-28.3K 117J Tanks needed off of CN or CP in Edmonton for 3-6 Months. Cars are needed for use in Crude service. Dirty to Dirty.
• 10-20, 340W Pressure Tanks needed off of CN or CP in Canada for 6 months to 1 year. Cars are needed for use in Propylene service. Immediate
• 25, 20.5K CPC1232 or 117J Tanks needed off of BNSF or UP in the west for 1-3 years. Cars are needed for use in magnesium chloride service. SDS onhand
• 5, 23.5K CPC1232 Tanks needed off of CSX in West Virginia for 2 years plus. Cars are needed for use in Polyacrylamide service. Unlined
• 10-100, 20K CPC1232 or 117J Tanks needed off of BNSF, CN, or UP in the south or midwest for 5 years. Cars are needed for use in Urea Ammonium Nitrate service. CN Miss, BN Oklahoma, UP LA, and Iowa- Must be lined
• 10, 50-60 footers Plate F Boxcars needed off of CN and UP or BNSF in Texas in Tennesse & Houston for 1 year. Cars are needed for use in Barium Sulfate service. Requires double-door boxcars.
• Up to 60, 5150cf Covered Hoppers needed off of CN, CSX, NS in the east or midwest for 3 years. Cars are needed for use in Fertilizer service. 3-4 hatch gravity dumps
• 30, 5200cf Covered Hoppers needed off of UP in Colorado for 1-3 years. Cars are needed for use in Silica service. Call for details
• 40, 2400cf Gondolas needed off of various class 1s in Indiana for 6 Months. Cars are needed for use in Rock service. Call for details
• 20-30, 14k Any Tanks needed off of BNSF, UP in Texas for 1-3 Years. Cars are needed for use in HCl service. Call for details
• 50-100, 25.5K CPC1232 or 117J Tanks needed off of UP or BN in any location for 3-5 Years. Cars are needed for use in Heavy Fuel Oil service.
• 225, 5250cf-5800cf Covered Hoppers needed off of CSX, NS in the southeast for 5 years. Cars are needed for use in Plastic service. Call for details
Sales Bids
• 10, 25.5K 117, DOT-111, CPC 1232 Tanks needed off of UP or BN in Texas. Cars are needed for use in Veg Oil service. Coiled and insulated
• 5, 3200 Covered Hoppers needed off of UP or BN in Texas.
• 2-4, 28K Tanks needed off of BNSF Preferred in Minnesota. Cars are needed for use in Biodiesel service. Coiled and insulated
• 100, Plate F Boxcars needed off of BN or UP in Texas.
• 20, 2770 Mill Gondolas needed off of CSX in the northeast. Cars are needed for use in non-haz soil service. 52-60 ft
• 8, Hoppers needed off of various class 1s in various locations. Cars are needed for use in Plastic Pellet service.
• 10, 4000 Hoppers needed off of CSX in the northeast. Cars are needed for use in scrap metal service. Open top hopper
• 20-30, 3000 – 3300 PDs Hoppers needed off of BN or UP preferred in any location but prefers the west. Cars are needed for use in Cement service. C612
• 20, 17K Tanks needed off of various class 1s in various locations. Cars are needed for use in corn syrup service.
• 100, 15.7K Tanks needed off of CSX or NS in the east. Cars are needed for use in Molton Sulfer service.
Lease Offers
• 100-200, 31.8, 1232` Tanks located off of BN in Chicago. Cars are clean Sale or Lease
• 70, 25.5K, 117J Tanks located off of UP in Texas. Cars are clean Call for information
• 100-200, 31.8K, CPC1232 Tanks located off of various class 1s in Texas. Cars were last used in Gas. Call for information
• 100-200, 31.8K, CPC1232 Tanks located off of various class 1s in Texas. Cars were last used in Diesel. Call for information
• 150, 30K, DOT111 Tanks located off of various class 1s in various locations. Cars were last used in Ethanol. Call for information
Sales Offers
• 100, 28.3K, 117J Tanks located off of various class 1s in multiple locations. Clean
• 100, 30K, DOT 111 Tanks located off of various class 1s in multiple locations. Clean
• 100-200, 31.8K, CPC 1232` Tanks located off of BN in Chicago. Sale or Lease
Call PFL today to discuss your needs and our availability and market reach. Whether you are looking to lease cars, lease out cars, buy cars or sell cars call PFL today at 239-390-2885
PFL offers turn-key solutions to maximize your profitability. Our goal is to provide a win/win scenario for all and we can handle virtually all of your railcar needs. Whether it’s loaded storage, empty storage, subleasing or leasing excess cars, filling orders for cars wanted, mobile railcar cleaning, blasting, mobile railcar repair, or scrapping at strategic partner sites, PFL will do its best to assist you. PFL also assists fleets and lessors with leases and sales and offers Total Fleet Evaluation Services. We will analyze your current leases, storage, and company objectives to draw up a plan of action. We will save Lessor and Lessee the headache and aggravation of navigating through this rapidly changing landscape.
PFL IS READY TO CLEAN CARS TODAY ON A MOBILE BASIS WE ARE CURRENTLY IN EAST TEXAS
Live Railcar Markets
| CAT | Type | Capacity | GRL | QTY | LOC | Class | Prev. Use | Clean | Offer | Note |
|---|
