
“Take full account of the excellencies which you possess, and in gratitude remember how you would hanker after them if you had them not.”
– Marcus Aurelius
Jobs Update
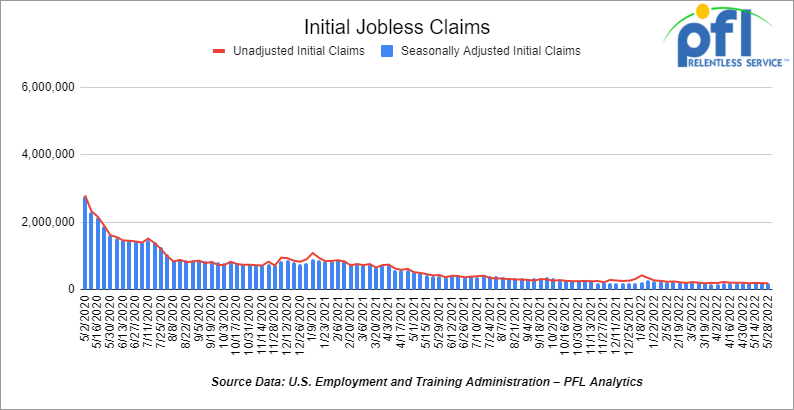
- Initial jobless claims for the week ending May 28th, 2022 came in at 200,000, down 11,000 people week-over-week.
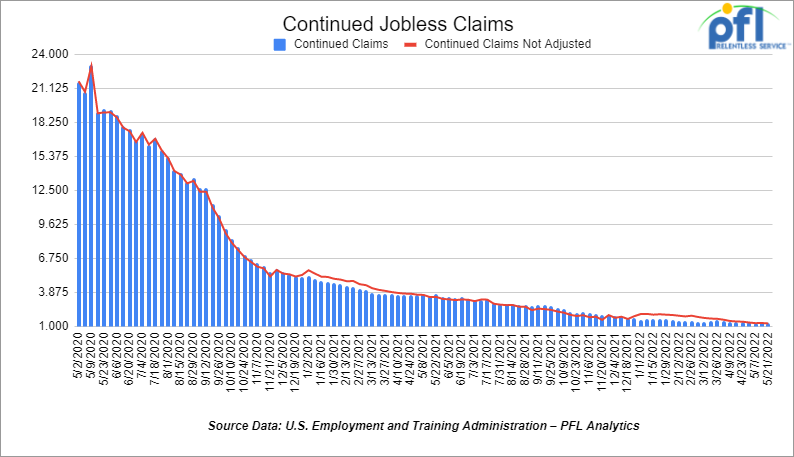
- Continuing claims came in at 1.309 million people, versus the adjusted number of 1.346 million people from the week prior, down 37,000 people week-over-week.
Stocks closed lower on Friday of last week and down week-over-week
Stocks fell sharply on Friday to cap their eighth weekly loss out of the last nine, as a stronger than expected report on U.S. nonfarm payrolls suggested the labor market remains robust enough for the Federal Reserve to raise rates quickly. The benchmark 10-year Treasury yield climbed above 2.9% after the report, leading to outsized losses among tech stocks. Sentiment also was hurt by a report that Tesla’s Elon Musk may be considering job cuts on worries over the economic outlook. Musk’s misgivings followed comments earlier in the week from J.P. Morgan’s Jamie Dimon, who said he foresees an economic “hurricane” ahead from the war in Ukraine and the Fed’s tightening policies.
The DOW closed lower on Friday of last week, down -348.58 points (-1.05%), closing out the week at 32,899.70 points, down -313.26 points week-over-week. The S&P 500 closed lower on Friday of last week, down -68.28 points, and closed out the week at 4,108.54, down -49.9 points week-over-week. The Nasdaq closed lower on Friday of last week, down -304.16 points (-2.47%), and closed out the week at 12,012.73, down -118.4 points week-over-week.
In overnight trading, DOW futures traded higher and are expected to open at 33,128 this morning up 240 points.
Oil closed higher on Friday of last week and higher week over week
U.S. West Texas Intermediate (WTI) crude closed up $2.00 per barrel (+1.71%) on Friday of last week, to settle at $118.87, up $3.80 per barrel week over week. Brent crude rose $2.11 per barrel, or 1.8 percent, to settle at US $119.72/bbl.
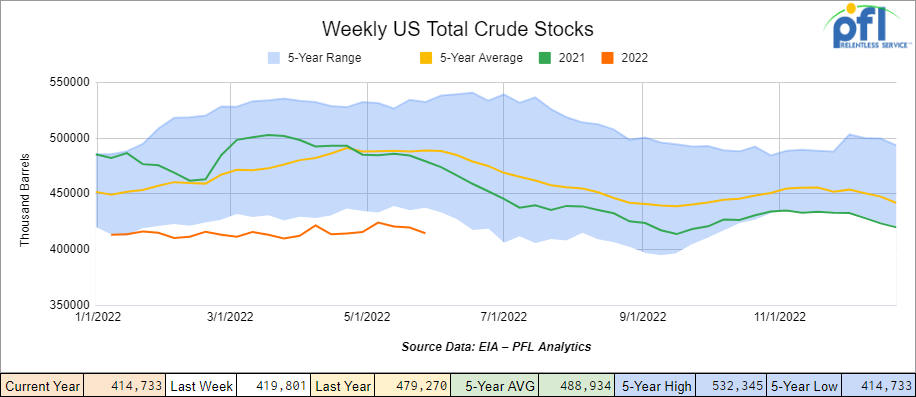
U.S. commercial crude oil inventories (excluding those in the Strategic Petroleum Reserve) decreased by -5.1 million barrels from week over week. At 414.7 million barrels, U.S. crude oil inventories are 15% below the five-year average for this time of year.
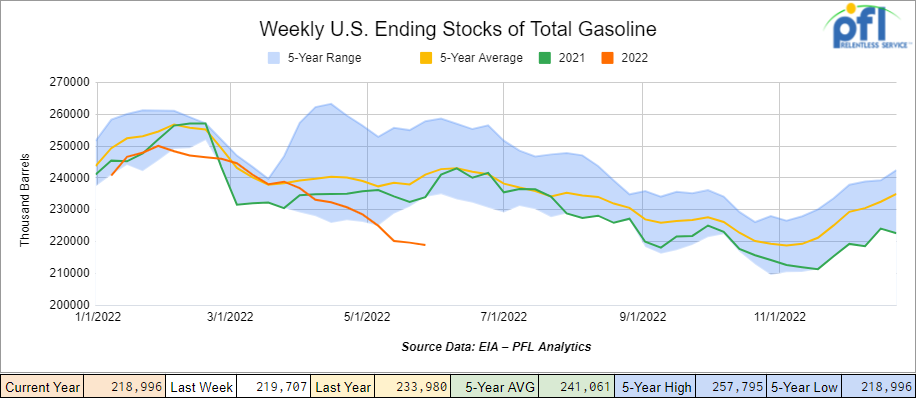
Total motor gasoline inventories decreased by -700,000 million barrels week over week and are 9% below the five-year average for this time of year.
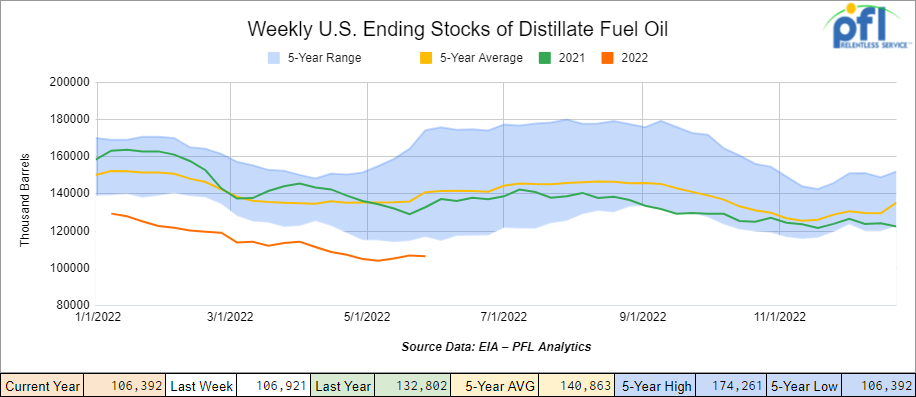
Distillate fuel inventories decreased by -500,000 barrels week over week and are 24% below the five-year average for this time of year.
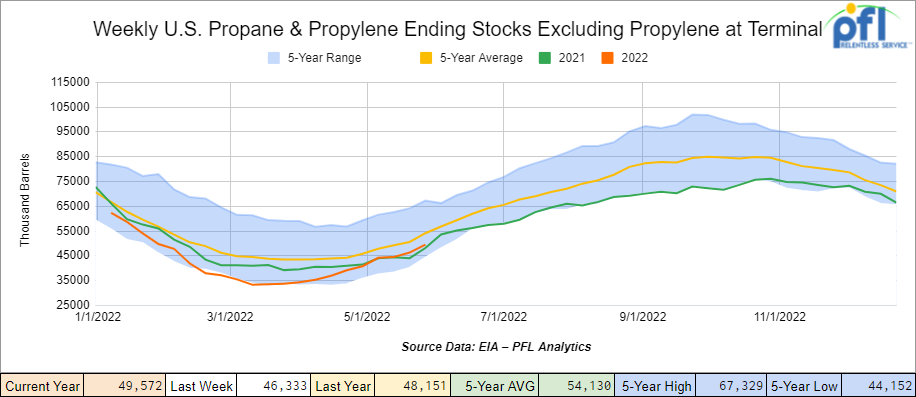
Propane/propylene inventories increased by +3.2 million barrels week over week and are 8% below the five-year average for this time of year.
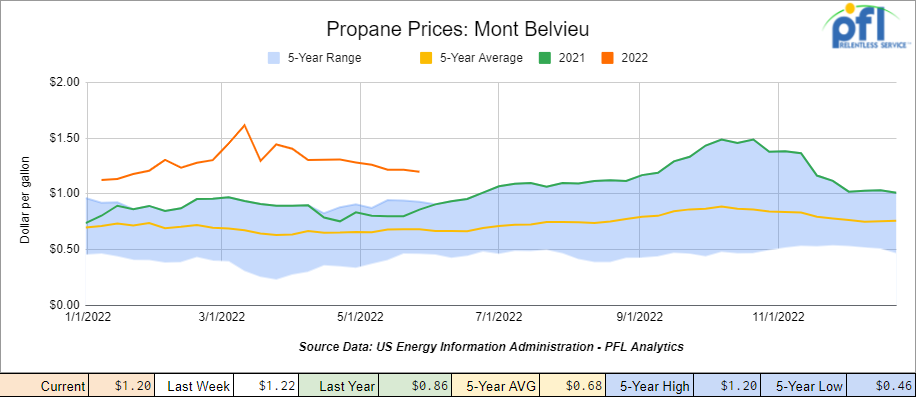
Propane prices were slightly lower week over week losing 2 cents per gallon closing at $1.20 per gallon, but up 36 cents per gallon year over year.
Overall, total commercial petroleum inventories increased by 600,000 for the week ended May 27th 2022.
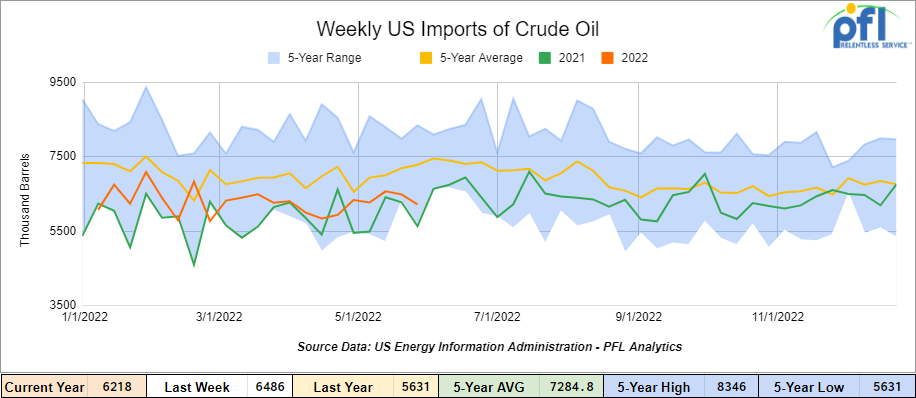
U.S. crude oil imports averaged 6.2 million barrels per day during the week ending May 27th,2022, down by 268,000 barrels per day week over week. Over the past four weeks, crude oil imports averaged about 6.4 million barrels per day, 7.3% more than the same four-week period last year. Total motor gasoline imports (including both finished gasoline and gasoline blending components) averaged 890,000 barrels per day, and distillate fuel imports averaged 263,000 barrels per day for the week ended May 27, 2022.
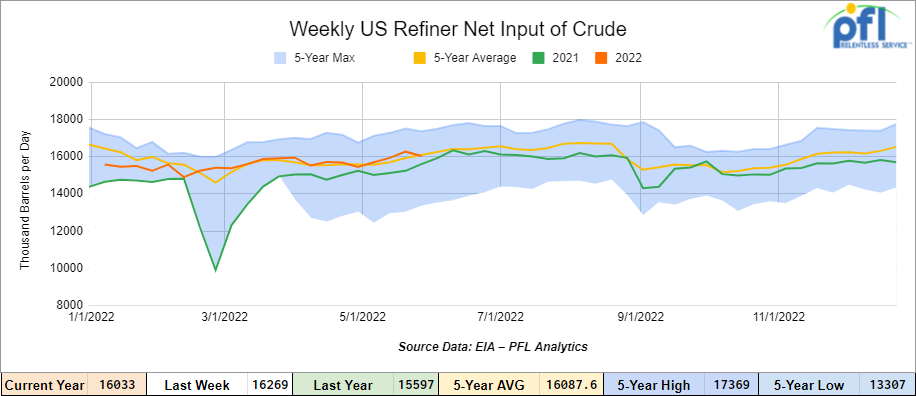
U.S. crude oil refinery inputs averaged 16.0 million barrels per day during the week ending May 27, 2022 which was 236,000 barrels per day less week over week.
Refiners worldwide are struggling to meet global demand for diesel and gasoline, exacerbating high prices and aggravating shortages from big consumers like the United States and Brazil to smaller countries alike. Global refining capacity fell in 2021 by 730,000 barrels a day, the first decline in 30 years, according to the International Energy Agency. The number of barrels processed daily slumped to 78 million barrels per day in April, lowest since May 2021, far below the pre-pandemic average of 82.1 million barrels per day.
Refiners here in the United States are increasingly finding it difficult to operate with all the compliance costs and government red tape increasing operating costs that hit the bottom line and smaller refineries are being shuttered or repurposed. Not because they want to close the doors rather the current administration wants them to (our opinion). The pandemic did not help and led to multiple closures. Now, the situation has reversed, and the strain could persist for the next couple of years, keeping refined contracts elevated. There have been some restarts. French major TotalEnergies began the process of restarting the 231,000 barrels per day Donges refinery in April after shutting in December 2020, while a 300,000 barrels per day complex in Malaysia restarted earlier this month.
As of the writing of this report, WTI is poised to open at $119.83, up $0.96 per barrel from Friday’s close.
North American Rail Traffic
Total North American rail volumes were down 2.5% year over year in week 21 (U.S. -3.0%, Canada -1.1%, Mexico +0.2%) resulting in quarter to date volumes that are down 3.7% year over year and year to date volumes that are down 3.8% year over year (U.S. -3.5%, Canada -6.1%, Mexico +3.0%). 7 of the AAR’s 11 major traffic categories posted year-over-year declines with the largest decreases coming from intermodal (-2.4%) and grain (-18.2%). The largest increase came from motor vehicles & parts (+10.7%).
In the East, CSX’s total volumes were up 0.7%, with the largest increase coming from intermodal (+2.7%). The largest decrease came from nonmetallic minerals (-35.5%). NS’s total volumes were down 2.4%, with the largest decreases coming from chemicals (-17.0%) and metals & products (-18.8%).
In the West, BN’s total volumes were down 4.3%, with the largest decreases coming from intermodal (-4.3%) and grain (-14.0%). The largest increase came from food & kindred (+32.2%). UP’s total volumes were down 1.0%, with the largest decreases coming from intermodal (-3.0%) and grain (-24.5%). The largest increases came from stone, sand & gravel (+46.1%).
In Canada, CN’s total volumes were down 1.7%, with the largest decreases coming from intermodal (-11.8%) and grain (-23.5%). The largest increases came from coal (+39.5%) and petroleum (+40.6%). RTMs were up 5.3%. CP’s total volumes were up 2.2%, with the largest increase coming from intermodal (+20.5%). The largest decreases came from farm products (-79.0%) and coal (-16.9%). RTMs were up 4.9%.
KCS’s total volumes were up 3.7%, with the largest increases coming from intermodal (+5.5%) and grain (+31.4%). The largest decrease came from petroleum (-26.9%).
Source: Stephens
Rig Count
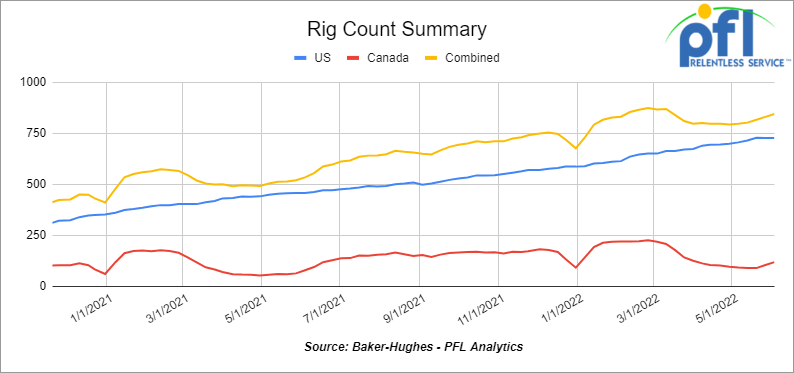
North American rig count was up 14 rigs week over week. U.S. rig count was flat week-over-week and up by 271 rigs year over year. The U.S. currently has 727 active rigs. Canada’s rig count was up by 14 rigs week-over-week and up by 40 rigs year-over-year. Canada’s overall rig count is 117 active rigs. Overall, year over year, we are up 311 rigs collectively.
International rig count numbers just came out for May 2022 and is up by 11 rigs month over month and up by 67 rigs year over year. Internationally there are 817 active rigs.
North American Rig Count Summary

A few things we are keeping an eye on:
Petroleum Carloads
The four-week rolling average of petroleum carloads carried on the six largest North American railroads rose to 24,101 from 23,618, which is a gain of 486 rail cars week-over-week. This represents the third consecutive week of week-over-week increases. Canadian volumes were lower: CN’s shipments were down by 2.4% and CP volumes were down by 0.8% U.S. volumes were mixed with the CSX having the largest percentage increase, up by 13.6%. While the UP had the largest percentage decrease, down by 2.2%.
We Are Watching Natural Gas and how it Ties Into the Overall Energy Complex
Folks, crude by rail is looking interesting. Basis in Alberta blew out to -$20 per barrel against WTI last week. So why is crude by rail not moving? We went into a long explanation in our 3-28-2022 weekly Rail Report (click here to review if you wish to). To sum it up, the bottom line is producers need to overproduce above and beyond take away pipeline capacity and the Class 1’s need to get their act together, hire engineers and start moving more traffic – it is that simple yet a very complex situation.
We don’t know if you have been watching natural gas at all, but that commodity is out of control and could get a lot worse. If it does don’t expect cheap electricity to plug the Tesla into at home. Here are the facts:
· Henry Hub Natgas benchmark hit the highest in 14 years on Friday of last week closing at $8.523 per MMBTU after trading during the trading session at over $9.00 per MMBT. If this was oil, everyone would be up in arms. It hasn’t hit home yet but it’s coming and it will.
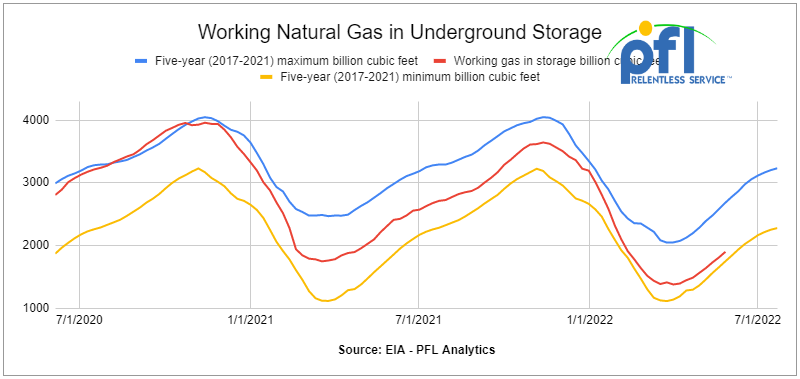
· Working Natgas inventories in storage stood at 1.812 trillion cubic feet for the week ending May 25 which is 15% below the five-year average for this time of year.
Why are natural gas prices so high? Here are the salient points:
· The surge in liquefied natural gas exports to Europe is one big reason. According to the EIA, gas feed deliveries to liquefaction trains along the Gulf Coast rose by 900 million cubic feet per day to 11.7 BCF for the week ending May 25, 2022.
· The “Go Green” agenda and the retirement of coal plants across the country instead of employing clean coal technology.
· The drought that began earlier this year is gripping the Southwest, less hydropower will be available as summer advances and with it, demand for air conditioning. The EIA reported that demand for Natgas in Texas and the SW is growing faster than supply.
What’s going to happen? PFL prediction:
· If things run perfectly – weather is normal and NO Hurricanes disrupt production this summer – we are status quo, but we believe this is the best-case scenario.
· There is strong demand from Europe as it seeks to refill its storage caverns ahead of its next winter heating season and, at the same time, diversify away from Russian gas. We don’t see this demand going away anytime soon. Asian and European natural gas prices stand at $35 per mmbtu, versus $8.50 per mmbtu here in the United States. Given the underlying fundamentals that have now developed in US gas markets, we believe prices are about to surge and converge with international prices. However, we do not know when that will happen exactly, but some believe within the next six months.
In conclusion, the higher Natgas gets the more appealing oil gets which will lead producers, especially in Canada to overproduce and just maybe lead to higher crude by rail shipments. The railcars are certainly available – it could be a short term play if the class ones play ball until Transmountain Pipeline is commissioned in December 2023, but given the high prices it would be worth it. Then again they may recommission Keystone if things get too far out of hand! (there does not seem to be any indication of that happening with the current administration).
Some Key Economic Indicators
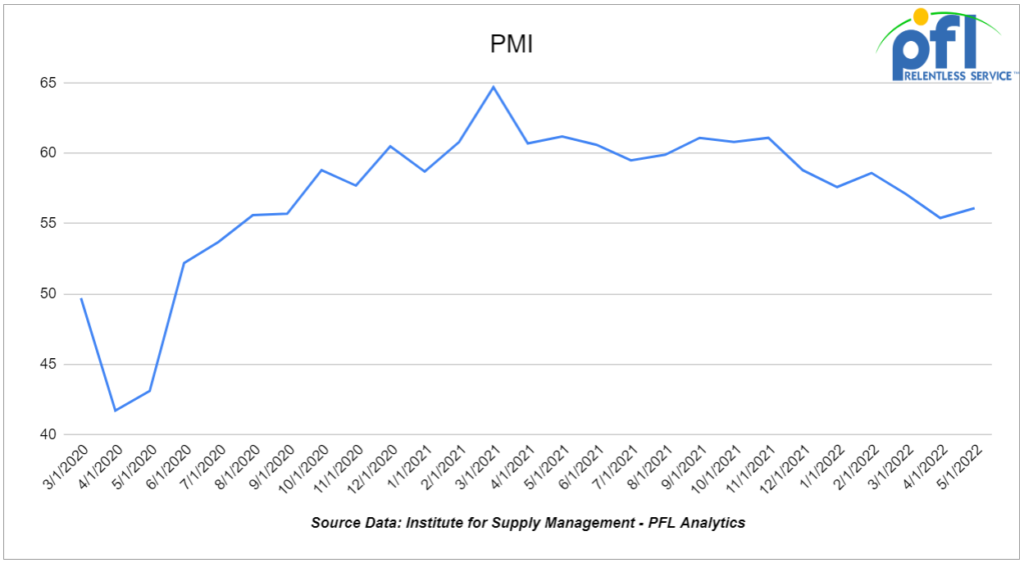
Purchasing Managers Index (“PMI”) – The PMI (which covers manufacturing) and the Services PMI (covering services) are both from the Institute for Supply Management. They are based on surveys of supply managers around the country. The surveys track the direction of changes in business activity. An index reading above 50% indicates expansion; below 50% means contraction. The more above or below 50, the faster the pace of change.
The PMI rose to 55.1% in May from 53.5% in April. That’s the 24th straight month above 50% but is the lowest reading since September 2020. The new export orders component was 52.9% in May, a slight gain from April’s 52.7%. The production subcomponent also rose, from 53.6% in April to 55.1% in May.
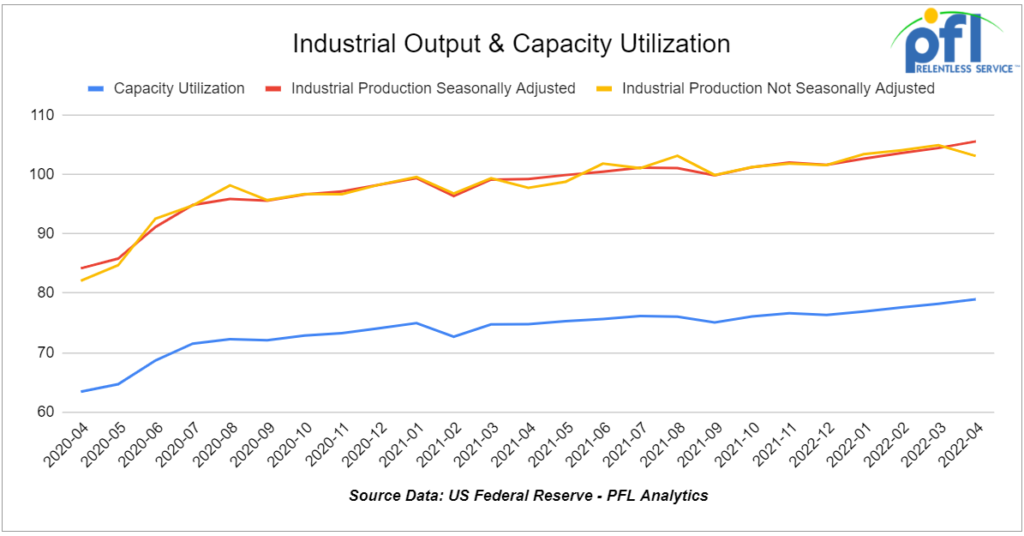
Industrial Output and Capacity Utilization – Based on preliminary data from the Federal Reserve, U.S. industrial output rose a preliminary and seasonally adjusted 1.1% in April 2022 from March 2022, beating the 0.9% increase in March from February. April’s gain was the fourth straight and meant that total output in April 2022 was the highest on record, breaking the previous record set in March 2022. The Federal Reserve figures are subject to revision later this quarter.
Manufacturing output accounts for around 75% of total output. It rose a preliminary 0.8% in April over March, matching the increase in March over February. Manufacturing output in April was the highest since July 2008. The all-time peak for U.S. manufacturing output, according to Federal Reserve data, was January 2008, just as the “Great Recession of 2008” was starting.
Capacity utilization measures how much “slack” is in the industrial economy. Utilization levels above 82-85% are generally considered “tight.” Overall capacity utilization was a preliminary 79.0% in April, up 0.08% month over month and the highest it’s been since April 2007.
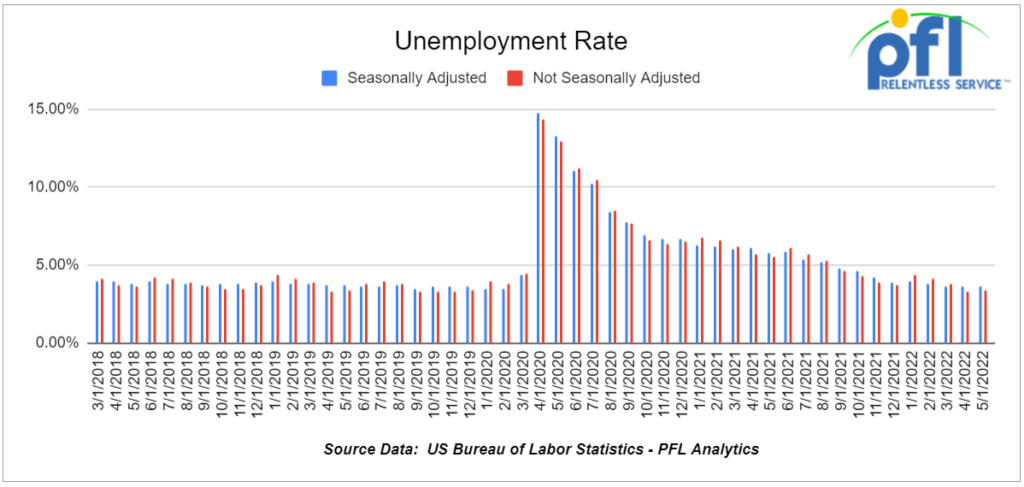
U.S. employment – A preliminary 390,000 net new jobs were created in May 2022, according to data released June 3 by the Bureau of Labor Statistics.
From May 2020 to May 2022, 21.2 net new jobs were created. That’s 822,000 fewer than the 22.0 million jobs lost in March and April 2020. The official unemployment rate in April remained at 3.6%.
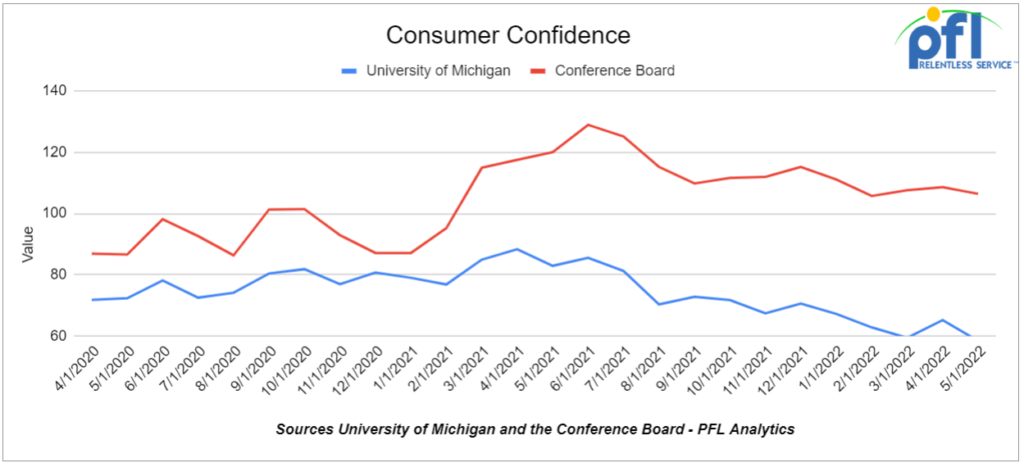
Consumer Confidence – Not surprisingly consumer confidence continues to slip the Conference Board’s index of consumer confidence fell from 108.6 in April to 106.4 in May. Consumer confidence has been trending down since mid-2021.
The University of Michigan’s index fell to 58.4 in May from 65.2 in April. The Michigan index, like the Conference Board index, has trended down over the past nine months.
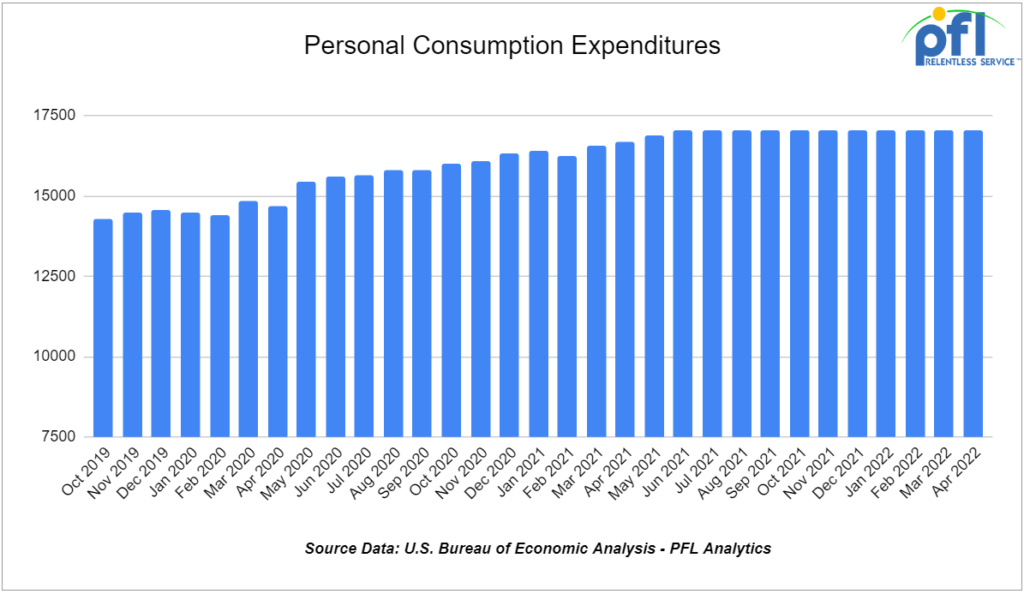
Consumer Spending – Total consumer spending not adjusted for inflation rose a seasonally adjusted 0.9% in April 2022 over March 2022, its fourth month-to-month gain in a row.
Adjusted for inflation, total spending rose 0.7% in April, up from 0.5% in March and 0.1% in February.
Of concern, savings as a share of disposable personal income (a measure of funds available for spending) fell to 4.4% in April, roughly half what it was just a few months ago — suggesting many Americans are tapping savings to offset cost increases from inflation,
We have been extremely busy at PFL with return on lease programs involving rail car storage instead of returning cars to a shop. A quick turnaround is what we all want and need. Railcar storage in general has been extremely active. Please call PFL now at 239-390-2885 if you are looking for rail car storage, want to troubleshoot a return on lease scenario, or have storage availability. Whether you are a car owner, lessor or lessee, or even a class 1 that wants to help out a customer we are here to “help you help your customer!”
Leasing and Subleasing has been brisk as economic activity picks up. Inquiries have continued to be brisk and strong Call PFL Today for all your rail car needs 239-390-2885
PFL is seeking:
- 5, 29k Tank Cars needed in Texas off of the KCS for 5 years. Need to be lined.
- Up to 40 5500 Covered Gons 286 unlined CSX/NS preferred but will consider other
- 30 boxcars on UP or CP for 3 years to run from TX to Edmonton – negotiable
- 6-10 Open top 4200 gons for hauling scrap NS in Ohio for 1-3 years
- 100, 2480 CU-FT Ag Gons needed in Texas off of the UP for 1-3 Years.
- 50, 30K+ Tank cars are needed in several locations. Can take in various locations off various Class 1’s. Can have prior Ethanol heel or Gasoline heel.
- 300 5800 Covered hoppers needed for plastic – 5-year lease – negotiable
- 50, 5800cuft or larger Covered Hopper for use in DDG needed in the Midwest for 3-4 years. Immediate need.
- 10-20 Covered hopper grain cars in the Midwest 5200-5500 2-3 years
- 20-30, 19K Tank Cars for Caustic Soda needed in Texas off of the UP or BN.
- 100 Moulton Sulfur cars for purchase – any location – negotiable
- 50 Ag Gons 2500-2800cuft 286k GRL in the east CSX for 5 years negotiable
- 100 15K Tanks 286 for Molten Sulfur in the Northeast CSX/NS for 6 months negotiable
- 100, 5800 Covered Hoppers 286 can be West or East for Plastic 3-5 years
- 70, 117R or J needed for Ethanol for 3 years. Can take in the South.
- 50, 6500+ cu-ft Mill Gon or Open Top Hopper for wood chips in the Southeast for 5 Years.
- 20, 19,000 Gal Stainless cars in Louisiana UP for nitric acid 1-3 years – Oct negotiable
- 10, 6,300CF or greater covered hoppers are needed in the Midwest.
PFL is offering:
- Various tank cars for lease with dirty to dirty service including, nitric acid, gasoline, diesel, crude oil, Lease terms negotiable, clean service also available in various tanks and locations including Rs 111s, and Js – Selection is Dwindling. Call Today!
- 200 Clean C/I 25.5K 117J in Texas. Brand New Cars!
- 150 25.5 111’s in the Midwest for sale – Negotiable
- Up to 150 sand cars for sale at various locations and class ones – Great Price!
- 150 117R’s 31.8 clean for lease in Texas KCS – negotiable
- 31.8K Tank Cars last in Diesel. Dirty to dirty in Texas
- 200 117Js 29K OK and TX Clean and brand new – Lined- lease negotiable
- 100 117Rs dirty last in Gasoline in Texas for lease Negotiable
- 90 117Rs 30K located in Alberta CN or CP Refined Products Dirty – negotiable
- 99 340W Pressure Cars various locations Butane and Propane dirty negotiable
- 100 29K C/I 1232 cars for lease. Dirty in Heavy Crude and can be returned dirty.
- 50 29K 117Js in Nebraska for sale or lease clean last in crude
- 100 117Rs 29K clean last used in crude Washington State – price negotiable sale or lease
- 100 111s of various volumes and locations last in fuel oil dirty price negotiable
- Various Hoppers for lease 3000-6250 CF 263 and 268 multiple locations negotiable
- 100 3200 Covered Hoppers for sale price negotiable
Call PFL today to discuss your needs and our availability and market reach. Whether you are looking to lease cars, lease out cars, buy cars or sell cars call PFL today at 239-390-2885
PFL offers turn-key solutions to maximize your profitability. Our goal is to provide a win/win scenario for all and we can handle virtually all of your railcar needs. Whether it’s loaded storage, empty storage, subleasing or leasing excess cars, filling orders for cars wanted, mobile railcar cleaning, blasting, mobile railcar repair, or scrapping at strategic partner sites, PFL will do its best to assist you. PFL also assists fleets and lessors with leases and sales and offers Total Fleet Evaluation Services. We will analyze your current leases, storage, and company objectives to draw up a plan of action. We will save Lessor and Lessee the headache and aggravation of navigating through this rapidly changing landscape.
PFL IS READY TO CLEAN CARS TODAY ON A MOBILE BASIS WE ARE CURRENTLY IN EAST TEXAS
Live Railcar Markets
| CAT | Type | Capacity | GRL | QTY | LOC | Class | Prev. Use | Clean | Offer | Note |
|---|
