
“Never tell people how to do things. Tell them what to do and they will surprise you with their ingenuity. Delegation involves putting others in charge but being willing to take ultimate responsibility”
-General George Patton
Jobs Update
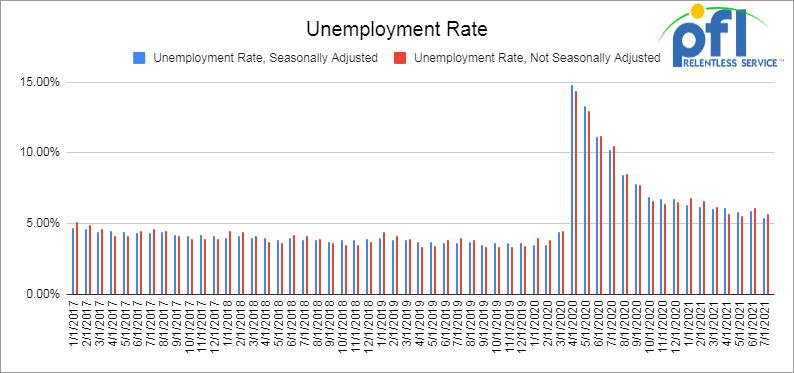
Weekly jobless claims are down week over week, but remain elevated.
- Initial jobless claims for the week ended August 28 came in at 340,000, down 13,000 people week over week and the lowest level since COVID.
- Continuing claims came in at 2.748 million people versus 2.862 million from the week prior. Down 114,000 people week over week.
- On September 3, 2021, the Bureau of Labor Statistics issued the employment report which released nonfarm payroll job growth in August that increased by just 235,000 people versus expectations of 720,000 people.
- The unemployment rate fell to 5.2% from 5.4%.
- Leisure and hospitality jobs were flat during the month after leading the way for much of the year.
Stocks closed mixed on Friday of last week and mixed week over week
The Dow closed lower on Friday of last week, down -74.73 points (-.21%) closing out the week at 35,369.09, down -86.71 points week over week. The S&P 500 closed lower on Friday of last week, down -1.52 points (+0.03%) and closing out the week at 4,535.43, up +26.08 points week over week. The Nasdaq closed higher on Friday of last week, up +32.34 points (+0.21%) and closing out the week at 15,363.52 up +234.02 points week over week.
In overnight trading, DOW futures traded higher and are expected to open down this morning 5 points.
Oil slipped on Friday of last week on the back of a weaker than expected jobs report.
Oil prices fell on Friday after a weaker than expected U.S. jobs report which indicated a patchy economic recovery that could mean slower fuel demand during a resurgent pandemic. West Texas Intermediate (WTI) for October delivery declined 70 cents a barrel to settle at $69.29 a barrel on Friday of last week, up 55 cents a barrel week over week. Brent crude oil settled down 42 cents a barrel on Friday of last week closing at $72.61 a barrel, down 9 cents a barrel week over week.
U.S. commercial crude oil inventories (excluding those in the Strategic Petroleum Reserve) decreased by 7.2 million barrels week over week. At 425.4 million barrels, U.S. crude oil inventories are 6% below the five-year average for this time of year.

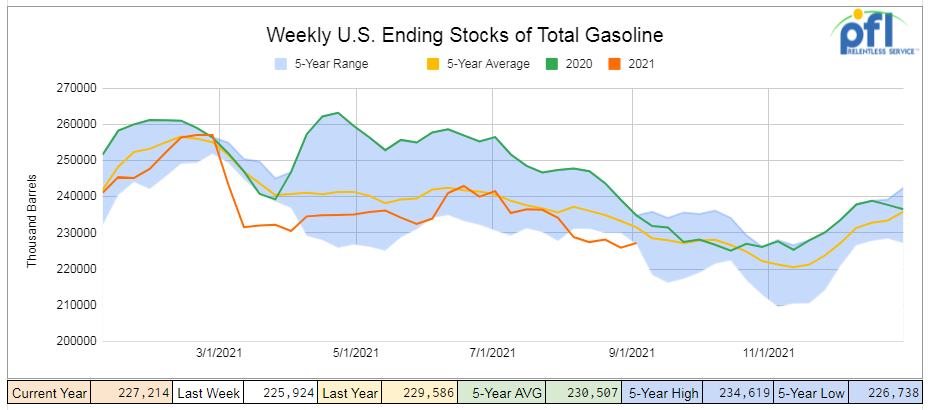
Total motor gasoline inventories increased by 1.3 million barrels week over week and are 2% below the five-year average for this time of year. Finished gasoline and blending components inventories both increased for the week ending August 27th.
Distillate fuel inventories decreased by 1.7 million barrels week over week and are 9% below the five-year average for this time of year.

Propane/propylene inventories increased by 500,000 barrels week over week and are 20% below the five-year average for this time of year.

Overall total commercial petroleum inventories decreased by 13.6 million barrels week over week.
U.S. crude oil imports averaged 6.3 million barrels per day for the week ending August 27, 2021, up by 183,000 barrels per day week over week. Over the past four weeks, crude oil imports averaged 6.3 million barrels per day, 13.9% more than the same four-week period last year. Total motor gasoline imports (including both finished gasoline and gasoline blending components) for the week ending August 27, 2021 averaged 1.1 million barrels per day, and distillate fuel imports averaged 364,000 barrels per day.
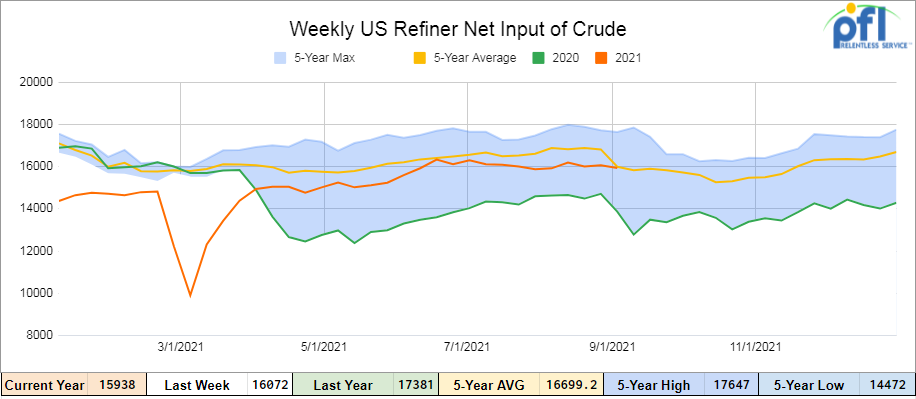
U.S. crude oil refinery inputs averaged 15.9 million barrels per day during the week ending August 27th, 2021 which was 133,000 barrels per day less week over week. Refineries operated at 91.3% of their operable capacity for the week ending August 27th. Gasoline production decreased week over week, averaging 9.9 million barrels per day. Distillate fuel production decreased week over week, averaging 4.8 million barrels per day.
As of the writing of this report, WTI is poised to open at $69.02, down 27 cents per barrel from Friday’s close.
North American Rail Traffic
Total North American rail volumes were down 1.0% year over year in week 34 (U.S. -0.7%, Canada -0.1%, Mexico -8.6%) resulting in quarter to date volumes that are up 1.3% year over year and year to date volumes that are up 9.6% year over year (U.S. +10.8%, Canada +6.7%, Mexico +5.5%). 4 of the AAR’s 11 major traffic categories posted year over year decreases with the largest declines coming from intermodal (-4.6%) and grain (-24.4%). The largest increases came from coal (+13.2%) and metallic ores & metals (+24.3%).
In the East, CSX’s total volumes were up 2.1%, with the largest increase coming from coal (+24.7%). The largest decrease came from motor vehicles & parts (-18.7%). NS’s total volumes were down 5.4%, with the largest decrease coming from intermodal (-10.4%). The largest increases came from metals & products (+37.1%) and petroleum (+68.3%).
In the West, BN’s total volumes were up 1.2%, with the largest increase coming from intermodal (+3.1%). The largest decrease came from grain (-38.3%). UP’s total volumes were up 3.2%, with the largest increases coming from coal (+16.3%) and chemicals (+11.7%). The largest decreases came from intermodal (-4.4%) and motor vehicles & parts (-30.4%).
In Canada, CN’s total volumes were up 2.0%, with the largest increases coming from coal (+146.1%) and metallic ores (+30.5%). The largest decrease came from intermodal (-6.8%). RTMs were down 0.4%. CP’s total volumes were down 1.0%, with the largest decrease coming from grain (-43.1%). The largest increase came from intermodal (+11.3%). RTMs were down 8.1%.
KCS’s total volumes were down 2.6%, with the largest decrease coming from intermodal (-15.1%)
Source: Stephens
Rig Count
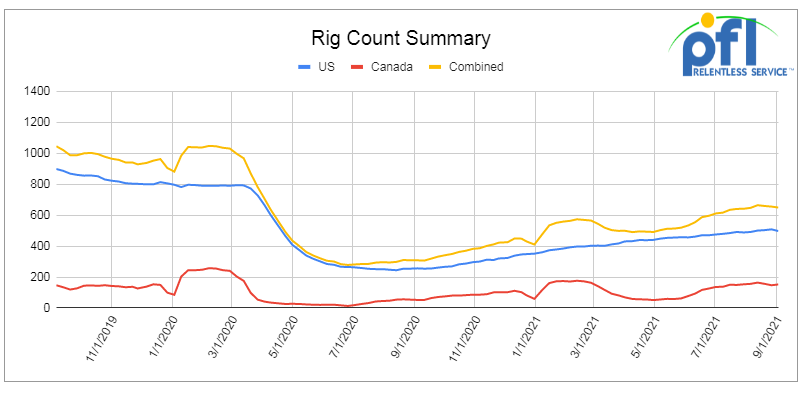
North American rig count is down by 6 rigs week over week. The U.S. rig count was down by 11 rigs week over week and up by 241 rigs year over year. The U.S. currently has 497 active rigs. Canada’s rig count was up by 5 rigs week over week, and up by 100 rigs year over year and Canada’s overall rig count is 152 active rigs. Overall, year over year we are up 341 rigs collectively. International rig count was just released and we are up 26 rigs month over month and up 30 rigs year over year. International rig count overall has 777 active rigs.
North American Rig Count Summary

A few things we are keeping an eye on:
- STB Rejects CN Voting Trust – CP seems to be well positioned – last week the STB denied the use of CN’s voting trust, on the notion that it did not meet the standards under the current merger regulations. The Board made it very clear that due to competitive risk, downstream effects, and the Executive Order, they would likely not support the deal itself not only because of its failure to meet public interest, but also to preserve and protect “the small number of remaining Class I railroads.” CP hosted a conference call with investors and stated they will not be changing their bid (valued at the time at $300 Million), and KSU has until September 12 to make a decision. The KCS announced that it adjourned its shareholder vote to September 24, and we await a move from CN. Given the clear tone from the STB, we believe the CN will walk away from the deal.
- Petroleum by Rail – The four-week rolling average of petroleum carloads carried on the six largest North American railroads was up from 24,902 to 25,248, a gain of 346 rail cars week over week. Canadian volumes were up – CN shipments were up by 1.8% and CP shipments were up by 3.6%. U.S. volumes were mostly higher with the CSX having the largest percentage increase up 2.8% while UP’s shipments fell by 6.5%.
- The fall out of Domestic Energy Infrastructure after the passing of Hurricane Ida – Hurricane Ida was the worst storm since Katrina, and knocked out an estimated 94% of offshore Gulf oil production, as well as power to one million homes across Louisiana and Mississippi. WTI crude prices jumped 10% on Monday of last week to $69 and after a volatile week settled up week over week crude oil ended up closing at $69.29 a barrel. It has been difficult for companies to get an exact handle on overall damage, but final numbers are going to be north of $50 billion all in (residential, commercial and industrial). From a 30,000-foot level here is what we know:
- U.S. Government is going to loan ExxonMobil 1.5 million barrels of crude oil from the Strategic Petroleum Reserve (“SPR”).
- U.S. Government is going to lend 300,000 barrels of crude from the SPR to Placid Refining.
- Electricity is still out in many areas and expected to be down for weeks.
- Repairs are underway on Louisiana’s “LOOP “system which suspended deliveries ahead of Hurricane Ida.
- It seems to us that damage to the gulf’s refinery and petrochemical infrastructure has been minimal and are starting up again in the most environmentally friendly way possible.
- Busses are picking up people in New Orleans to get them to safety so they can experience basic human needs
- At the end of the day market prices have not been as dramatic as one might have expected. COVID, coupled with the world currently being well supplied, has kept markets in check. Stay tuned to PFL for up to the minute market updates we are watching this one real close.
- We are watching Alberta – According to the Alberta Energy Regulator – July crude stocks ended at 75 million barrels up 8 million barrels year over year and 2 million barrels month over month. Canadian crude producers are waiting for Enbridge’s Line 3 replacement that will add 390,000 barrels per day of capacity as early as September 15th 2021. Drilling in Alberta surged for in the first half of 2021, its strongest start since 2014 with 1,506 wells being drilled exceeding all of 2020’s wells drilled. See below Canadian Crude by rail numbers – just released by the Canadian Energy Regulator for June.

- We are watching The Dakota Access Pipeline (“DAPL”) – According to The Army Corps of Engineers they have extended the deadline for an Environmental review of DAPL. The delay they claim is to gather input from Native American Tribes and the State of North Dakota itself. The new environmental report is expected to be published now in September of 2022 a delay of six months. Stay tuned to PFL for future updates.
- We are watching a few key economic indicators:
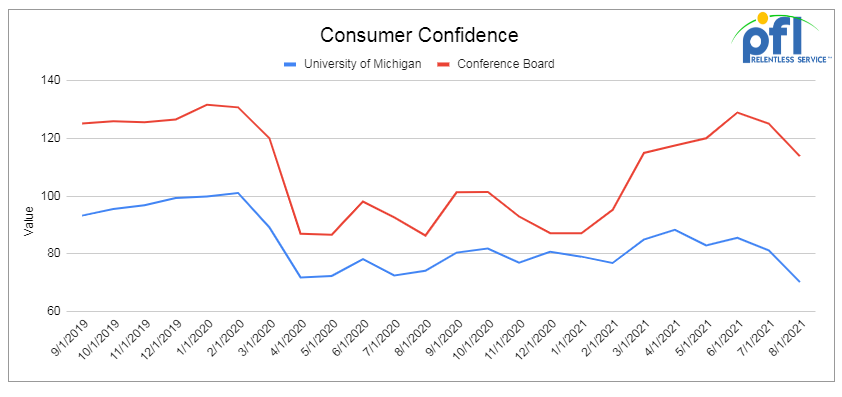
- The Conference Board’s index of consumer confidence fell from 129.1 in July to 113.8 in August, the lowest it’s been since February 2021 and much lower than most economists expected. It’s the first decline in eight months and one of the biggest declines ever. Lynn Franco is the Conference Board executive in chart of the index and said, “The resurgence of COVID-19 and inflation concerns have dampened confidence amongst other items” but “it is too soon to conclude this decline will result in consumers significantly curtailing their spending in the months ahead.” The University of Michigan’s index of consumer sentiment fell sharply as well, falling from 81.2 in July to 70.3 in August. The last time the U of M Index was that low was December 2011. Richard Curtin, the economist in charge of the survey, said, “Consumers’ extreme reactions were due to the surging Delta variant, higher inflation, slower wage growth, and smaller declines in unemployment. The extraordinary falloff in sentiment also reflects an emotional response, from dashed hopes that the pandemic would soon end and lives could return to normal.” Curtin also cautioned, “The August collapse of confidence does not imply an imminent downturn in the economy” but says the emotional impact on spending patterns could last a while. Well folks, our thoughts are that COVID represents a small part of the decline it is all the other matters that are going on right now and we are not surprised by the numbers.
- Consumer spending accounts for approximately 70% of U.S. GDP, so where the consumer leads, the economy usually follows. After big swings in the first quarter, spending has settled down — it rose a preliminary and seasonally adjusted 0.3% in July from June, down from a 1.1% gain in June from May. Spending on goods fell 1.1% in July, its second decline in the past three months. Spending on services, which in absolute terms is about twice the spending on goods, rose a preliminary 1.0% in July, its fifth consecutive month over month gain of at least 1 percent. Meanwhile, retail sales, which are the equivalent of about 25% of consumer spending fell a preliminary 1.1% in July from June, also its second decline in the past three months. Excluding autos, retail sales were down 0.4% in July. The job market remains strong, and that will keep providing a boost to people’s incomes and spending power. Moreover, many Americans still have substantially more money in the bank now than they did before the pandemic and the monthly child tax-credit payments that started going out last month are increasing those savings.

U.S. Bureau of Economic Analysis
We have been extremely busy at PFL with return on lease programs involving rail car storage instead of returning cars to a shop. A quick turnaround is what we all want and need. Railcar storage in general has been extremely active. Please call PFL now at 239-390-2885 if you are looking for rail car storage, want to trouble shoot a return on lease scenario or have storage availability. Whether you are a car owner, lessor or lessee or even a class 1 that wants to help out a customer we are here to “help you help your customer!”
Railcar Markets
Leasing and Subleasing has been brisk as economic activity picks up. Inquiries have continued to be brisk and strong Call PFL Today for all your rail car needs 239-390-2885
PFL is seeking:
- 70 5150 Covered Hoppers needed in Midwest for 3 Month starting October. Any class one
- 50-100 4750 Covered Hoppers needed for Petcoke. Can take in South.
- 70 117R or J needed for Ethanol for 3 years. Can take in the South.
- 30 25.5’s or greater food grade Kosher veg oil cars for 6-12 months
- 90-100 28.3K C/I Tank Cars needed for Biodiesel in the Midwest for 1 Year.
- 50 6500+ cuft Mill Gon or Open Top Hopper for wood chips in the Southeast for 5 Years.
- 25 bulkhead flats 286 any class one for up to 5 years Negotiable
- 10 open top hoppers 2400 C FT in Texas needed for stone on the UP 3-5 years
- 20 19,000 Gal Stainless cars in Louisiana UP for nitric acid 1-3 years – Oct negotiable
- 10 6,300CF or greater covered hoppers needed in the Midwest.
- 15-25 20K 23.5K cars for Oct Slurry needed in the South for 1 Year
- 2 89’ Flat cars for purchase or lease – needed in TX off the BNSF
PFL is offering:
- Various tank cars for lease with dirty to dirty service including, nitric acid, gasoline, diesel, crude oil, Lease terms negotiable, clean service also available in various tanks and locations including Rs 111s, and Js – Selection is Dwindling. Call Today!
- 200 Clean C/I 25.5K 117J in Texas. Brand New Cars!
- 34 Clean C/I 25.5K CPC 1232’s located in PA.
- 200 117Js 29K OK and TX Clean and brand new – Lined- lease negotiable
- 100 117Rs dirty last in Gasoline in Texas for lease Negotiable
- 20 117R 30K plus tanks for ethanol in Wisconsin off the CN Negotiable
- 90 117Rs 30K located in Alberta CN or CP Refined Products Dirty – negotiable
- 37 BRAND NEW 5161 Sugar Hoppers in Arkansas UP – negotiable
- 99 340W Pressure Cars various locations Butane and Propane dirty negotiable
- 100 73 ft 286 GRL riser less deck, center part for sale,
- 19 auto-max II automobile carrier racks – tri-49 for sale – negotiable
- 10 food grade stainless steel cars
- 20 20K Stainless cars in 3 locations in the south – negotiable
- 30 CPC 1232 25.5K C/I Pennsylvania NS clean negotiable
- 100-150 29K C/I 117J cars for lease. Dirty in Bakken crude and can be returned dirty.
- 100 29K C/I 1232 cars for lease. Dirty in Heavy Crude and can be returned dirty.
- 100 117Rs 29K clean last used in crude Washington State – price negotiable sale or lease
- 21 111s 29K tanks last in alcohol dirty on the CN in Wisconsin for lease price negotiable
- 100 111s of various volumes and locations last in fuel oil dirty price negotiable
- Various Hoppers for sale and lease 3000-5800 CF 263 and 286 multiple locations negotiable
- 45 Boxcars 60ft Plate F’s Located in Tenn CSX – Lease Negotiable
- 28 20K Veg oil cars for lease in Arkansas – Negotiable
- 100 3200 Covered Hoppers for sale price negotiable
- 100 Center beam Flats with risers 73ft in SD and Iowa for sale negotiable
Call PFL today to discuss your needs and our availability and market reach. Whether you are looking to lease cars, lease out cars, buy cars or sell cars call PFL today 239-390-2885
PFL offers turn-key solutions to maximize your profitability. Our goal is to provide a win/win scenario for all and we can handle virtually all of your railcar needs. Whether it’s loaded storage, empty storage, subleasing or leasing excess cars, filling orders for cars wanted, mobile railcar cleaning, blasting, mobile railcar repair, or scraping at strategic partner sites, PFL will do its best to assist you. PFL also assists fleets and lessors with leases and sales and offers Total Fleet Evaluation Services. We will analyze your current leases, storage, and company objectives to draw up a plan of action. We will save Lessor and Lessee the headache and aggravation of navigating through this rapidly changing landscape.
PFL IS READY TO CLEAN CARS TODAY ON A MOBILE BASIS WE ARE CURRENTLY IN EAST TEXAS
Live Railcar Markets
Lease OffersLease BidsSales OffersSales BidsCAT Type Capacity GRL QTY LOC Class Prev. Use Clean Offer Note
