
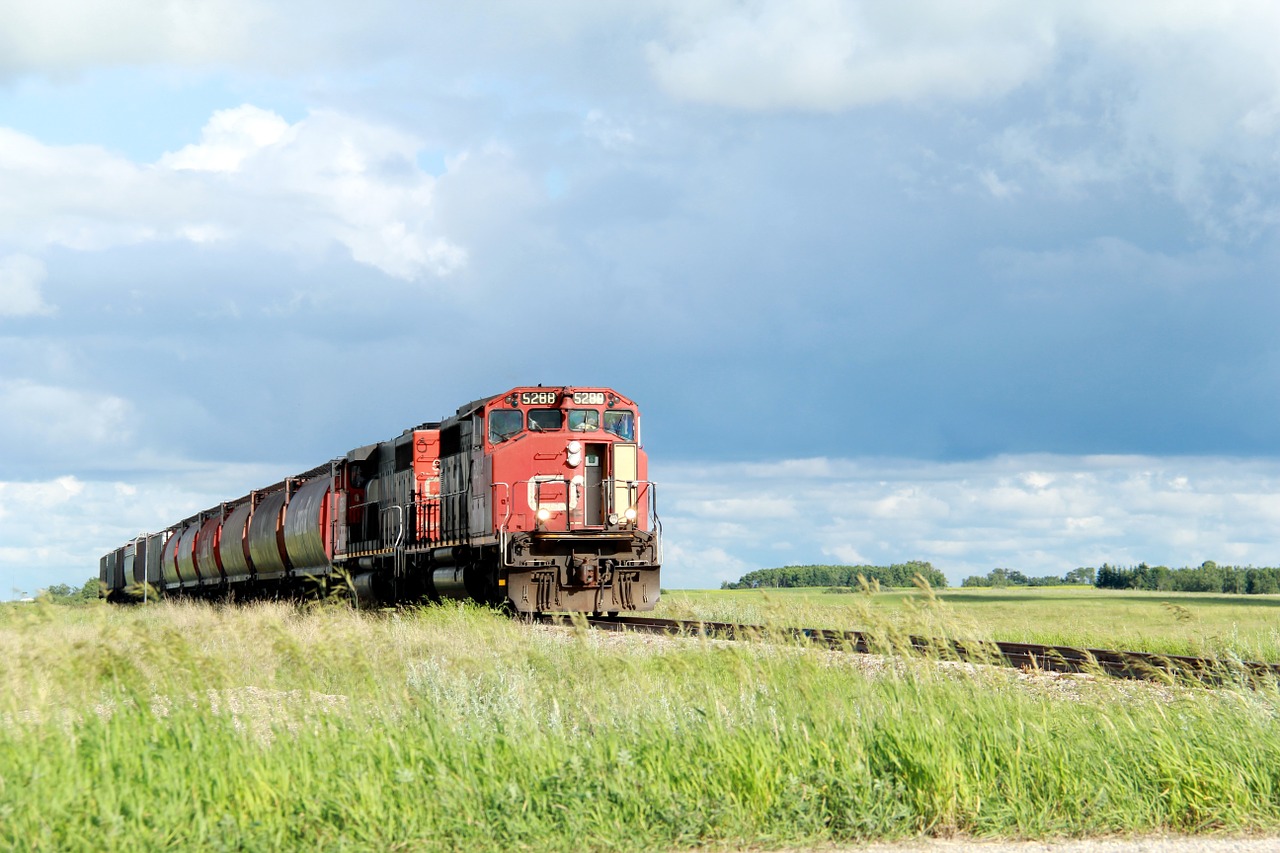
“Permit yourself to change your mind when something is no longer working for you.” – Nedra Glover Tawwab
Jobs Update
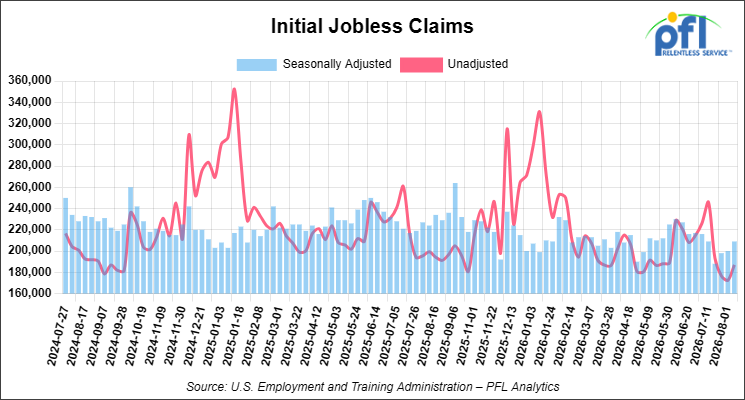
Initial jobless claims seasonally adjusted for the week ending August 8, 2026 came in at 209,000, versus the adjusted number of 200,000 people from the week prior, up 9,000 people week over week.
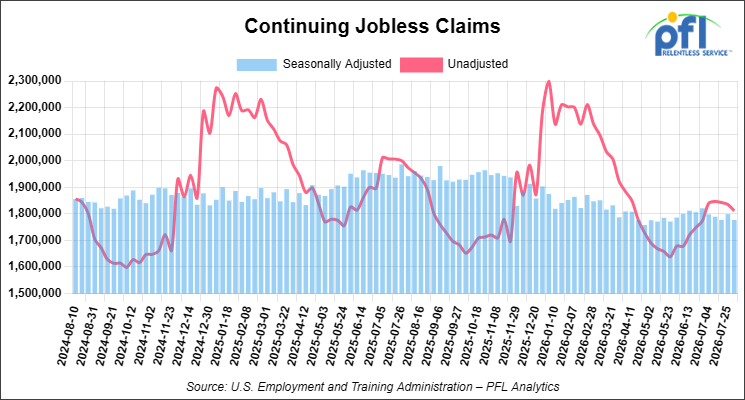
Continuing jobless claims came in at 1,777,000, versus the adjusted number of 1,799,000 people from the week prior, down 22,000 week-over-week.
Stocks closed lower on Friday of last week, but mixed week-over-week
The DOW closed lower on Friday of last week, down -107.58 points (-0.2%), closing out the week at 53,732.41, down -304.52 points week-over-week. The S&P 500 closed lower on Friday of last week, down -13.23 points (-0.17%), and closed out the week at 7,785.76, up 28.12 points week-over-week. The NASDAQ closed lower on Friday of last week, down -73.86 points (-0.28%), and closed out the week at 26,729.16, up 38.54 points week-over-week.
In overnight trading, DOW futures traded lower and are expected to open at 53,712 this morning, down -95 points from Friday’s close.
WTI Crude oil closed higher on Friday of last week, and higher week-over-week
West Texas Intermediate (WTI) crude closed up $1.15 per barrel (1.42%), to close at $82.40 on Friday of last week, and up $4.22 per barrel week-over-week. Brent crude closed up $1.45 per barrel (1.67%), to close at $88.52, up $4.97 per barrel week-over-week.
One Exchange WCS (Western Canadian Select) for September delivery settled on Friday of last week at US$16.55 below the WTI-CMA (West Texas Intermediate – Calendar Month Average). The implied value was US$63.43 per barrel.
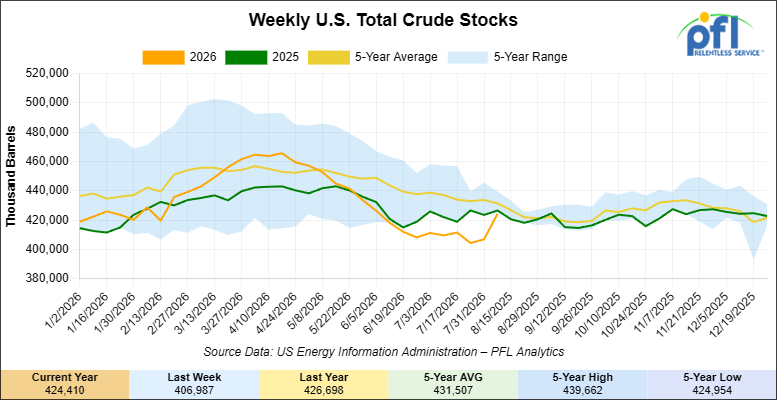
U.S. commercial crude oil inventories (excluding those in the Strategic Petroleum Reserve) increased by 17.4 million barrels week-over-week. At 424.4 million barrels, U.S. crude oil inventories are 2% below the five-year average for this time of year.
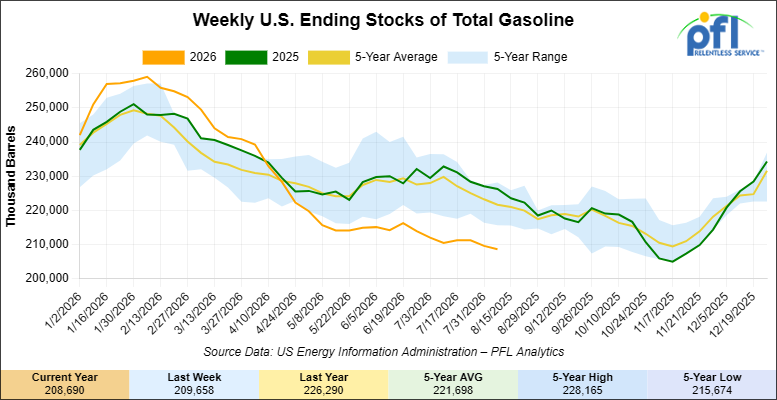
Total motor gasoline inventories decreased by 1 million barrels week-over-week and are 6% below the five-year average for this time of year.
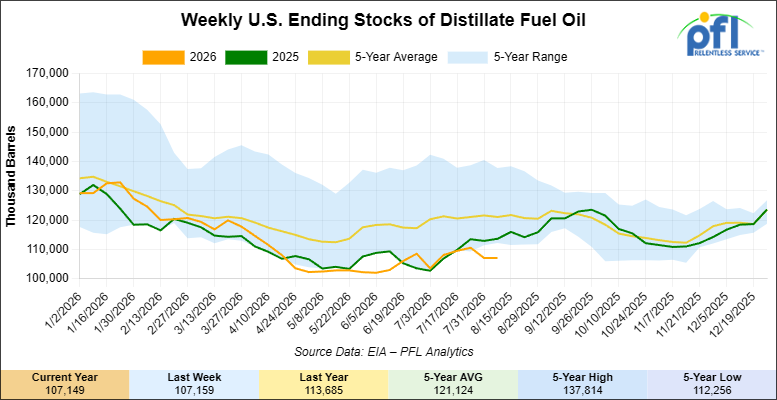
Distillate fuel inventories decreased by 100,000 barrels week-over-week and are 12% below the five-year average for this time of year.
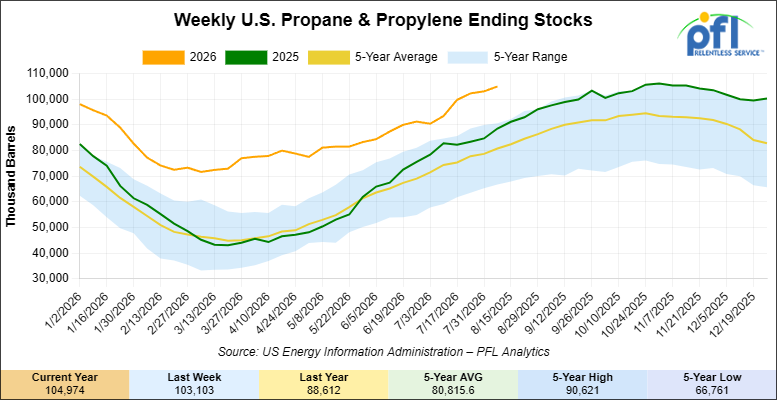
Propane/propylene inventories increased by 1.9 million barrels week-over-week and are 31% above the five-year average for this time of year.
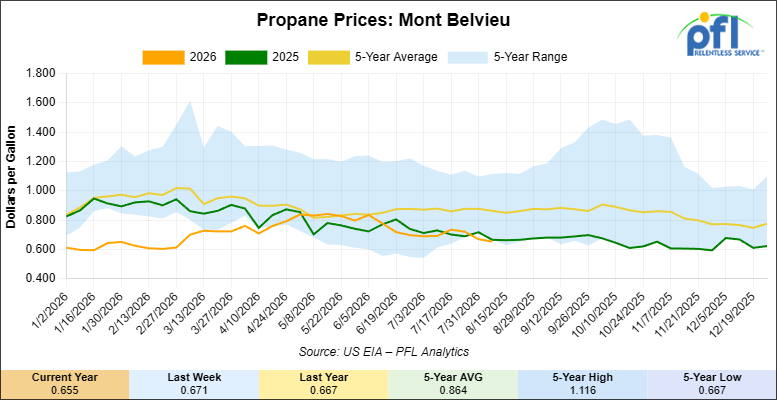
Propane prices closed at 65.5 cents per gallon on Friday of last week, down 1.6 cents per gallon week-over-week, and down 1.2 cents year-over-year.
Overall, total commercial petroleum inventories increased by 15.7 million barrels week-over-week during the week ending August 7, 2026.
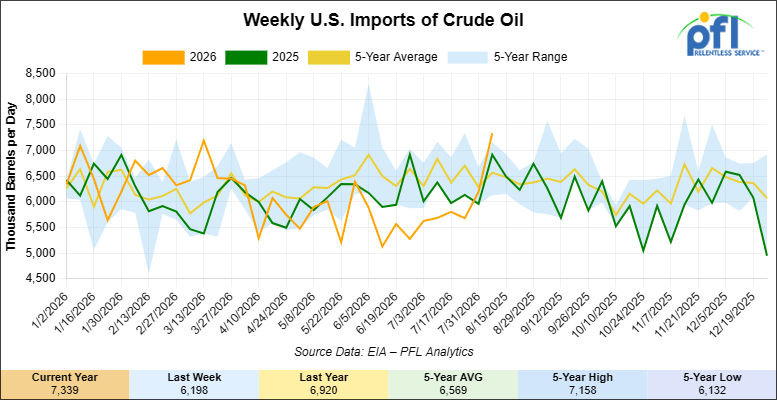
U.S. crude oil imports averaged 7.3 million barrels per day during the week ending August 7, 2026, an increase of 1.1 million barrels per day week-over-week. U.S. crude oil imports averaged 7.3 million barrels per day during the week ending August 7, 2026, increased by 1.14 million barrels per day week-over-week. Over the past four weeks, crude oil imports averaged 6.3 million barrels per day, 0.1% more than the same four-week period last year. Total motor gasoline imports (including both finished gasoline and gasoline blending components) averaged 583,000 barrels per day, and distillate fuel imports averaged 111,000 barrels per day during the week ending August 7, 2026
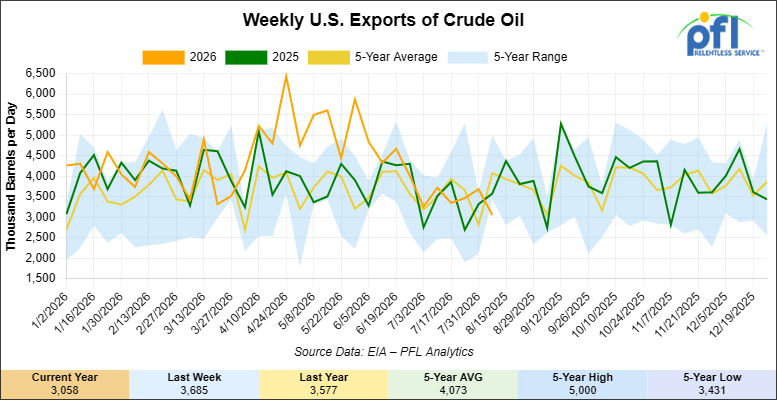
U.S. crude oil exports averaged 3.058 million barrels per day during the week ending August 7, 2026, a decrease of 627,000 barrels per day week-over-week. Over the past four weeks, crude oil exports averaged 3.391 million barrels per day.
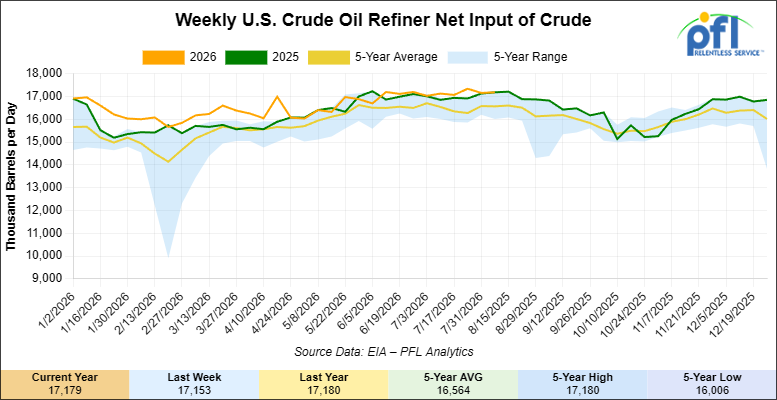
U.S. crude oil refinery inputs averaged 17.2 million barrels per day during the week ending August 7, 2026, which was 26,000 barrels per day more week-over-week.
WTI is poised to open at $82.93, up $0.53 per barrel from Friday’s close.
North American Rail Traffic
Week Ending August 12, 2026:
Total North American weekly rail volumes were up (+4.90%) in week 33, compared with the same week last year. Total Carloads for the week ending August 12, 2026 were 339,555, up (+5.52%) compared with the same week in 2025, while weekly Intermodal volume was 359,464, up (+4.31%) year over year. 9 of the AAR’s 11 major traffic categories posted year-over-year increases. The largest decrease came from Motor Vehicles and Parts (-4.35%). The largest increase was Metallic Ores and Metals (+14.49%).
In the East, CSX’s total volumes were up (+6.83%), with the largest decrease coming from Forest Products (-2.08%), while the largest increase came from Metallic Ores and Metals (+19.51%). NS’s total volumes were up (+3.54%), with the largest increase coming from Petroleum & Petroleum Products (+25.84%), while the largest decrease came from Motor Vehicles and Parts (-9.50%).
In the West, BNSF’s total volumes were up (+4.27%), with the largest increase coming from Metallic Ores and Metals (+34.02%), while the largest decrease came from Motor Vehicles and Parts (-15.77%). UP’s total volumes were up (+6.89%), with the largest increase coming from Other (+20.55%), while the largest decrease came from Coal (-2.19%).
In Canada, CN’s total volumes were up (+1.07%), with the largest increase coming from Grain (+20.31%), while the largest decrease came from Intermodal Units (-21.85%). CPKCS’s total volumes were up (+1.98%), with the largest increase coming from Metallic Ores and Metals (+47.32%), while the largest decrease came from Motor Vehicles and Parts (-24.39%).
Source Data: AAR – PFL Analytics
North American Rig Count Summary
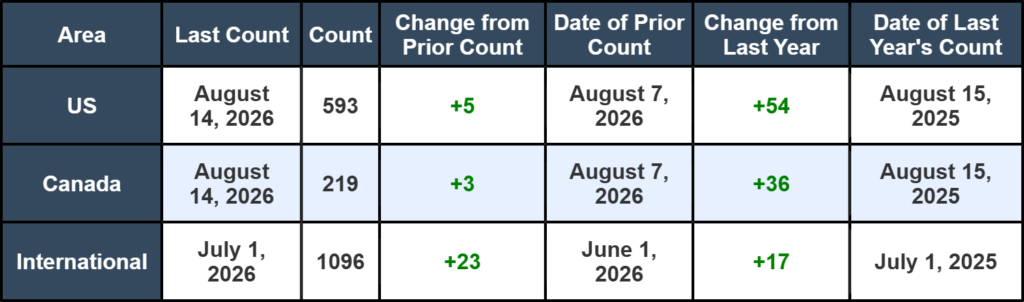
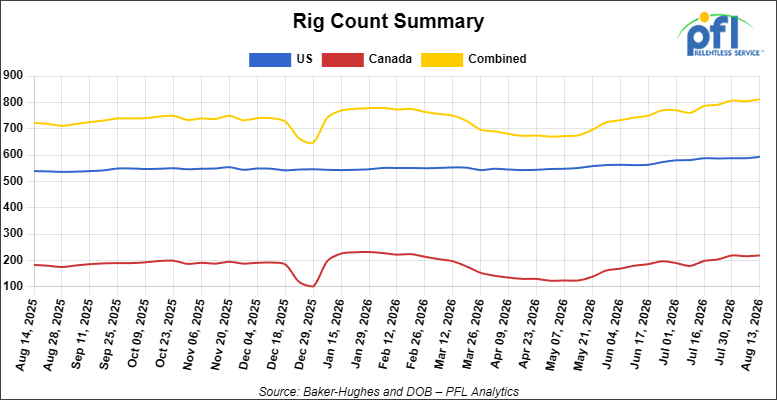
North American rig count was up by +8 rigs week-over-week. The US rig count was up by +5 rigs week-over-week, and up by +54 rigs year-over-year. The US currently has 593 active rigs. Canada’s rig count was up by +3 rigs week-over-week and up by +36 rigs year-over-year. Canada currently has 219 active rigs. Overall, year-over-year we are up by +90 rigs collectively.
We are watching a few things out there for you:
We Are Watching Petroleum Carloads
The four-week rolling average of petroleum carloads carried on the six largest North American railroads rose to 29,912 from 29,770 which was an increase of +142 rail cars week-over-week. Canadian volumes were higher. CN’s shipments were higher by +7.0% week-over-week, CPKC’s volumes were higher by +3.0% week-over-week. U.S. shipments were mostly higher. The CSX was the sole decliner and was down by -9.0% week-over-week. The UP had the largest percentage increase and was up by +6.0% week-over-week.
We Continue to Watch Our Strategic Petroleum Reserves
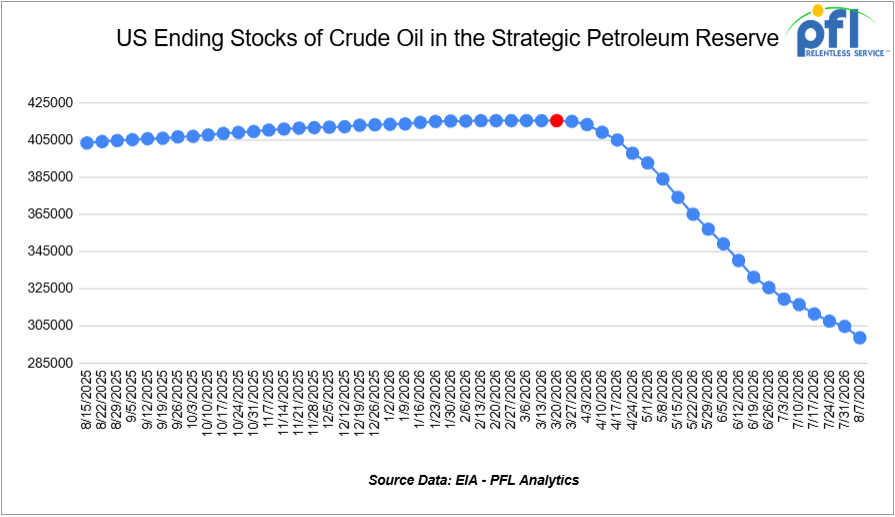
The ongoing emergency drawdown of the U.S. Strategic Petroleum Reserve (SPR) remains a major component of global efforts to offset crude oil supply disruptions stemming from the conflict involving Iran and the continued restrictions on oil shipments through the Strait of Hormuz. Since March, the Department of Energy (DOE) has awarded exchanges covering more than 133 million barrels of crude oil, with additional releases expected as part of a broader international response coordinated through the International Energy Agency (IEA). DOE’s most recent publicly documented award total remains more than 133 million barrels, while the department has continued executing the broader 172-million-barrel commitment.
The United States continues to execute its commitment to make available up to 172 million barrels from the SPR under the IEA’s collective plan to inject roughly 400 million barrels into global energy markets. Officials have argued that the releases are necessary to help stabilize crude supplies and limit further increases in fuel prices as refiners compete for replacement barrels amid ongoing transportation disruptions. The IEA’s coordinated action remains the largest emergency oil-stock release in the agency’s history.
As releases have accelerated, inventories in the SPR have declined to 298.694 million barrels, down from 415.442 million barrels at the start of the conflict with Iran and reaching their lowest level since January 1983. The SPR declined by approximately 6.1 million barrels during the week ending August 7, which is one of the largest weekly withdrawals of the current emergency drawdown. Since the first SPR drawdown began, the United States has withdrawn approximately 116.748 million barrels, equivalent to an average of roughly 833,914 barrels per day through the week ending August 7, 2026.
Global petroleum inventories have also tightened considerably. The IEA has reported substantial draws in commercial crude and refined-product stockpiles across major consuming nations, underscoring the strain that the conflict has placed on world energy markets. While oil flows through the Strait of Hormuz have partially recovered from their initial near-shutdown, the IEA continues to identify significant uncertainty surrounding the pace and durability of the recovery.
The Administration continues to emphasize that the current program consists primarily of exchange agreements, rather than outright sales. Under these arrangements, companies receiving crude oil today are required to return the borrowed barrels in the future along with additional volumes as a premium. DOE has stated that its exchange structure is designed to return the borrowed crude with additional premium barrels, with the stated objective of strengthening the SPR over time.
We Are Watching Rail Car Storage
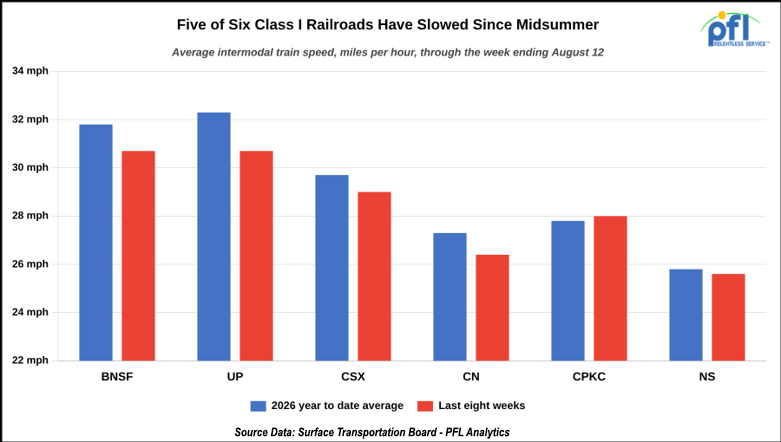
Weekly service data, filed with the Surface Transportation Board, shows the same tightening. Tank cars on line across the six Class I railroads stood near 257,000 in the week ending Wednesday of last week, up roughly 7,700 since January and about 4,700 higher than a year ago. Velocity is not helping matters: five of the six Class I’s have run slower over the past eight weeks than their 2026 averages, and slower railroads soak up cars.
The supply side is not keeping a steady pace. Industry orders in the second quarter came in around 5,800 cars against roughly 6,200 a year earlier, and build slots for new tank cars stretch well into 2027. A DOT-117J’s coiled and isolated car now commands $1,000 (+/-) per car per month for a one-to-five-year term. It seems to us at PFL that the easy capacity is starting to come back to come back to work, and much of what remains in storage as it relates to tank cars is a fleet nobody really wants (DOT 111, CPC 1238’s, 117R’s). We will be keeping our eye on this one. Call PFL today for available tank cars.
We Continue to Watch Crude by Rail
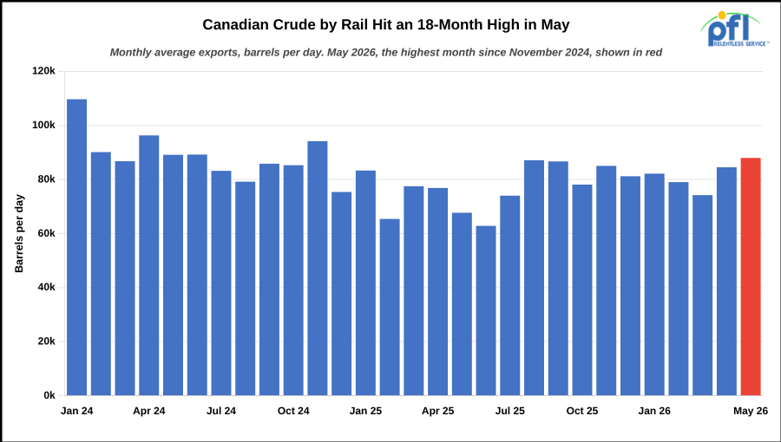
Canadian crude by rail exports averaged 87,977 barrels per-day in May, up 4% from April, 30% higher than a year earlier, and the highest monthly volume since November 2024. Volumes have climbed steadily off the March low of about 74,200 barrels per-day. Last year averaged roughly 77,000 barrels per-day, a 13-year low, so the direction of travel has changed.
The push is coming from the pipelines. Enbridge apportioned heavy crude nominations on the Mainline by 14% for May flow, and Trans Mountain ran near effective capacity through springtime before accepting all nominations for August. Western Canadian Select at Hardisty closed at $16.55 per barrel under WTI at Houston last week for September delivery, at the edge of the range where rail works for shippers without commitments, against an Alberta to Gulf coast unit train rate near $16.80 per barrel.
CPKC said second quarter crude volumes grew in both conventional service and undiluted bitumen out of the Hardisty diluent recovery unit, though Gibson has left its expansion of that facility on the back burner while pipeline space lasts. Producers keep adding barrels: Cenovus expects to run above 1 million barrels of oil equivalent per day, with new in-situ volumes at Leismer and Blackrod ramping through 2027. Not many 117J crude cars are available, build times could run one to two years, and car owners still want five-year commitments to build new cars, so any move back to rail will be slow. It seems to us at PFL that the lease commitments, and not the arbitrage, will set the pace of whatever comes next. Time will certainly tell!
We Continue to Watch Enbridge
The U.S. Army Corps of Engineers approved the Line 5 tunnel Wednesday of last week, finding the project “not contrary to the public interest” in its record of decision. The review was fast-tracked under the January 2025 energy emergency order. The tunnel would carry a new 30-inch segment of the 540,000 barrel per day line beneath the Straits of Mackinac, replacing the two aging 20-inch pipes that sit exposed on the lakebed.
Construction still cannot begin. The Michigan Supreme Court vacated the state permit at the end of July, ruling that the Public Service Commission ran to narrow of a review, and Governor Whitmer and Attorney General Nessel continue to press for a full shutdown of the line. Six years into permitting, the project now holds a federal blessing but no state path.
Alberta and Ontario, for their part, keep studying the Northern Shield corridor, a 2,050-mile line from Hardisty to Sarnia that would bypass Michigan and the U.S. entirely. We have said before that we doubt Line 5 ever gets shut down, and nothing last week changed our view. Stay tuned to PFL.
We Continue to Watch Left Wing Carney
Ottawa launched a CA$100 million rebate program last week covering half the cost of moving Canadian steel between provinces by rail or water. Applications under the Commodities Sectoral Support Program opened August 10th, and the money runs to summer 2027 or until it is claimed. Only steel with a Canadian origin and destination qualifies, in carload service for rail.
The arithmetic is simple enough. A 50% rebate means the fund covers about CA$4,000 in line-haul, the program is good for roughly 50,000 subsidized carloads, call it 1,000 cars a week for a year. Gondola and coil car demand gets a real bump, and the carriers will take it. But, the program exists because the U.S. tariff wall took away the export market, and the government is now paying to redirect steel it can no longer sell south.
Meanwhile, the Canada Gazette comment period on the national interest designation for a West Coast pipeline closes September 18. A subsidy for domestic steel movements and a comment period for a pipeline: seemingly that is the industrial strategy. It’s just a program for now; time will tell. Where is the money coming from is what we ask!
We Are Watching Grain
CN closed the 2025-26 crop year with a record 33.8 million metric tonnes of grain out of western Canada, announced last Tuesday, beating the prior record of 31.2 million tonnes set a year earlier. July alone came in at 2.62 million tonnes, past a July record that had stood since 2020. The railroad’s new grain plan calls for 30 to 33 million tonnes in 2026-27, which pushes toward the top of what its network can sustain.
CPKC set its own record: 30.66 million tonnes of Canadian grain and grain products for the crop year, with second quarter grain carloads up 18% to a record 168,000. Here in the U.S., grain carloads are up 13% through July, nearly 81,000 cars, the biggest absolute gain of any commodity group.
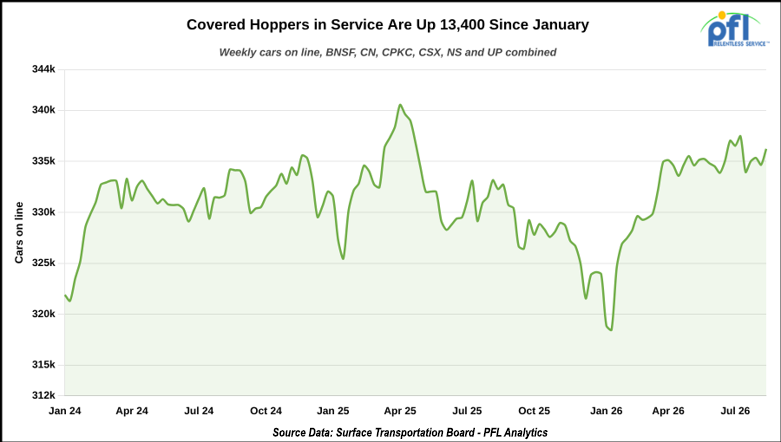
The equipment is following the crop. Covered hoppers on line across the Class I’s are up about 13,400 since January and are back near the highs of last spring. Two record crop years back to back, both Canadian railroads planning for a third, and the covered hopper fleet already working hard. Harvest will tell us the rest!
We Are Watching Tariffs
The Commerce Department proposed adding another 14 product categories to the Section 232 steel and aluminum tariffs on August 6th, with comments due August 27th. Rail cars have been inside the tariff wall since last year’s derivative expansion, and tank cars have been assessed on full value since April.
GATX flagged unresolved tariff exposure on new cars during its second quarter call. Between tariffed steel, tariffed components, and a builder backlog stretching into 2027, replacement cost on a new tank car keeps moving in one direction. Lease rates are holding firm, and renewals get priced off replacement cost.
It seems to us at PFL that fleet decisions made over the next few quarters will be made against a structurally higher cost base, and the comment docket closes in under two weeks. We will be keeping our eye on this one!
We Continue to Watch the UP and NS Merger
Seven Republican State Attorney Generals have asked the Surface Transportation Board to reject the $85 billion Union Pacific and Norfolk Southern combination in a letter entered into the record on Tuesday of last week. Montana’s Austin Knudsen led the filing, joined by the attorneys general of Florida, Iowa, Kansas, North Dakota, South Dakota and Tennessee. It is the third such letter from the group since the application was filed.
This round takes aim at the railroads’ proposed Committed Gateway Pricing arrangement, which would protect rates on certain existing interline moves with BNSF and CSX through Chicago, St. Louis, Memphis and New Orleans. The states argue the remedy preserves a narrow slice of what shippers already have and creates no new routing option for anyone. Two days later, the same group asked the Justice Department’s Antitrust Division to weigh in on the deal.
The board may still find a path to approval with conditions, and the railroads continue to argue the combination improves service by taking out interchange points. For shippers, the outcome will shape routing options, cycle times and car utilization on every east-west move for a generation. We will keep following the docket.
We Are Watching the Gulf Coast
Williams agreed to acquire Momentum Midstream for up to $5.5 billion earlier this month, adding more than 4,000 miles of Haynesville gathering pipe, 6 Bcf per day of capacity and two expansion projects pointed at Gulf Coast LNG and power demand. The deal includes the $1.5 billion Delta Access expansion along the Transco corridor, targeted for 2029.
Cheniere, for its part, said first LNG from the seventh and final train of its Corpus Christi Stage 3 expansion is expected imminently, and raised 2026 production guidance to 53 to 54 million tonnes. Trains 8 and 9 are already under construction next door. The buildout has run ahead of schedule the whole way.
Every incremental Bcf that flows into Gulf Coast liquefaction and the crackers beside it pulls plastics, LPGs and chemicals into rail-served supply chains. Plastic hopper and pressure car demand follows this buildout, with a lag measured in quarters. Worth watching as the projects come online.
We Are Watching Key Economic Indicators
Producer Price Index
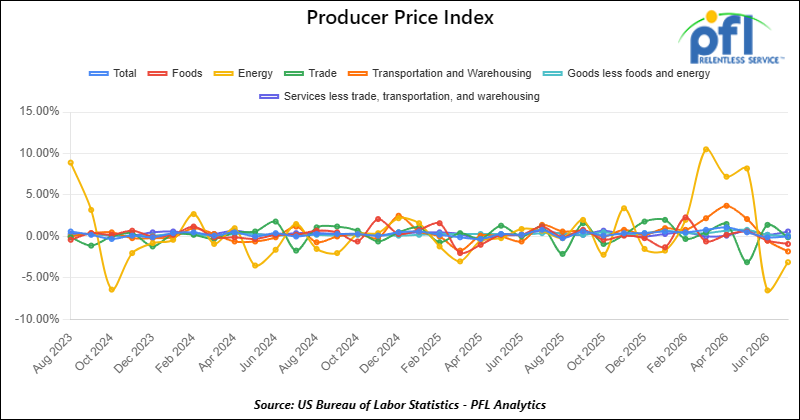
In July 2026, the Producer Price Index (PPI) for final demand was unchanged month-over-month, following a 0.1% decline in June, indicating that overall producer price pressures stabilized after the sharp increases earlier in the year. Core PPI (final demand less foods, energy, and trade services) increased 0.4% month over month, accelerating from June’s 0.1% increase and indicating that underlying producer-price pressures remained elevated despite the stability in headline PPI. The monthly results reflected a 0.7% decline in final demand goods, which followed a 1.4% decline in June, while final demand services increased 0.2%. Within goods, energy prices declined 3.1%, led by a 5.7% drop in gasoline prices, while food prices fell 0.9%. Goods less foods and energy increased 0.1%. Within services, prices rose 0.2%, with services less trade, transportation, and warehousing increasing 0.6%, while transportation and warehousing declined 1.8% and trade services fell 0.1%. Overall, the July data showed that lower energy and goods prices continued to restrain headline PPI, while underlying service-sector and core producer prices remained firm.
In July 2026, the Consumer Price Index (CPI) increased 0.1% month-over-month, reversing June’s 0.4% decline, while the index was up 3.4% year-over-year. Core CPI (all items less food and energy) increased 0.2% month-over-month and was up 2.5% year over year. Shelter increased 0.1% and accounted for roughly two-thirds of the monthly increase, while food prices also increased 0.1%. Energy prices declined 1.5% during the month, helping to limit the overall increase in headline inflation. Within core inflation, medical care, airline fares, communication, education, and recreation increased, while motor vehicle insurance declined. The July report showed a modest reacceleration in monthly inflation after June’s decline, although the 12-month headline and core measures both continued to ease, suggesting that underlying inflation pressures remain elevated, but are gradually moderating.
Lease Bids
- 20-50, 4000-5000 Covered Hoppers located off of UP or BNSF in Houston. For use in Urea, Potash, and Ammonium Sulfate service. Period: 6-12 Months.
- 30-50, 25.5K DOT 111 Tanks located off of All Class 1s in various locations. For use in Asphalt service. Period: 1-3 Years.
- 40, 29K DOT 111 Tanks located off of UP or BNSF in the Midwest. For use in Veg Oil service. Period: 5 Year.
- 20, DOT 117J Tanks located off of NS, CSX, CN, or CPKC in various locations. For use in C5 service. Period: 1 year. Need gauge rods.
- 300, 5200CF Covered Hoppers located off of CP or CM in Canada. For use in Petcoke service. Period: 3 Year.
- 10, 30K 117J Tanks located off of BNSF in Canada. For use in Propane or Butane service. Period: 3 Year.
- 20, 28K or larger 117J Tanks located off of BNSF or UP in California. For use in Crude service. Period: 6 months.
- 75, 30K DOT 117 Tanks located off of NS in Ohio. For use in Condensate service. Period: 6-12 Months. Mag Rods Not Needed.
- 100, 28.3K DOT 111 or 117 Tanks located off of CP or CN in Canada. For use in VGO service. Period: 1-3 Years.
- 5, 28.3K DOT 111 or 117 Tanks located off of CN in Canada. For use in Bitumen service. Period: Trip Lease.
- 5-10, 25.5K DOT 111 Tanks located off of CN in Canada. For use in Caustic service. Period: 3-6 Months.
- 100, 340W Pressure Tank located off of CN or CP in Canada. For use in Propane service. Period: 6 Months.
- 10-20, 3200 or 3281 Covered Hoppers located off of CN or CP in Canada. For use in Sodium Sulphate service. Period: 3-5 years. Lined.
- 50, 340W Pressure Tanks located off of CN or CP in Canada. For use in Propane service. Period: Winter.
- 30-50, 340W pressure Tanks located off of NS or CSX in Northeast U.S. For use in Propane service. Period: Winter.
- 25, 340W Pressure Tanks located off of UP or BN in US. For use in Propane service. Period: Winter.
- 50, 28.3K 117J Tanks located off of BNSF in Kansas/Oklahoma. For use in Fuel Oil service. Period: 6 Months.
- 100, 28.3K 117J Tanks located off of CN in Canada. For use in Diesel service. Period: 1 year.
Sales Bids
- 28, 3400CF Covered Hoppers located off of UP or BNSF in Texas. For use in Cement service. Cement Gates needed.
- 20, 17K DOT111 Tanks located off of various class 1s in various locations. For use in corn syrup service.
- 120, Various Open-Top Aluminum Rotary Gondolas located off of various class 1s in various locations. For use in Sulphur service. Built 2004 or later.
- 12, 21.5K-25K DOT 111 Tanks located off of Various Class 1s in Michigan. For use in Diesel, Asphalt, Crude service. Coiled and Insulated.
Lease Offers
- 21, 6351 Covered Hoppers located off of CN in Wisconsin. Last used in DDG. Available until February 2027.
- 29, 6500 Covered Hoppers located off of CN in Wisconsin. Last used in DDG. Available until February 2027.
- 29, 25.5K DOT117J Tanks located off of UP or BNSF in Texas. Cars are currently clean.
- 200, 340W DOT 112J Tanks located off of all class 1s in Multiple Locations. Last used in propane and butane. Cars are currently clean.
- 15, 6200CF Covered Hoppers located off of all class 1s in Wisconsin. Last used in plastic. Cars are currently clean.
- 30, 6500CF Covered Hoppers located off of all class 1s in Wisconsin. Last used in plastic. Cars are currently clean.
- 6, 21K Stainless Steel Tanks located off of UP in Texas / Mexico Border. Last used in surfactant. Cars are currently clean.
- 100, 28.4K DOT 117J Tanks located off of UP or BNSF in Beaumont, TX. Cars are currently clean.
- 50, 30K DOT117J Tanks located off of UP or BNSF in the South. Last used in ethanol.
- 30, 30K DOT 117R Tanks located off of BNSF in Washington. Last used in renewable jet fuel.
- 80, 30K DOT 117R Tanks located off of BNSF in Washington. Last used in renewable diesel.
- 10, 30K DOT 117R Tanks located off of BNSF in Washington. Last used in renewable naphtha.
- 10, 29K DOT 117R Tanks located off of BNSF and UP in Texas. Last used in gasoline additive. Coiled and Insulated.
- 39, 31K CPC1232 Tanks located off of All Class 1s in Iowa. Last used in diesel.
- 2, 30K DOT 117R Tanks located off of BNSF and UP in Texas. Last used in Diesel.
- 1, 30K DOT 117R Tanks located off of BNSF and UP in Texas. Last used in gas blend stock.
- 3, 30K DOT 117R Tanks located off of BNSF and UP in Texas. Last used in gasoline.
- 41, 30K DOT 111 Tanks located off of in Brownsville. Last used in Diesel. Cars are currently clean.
Sales Offers
- 81, 31.8K CPC1232 Tanks located off of UP or BNSF in TX. Last used in Multiple Services. Requal Due in 2025.
- 35, 3400CF Covered Hoppers located off of UP or BNSF in the Midwest. Last used in Sand.
- 25, 30K 117J Tanks located off of CSX in Jackson, TN. Last used in Fuels. Newly Requalified.
- 15, 5750 CF Hopper located off of CSX, NS, CP, CN, BNSF, UP in St Louis. Last used in Grain.
- 50, 30 DOT 111 Tank located off of multiple class 1s in multiple location. Last used in Fuels.
Call PFL today to discuss your needs and our availability and market reach. Whether you are looking to lease cars, lease out cars, buy cars, or sell cars call PFL today at 239-390-2885
Railcar for Sale or Lease
| CAT | Type | Capacity | GRL | QTY | LOC | Class | Prev. Use | Offer | Note |
|---|
| CAT | Type | Size | GRL | QTY | LOC | Class | Term | Commodity | Offer | Note |
|---|
| CAT | Type | Capacity | GRL | QTY | LOC | Class | Prev. Use | Clean | Offer | Note |
|---|
| CAT | Type | Capacity | GRL | QTY | LOC | Class | Commodity | Offer | Note |
|---|
PFL will be at the Following Conferences

- Where: The Westin Galleria Dallas
- Attending: David Cohen (954-729-4774), and Curtis Chandler (239-405-3365)
- Conference Website

- Where: The Westin Galleria Dallas
- Attending: Brian Baker (239.297.4519)
- Conference Website