

“Opportunity is missed by most people because it is dressed in overalls and looks like work.”
– Thomas A. Edison
Jobs Update
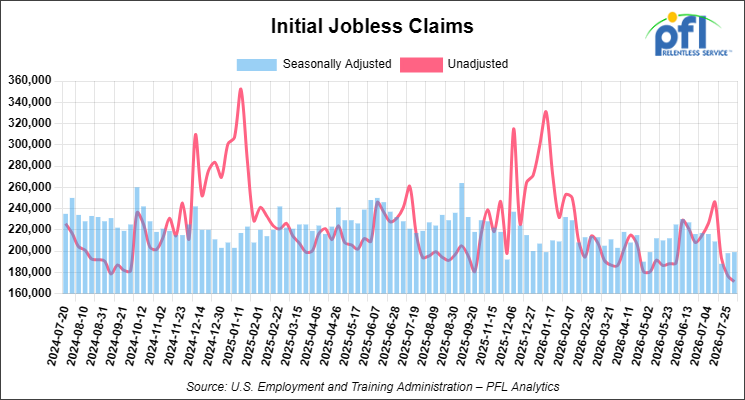
Initial jobless claims seasonally adjusted for the week ending August 1, 2026 came in at 199,000, versus the adjusted number of 198,000 people from the week prior, up 1,000 people week-over-week.
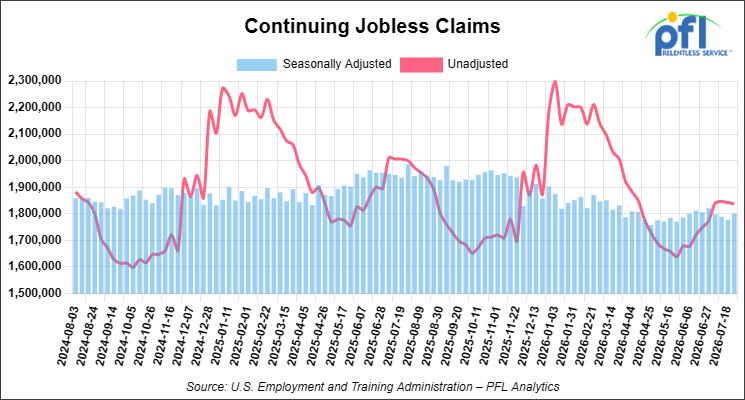
Continuing jobless claims came in at 1,801,000, versus the adjusted number of 1,777,000 people from the week prior, up 24,000 week-over-week.
Stocks closed higher on Friday of last week and higher week-over-week
The DOW closed higher on Friday of last week, up 151.83 points (0.28%), closing out the week at 54,036.93, up 1,551.90 points week-over-week. The S&P 500 closed higher on Friday of last week, up 47.68 points (0.62%), and closed out the week at 7,757.64, up 267.92 points week-over-week. The NASDAQ closed higher on Friday of last week, up 342.26 points (1.30%), and closed out the week at 26,690.62, up 1,316.77 points week-over-week.
In overnight trading, DOW futures traded lower and are expected to open at 54,123 this morning, down 29 points from Friday’s close.
Crude oil closed higher on Friday of last week, but lower week-over-week
West Texas Intermediate (WTI) crude closed up $0.89 per barrel (1.15%), to close at $78.18 on Friday of last week, but down $6.49 per barrel week-over-week. Brent crude closed up $1.06 per barrel (1.3%), to close at $83.55, but down $6.57 per barrel week-over-week.
One Exchange WCS (Western Canadian Select) for September delivery settled on Friday of last week at US$14.70 below the WTI-CMA (West Texas Intermediate – Calendar Month Average). The implied value was US$61.04 per barrel.
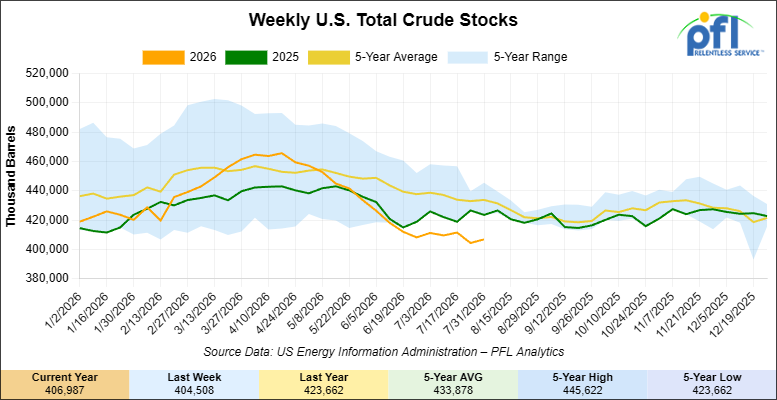
U.S. commercial crude oil inventories (excluding those in the Strategic Petroleum Reserve) increased by 2.5 million barrels week-over-week. At 407 million barrels, U.S. crude oil inventories are 6% below the five-year average for this time of year.
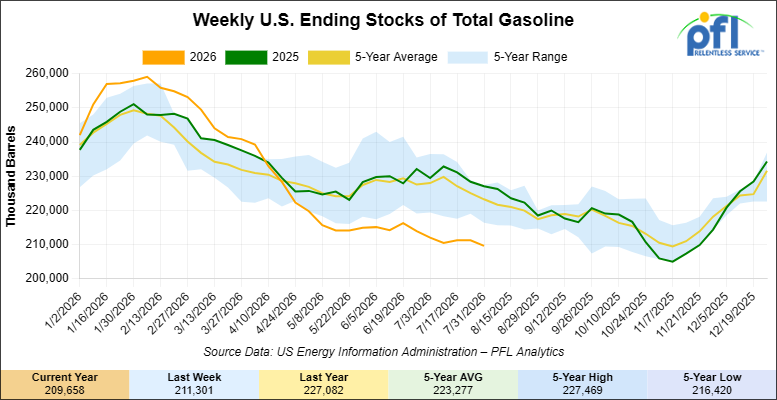
Total motor gasoline inventories decreased by 1.6 million barrels week-over-week and are 7% below the five-year average for this time of year.
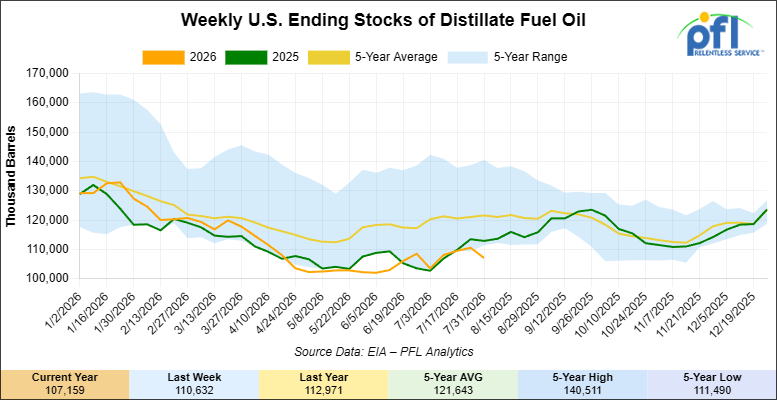
Distillate fuel inventories decreased by 3.5 million barrels week-over-week and are 12% below the five-year average for this time of year.
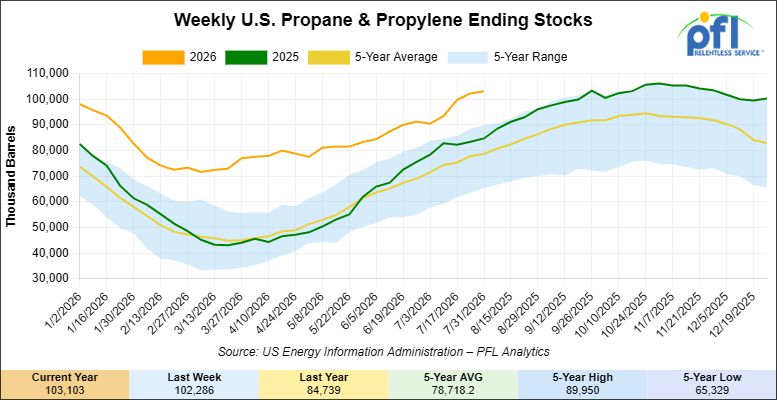
Propane/propylene inventories increased by 800,000 barrels week-over-week and are 32% above the five-year average for this time of year.
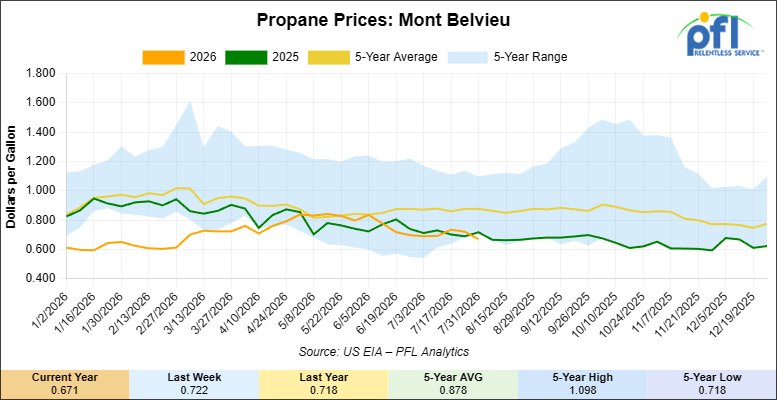
Propane prices closed at 67.1 cents per gallon on Friday of last week, down 5.1 cents per gallon week-over-week, and down 4.7 cents year-over-year.
Overall, total commercial petroleum inventories increased by 2 million barrels week-over-week during the week ending July 31, 2026.
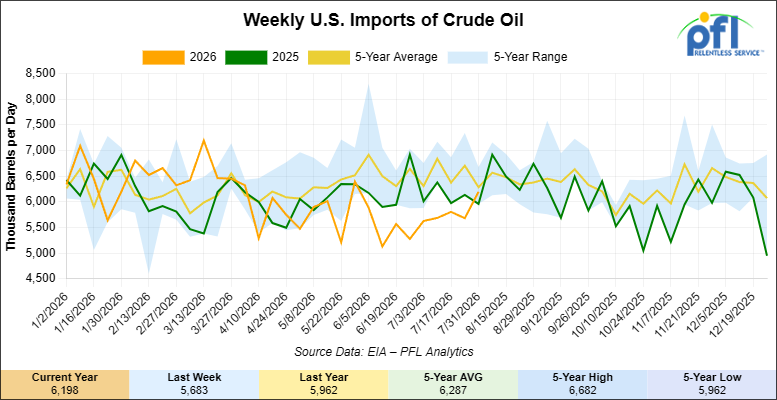
U.S. crude oil imports averaged 6.2 million barrels per day during the week ending July 31, 2026, an increase of 515,000 barrels per day week-over-week. Over the past four weeks, crude oil imports averaged 5.8 million barrels per day, 4.4% less than the same four-week period last year. Total motor gasoline imports (including both finished gasoline and gasoline blending components) averaged 463,000 barrels per day, and distillate fuel imports averaged 99,000 barrels per day during the week ending July 31, 2026.
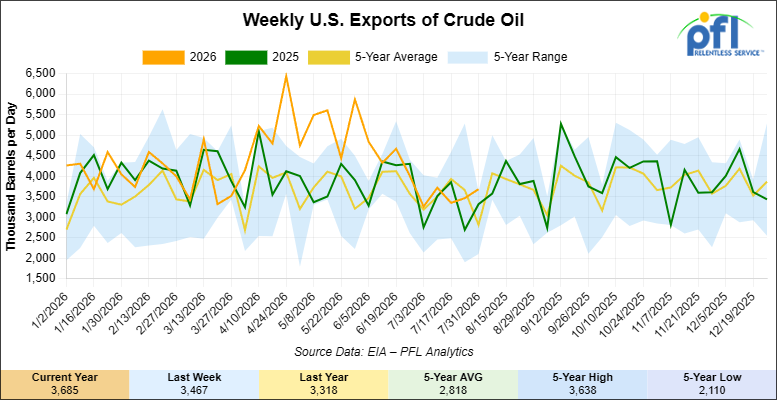
U.S. crude oil exports averaged 3.685 million barrels per day during the week ending July 31, 2026, an increase of 218,000 barrels per day week-over-week. Over the past four weeks, crude oil exports averaged 3.557 million barrels per day.
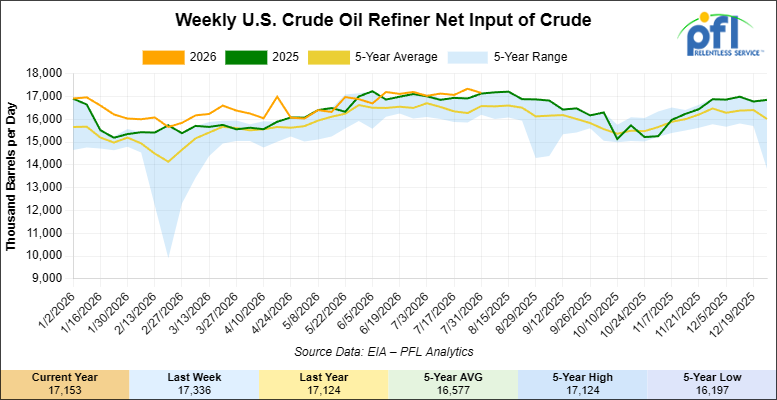
U.S. crude oil refinery inputs averaged 17.2 million barrels per day, during the week ending July 31, 2026, which was 183,000 barrels per day less week-over-week.
WTI is poised to open at $78.80, up $0.62 per barrel from Friday’s close.
North American Rail Traffic
Week Ending August 5, 2026:
Total North American weekly rail volumes were up (+3.56%) in week 32, compared with the same week last year. Total Carloads for the week ending August 5, 2026 were 336,462, up (+2.53%) compared with the same week in 2025, while weekly Intermodal volume was 355,383, up (+4.54%) year over year. 8 of the AAR’s 11 major traffic categories posted year-over-year increases. The largest decrease came from Coal (-4.23%). The largest increase was Metallic Ores and Metals (+9.96%).
In the East, CSX’s total volumes were up (+3.21%), with the largest decrease coming from Nonmetallic Minerals (-8.26%), while the largest increase came from Grain (+26.94%). NS’s total volumes were up (+3.30%), with the largest increase coming from Petroleum & Petroleum Products (+30.30%), while the largest decrease came from Motor Vehicles and Parts (-11.87%).
In the West, BNSF’s total volumes were up (+6.02%), with the largest increase coming from Nonmetallic Minerals (+20.45%), while the largest decrease came from Chemicals (-5.14%). UP’s total volumes were up (+2.10%), with the largest increase coming from Metallic Ores and Metals (+14.70%), while the largest decrease came from Grain (-13.70%).
In Canada, CN’s total volumes were up (+0.48%), with the largest increase coming from Farm Products (+22.53%), while the largest decrease came from Other (-15.32%). CPKCS’s total volumes were up (+5.16%), with the largest increase coming from Nonmetallic Minerals (+14.64%), while the largest decrease came from Petroleum & Petroleum Products (-2.52%).
Source Data: AAR – PFL Analytics
North American Rig Count Summary
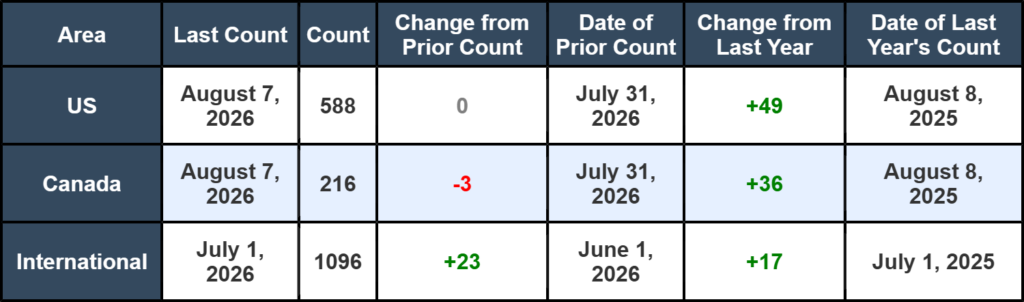
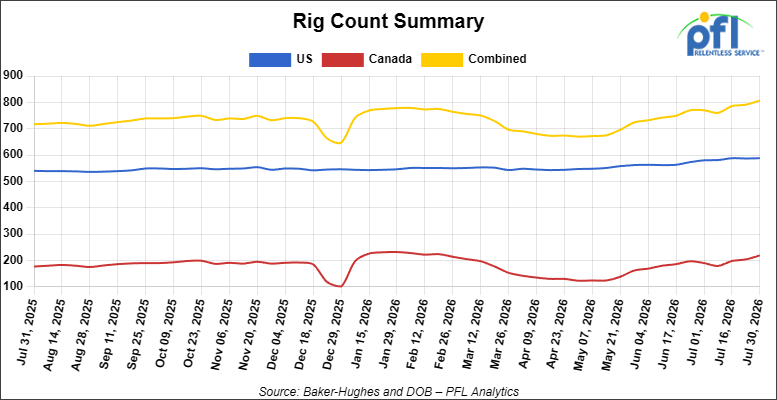
North American rig count was down by -3 rigs week-over-week. The US rig count was unchanged week-over-week, and up by +49 rigs year-over-year. The US currently has 588 active rigs. Canada’s rig count was down by -3 rigs week-over-week but up by +36 rigs year-over-year. Canada currently has 216 active rigs. Overall, year-over-year we are up by +85 rigs collectively.
International rig count was up by +23 rigs month-over-month and up by +17 rigs year-over-year. Internationally there are 1096 active rigs.
We are watching a few things out there for you:
We Are Watching Petroleum Carloads
The four-week rolling average of petroleum carloads carried on the six largest North American railroads rose to 29,770 from 29,612 which was an increase of +158 rail cars week-over-week. Canadian volumes were higher. CN’s shipments were higher by +2.0% week-over-week, CPKC’s volumes were higher by +2.0% week-over-week. U.S. shipments were mostly higher. The UP was the sole decliner and was down by -5.0% week-over-week. The NS had the largest percentage increase and was up by +11.0% week-over-week.
We Continue to Watch Our Strategic Petroleum Reserves
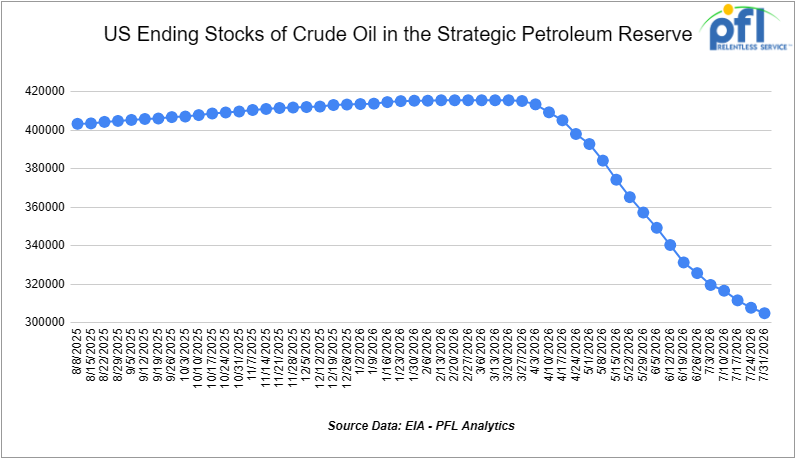
The ongoing emergency drawdown of the U.S. Strategic Petroleum Reserve (SPR) remains a major component of global efforts to offset crude oil supply disruptions stemming from the conflict involving Iran and the continued restrictions on oil shipments through the Strait of Hormuz. Since March, the Department of Energy (DOE) has awarded exchanges covering more than 133 million barrels of crude oil, with additional releases expected as part of a broader international response coordinated through the International Energy Agency (IEA).
The United States continues to execute its commitment to make available up to 172 million barrels from the SPR under the IEA’s collective plan to inject roughly 400 million barrels into global energy markets. Officials have argued that the releases are necessary to help stabilize crude supplies and limit further increases in fuel prices as refiners compete for replacement barrels amid ongoing transportation disruptions.
As releases have accelerated, inventories in the SPR have declined to 304.785 million barrels, down from 415.442 million barrels at the start of the conflict with Iran and reaching their lowest level since March 1983. Recent weekly withdrawals have ranked among the largest on record, highlighting the scale of the government’s intervention in oil markets. Since the first SPR drawdown began, the United States has withdrawn approximately 1.03 million barrels per day from the SPR through the week ending July 31, 2026.
Global petroleum inventories have also tightened considerably. The IEA has reported substantial draws in commercial crude and refined-product stockpiles across major consuming nations, underscoring the strain that the conflict has placed on world energy markets. Agency officials have indicated that further coordinated actions remain possible should supply disruptions persist or intensify.
The Administration continues to emphasize that the current program consists primarily of exchange agreements, rather than outright sales. Under these arrangements, companies receiving crude oil today are required to return the borrowed barrels in the future along with additional volumes as a premium. Energy Secretary Chris Wright has stated that the objective is to eventually restore the SPR to levels above those that existed prior to the current emergency releases.
We Are Watching Line 5
The Michigan Supreme Court ruled 6 to 1 on July 31 that the Michigan Public Service Commission erred when it granted a key permit for the Line 5 tunnel beneath the Straits of Mackinac, vacating the permit and sending it back to the commission. The majority found the commission conducted a review that was too narrow, failed to consider whether the tunnel would harm public trust resources, and never studied whether Line 5 would shut down if the tunnel were not built. Writing for the majority, Justice Elizabeth Welch said that to assess the environmental consequences accurately the commission should have determined whether the project would be the proximate cause of the pipeline continuing to operate.
The 58-page opinion also held that the Court of Appeals wrongly deferred to the commission on its determination under the Michigan Environmental Protection Act rather than reviewing the question independently. The project would reroute a four-mile segment of the 645-mile pipeline that currently sits exposed on the lakebed, carrying crude oil and natural gas liquids from Superior, Wisconsin to Sarnia, Ontario. The pipeline also feeds Michiganders with the energy it needs to power the state and is almost impossible to replace by rail in the current environment. The commission approved the permit in December 2023 and the Court of Appeals upheld that approval in February 2025. The practical effect is that a review process already running eight years now restarts at the commission, with no timetable attached.
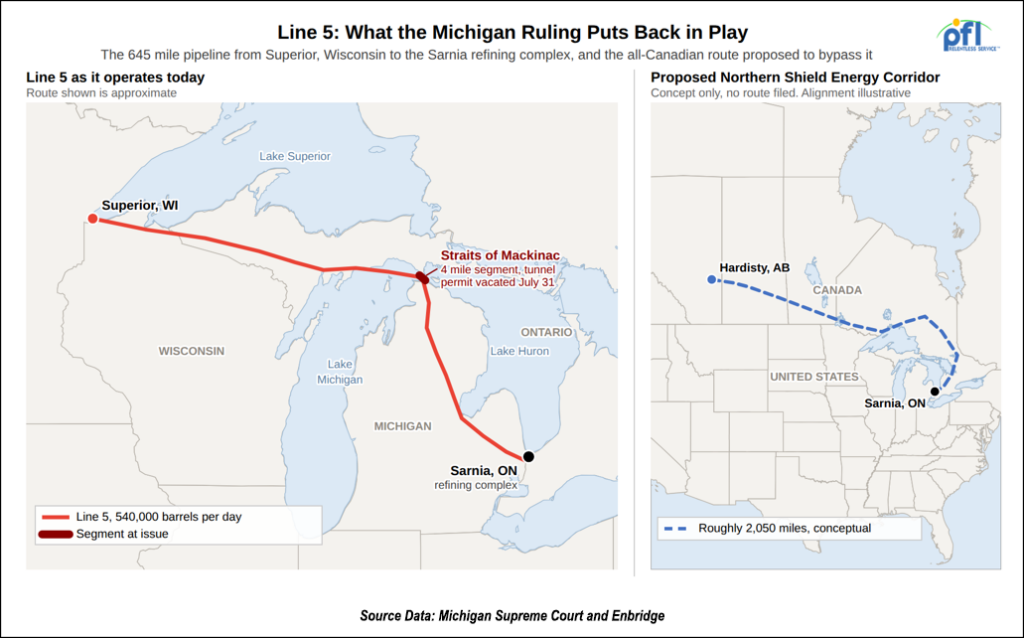
Refineries in the Sarnia complex depend on Line 5 volumes that originate in western Canada but route through the United States for both countries’ mutual benefit. For Canada, there is a Northern Shield Energy Corridor proposed pipeline that would run roughly 2,050 miles from Hardisty to Sarnia and bypass the United States entirely. That could solve Canada’s problem but is years away and won’t do anything for Michigan. The Governor of Michigan, Gretchen Whitmer, has wanted line 5 shut down for years and is seemingly getting closer to realizing her wish. At PFL, we thought this one would go away because it does not make sense. Enbridge said it was disappointed with the decision. Stay tuned to PFL, we have been watching this one for years and will continue to do so!
We Are Watching Bridger
South Bow reported second quarter results on Wednesday of last week and detailed its egress plans on Thursday. The company secured 20 year binding commitments from nine customers totaling 465,000 barrels per day of firm transportation service from Hardisty, Alberta to United States delivery points.
The route matters more than the quarter. The proposed Prairie Connector would run 330 miles from Hardisty to the Canada and United States border, built from roughly 240 miles of new 36 inch pipeline plus about 95 miles of previously installed and preserved 36 inch pipe together with two pump stations, before connecting to Bridger Pipeline facilities downstream. South Bow and Bridger are jointly developing the proposed Liberty Bridge Pipeline along a route that follows an existing corridor on privately held land. Chief executive Bevin Wirzba said achieving commercial success has moved the project into the next development phase, with a final investment decision targeted for mid 2027.
Wirzba was equally direct about the obstacle, describing permit durability as a key requirement and pointing to the stakeholder engagement, execution planning, cost refinement and financing work still ahead. South Bow expects its share of pre-decision development costs this year to run about 65 million dollars. The guidance worth holding onto, is the company’s own supply view, which is that western Canadian crude supply grows only modestly through 2026 and production remains below total pipeline egress capacity.
This project however hit a stumbling block on July 22. In a surprising decision, the Montana Department of Environmental Quality on July 22nd withdrew a waiver it had previously granted to the Bridger Pipeline Expansion, a project expected to run from Canada through Montana and Wyoming.
The waiver allowed Bridger Pipeline Expansion, LLC to omit certain financial information and baseline environmental data from its state permit application with DEQ. Bridger must receive this permit, along with federal approval, to begin construction on the 650-mile pipeline, which permit application documents say will break ground in July of 2027. Stay tuned to PFL for further details.
We Continue to Watch the Surface Transportation Board
Both sides of the Union Pacific and Norfolk Southern application moved within 48 hours of each other last week. On Thursday the Alliance for Chemical Distribution, the American Chemistry Council, the American Fuel and Petrochemical Manufacturers, The Fertilizer Institute and the National Industrial Transportation League filed a joint motion asking the Board to deny the merger application outright. CSX and BNSF filed separately the same day seeking the same relief, with BNSF telling the Board that ending the proceeding now would avoid wasteful hearings and spare the industry a protracted review of a transaction that cannot be approved on this record.
The motion turns on a narrow question rather than the merits. The coalition argues the applicants have failed to establish a prima facie case that the transaction is consistent with the public interest, which is a preliminary screen assessing only the sufficiency of the evidence submitted, viewed in the most favorable light. The Board opened that door itself in May, when it accepted the application as complete but held the proceeding in abeyance and ordered supplemental information by July 27th, noting its review might include an evaluation of whether a prima facie case had been presented. The groups argue the supplemental filings still fail to address the full range of competitive harms, propose conditions that would enhance competition, document the benefit claims, or account for the likely impact of future mergers. AFPM put it more bluntly, saying that after three attempts the applicants have not demonstrated the merger would enhance competition or serve the public interest.
The applicants are not short of support. More than 2,000 businesses, unions, farmers and community leaders have filed with the Board in favor of the transaction, and Union Pacific and Norfolk Southern continue to argue the combination removes a mid-continent handoff that adds time, cost and uncertainty for shippers. What makes this filing different is the burden itself, since this is the first major merger tested under the 2001 rules, which require applicants to show a transaction enhances competition rather than merely preserves it.
It seems to us at PFL that both camps are describing the same underlying problem, which is interchange friction, and disagreeing only about whether consolidation is the remedy. Fleet planning through 2027 should assume this review runs its full course.
We are Watching Clearing Yard
The Surface Transportation Board wrote to the Belt Railway Company of Chicago on August 3 and copied the presidents and chief executives of all six Class I railroads. Average railcar inventory at Clearing Yard reached 5,048 cars in week 30, up 57% from 3,212 cars in the same week of 2025, while average dwell rose 72% from 18 hours to 31 hours. Measured from the beginning of April, average weekly inventory is up 26% from 4,012 cars and average yard dwell is up 63% from 19 hours.
The Board called the simultaneous increase in car inventory and dwell concern and said it could indicate growing congestion in the larger Chicago complex and the region, warning that severe and persistent congestion around Chicago can impair regional fluidity with ripple effects reaching across the network. The Belt Railway must explain the trends, set out how it will work with the Class I carriers to return service to normal, and file weekly reports covering dwell, inventory, cars humped, cars rehumped, cars received, cars departed and on-time departure percentage until both dwell and inventory have normalized on a sustained basis to 2025 levels.
Clearing Yard covers 786 acres across 5.5 miles, supports more than 250 miles of track, and dispatches more than 8,400 cars a day, which makes it the busiest classification facility in Chicago. Independent analyst Rick Paterson flagged the trend a day before the Board did, noting in his State of the Rails Report that the railroad triggers a yellow alert at 4,800 average daily cars and a red alert at 5,100, leaving it between the two, and that inventory has topped 5,000 for the first time in data going back to 2017. The increase coincides with CSX reducing use of its Barr Yard in April in favor of Clearing and, to a lesser extent, the Indiana Harbor Belt, although the Board letter did not attribute the deterioration to that change.
There is a second reading worth noting. Union Pacific and Norfolk Southern have built much of their merger case on the proposition that mid-continent interchange is the structural bottleneck in the network, and the Board has now opened a separate inquiry into exactly that gateway. Whichever way the congestion question resolves, the data series that begins today will be quoted back into the merger docket.
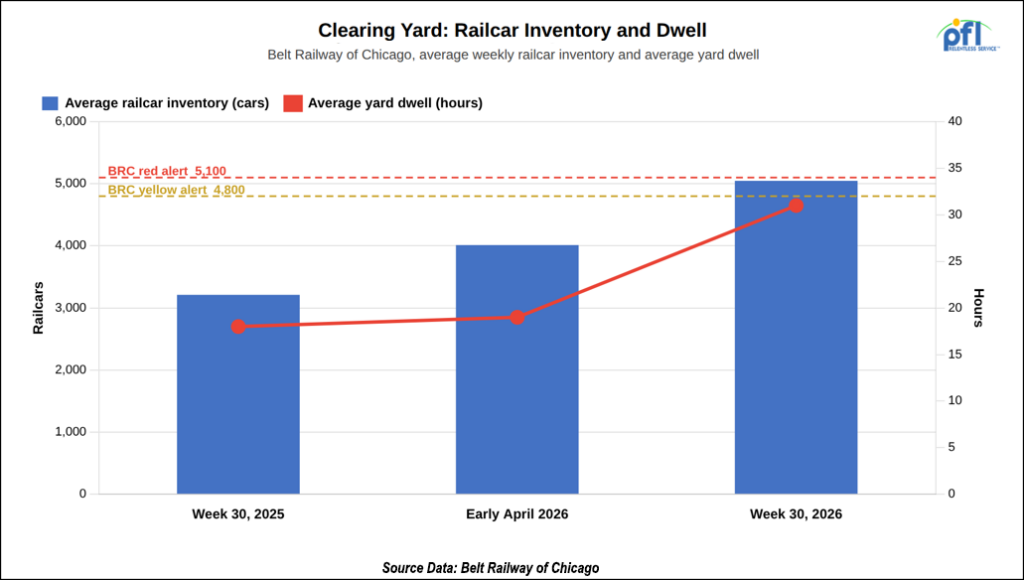
PFL advises clients with cars routing through Chicago to revisit cycle time assumptions now rather than at renewal. Thirteen additional hours of dwell at a single classification yard is capacity removed from a fleet.
We Are Watching the Federal Railroad Administration
The Federal Railroad Administration published a notice of proposed rulemaking on July 31 under Docket FRA-2026-2014, opening a 60 day comment period. The rule would establish English language proficiency as a requirement for a railroad to certify and recertify locomotive engineers and conductors, and would mandate that all training and testing for certification be conducted in English. The agency says proficiency is essential because railroad rules, practices and communications in the United States all take place in English.
The border provisions are the sharper end of the proposal. Crews based in Mexico would be limited to operating no more than 10 route miles into the United States, and the United States railroad running the train would have to train, test and certify those crews directly, rather than rely on Mexican certification. The agency has determined that the proficiency requirement alone is not sufficient at the southern border. Canadian crews would need English proficiency but face no distance limit, because the agency finds United States and Canadian standards already align.
The proposal follows December 2025 inspections of cross-border operations on Union Pacific and Canadian Pacific Kansas City, where inspectors observed inbound crew members having difficulty interpreting general track bulletins and communicating safety requirements in English. Two further provisions matter to operations. Skill testing and observation of engineers would have to be conducted without cruise-control type systems that reduce the need to work the throttle or brakes, and territorial qualification would be narrowed to the specific direction traveled during qualification. Both major operating unions endorsed the proposal, while CPKC and the Association of American Railroads declined to comment while they study it, and Union Pacific said only that it shares the goal of safe operations that keep the supply chain fluid.
We Are Watching the Truck Market
Three readings landed on August 4 and they all point the same direction. The Logistics Managers Index put transportation capacity at 28.4 in July, a decline of 2.4 points from June that ties the second fastest contraction in the roughly ten year history of the index and returns the measure to its lowest level in six years. Capacity has now contracted for eight consecutive months. Transportation utilization read 65 and transportation prices 86.9, both down from June but still firmly expansionary, and the overall index came in at 68.9 against June 71.1.
The United States Bank Freight Payment Index told the same story from the shipper side. National shipment volumes fell 1.1% from the first quarter and 2.8% from a year earlier, while spending rose 6.4% sequentially and 28.1% year over year. DAT reported second quarter spot rates averaging $3.02 per mile against contract rates of $3.06, a gap of four cents where it stood at .39 cents a year earlier. Fuel was not the driver, and the national average diesel price came off an April peak above $5.64 per gallon to $4.67 late in the quarter.
Bob Costello of the American Trucking Associations attributed the move to capacity tightening after several years of excess supply rather than to demand recovery, noting that rates are rising even though the freight market remains relatively soft. The report also credits enforcement, citing English language proficiency requirements, revocations of non-domiciled commercial driver licenses, oversight of driver training schools and a crackdown on cabotage by Mexican B-1 visa holders as factors reducing available capacity. Spot leads contract into the next bid cycle, which means the harder market for truck shippers is still in front of them rather than behind them.
We are watching the Black Sea
Global grain markets faced renewed uncertainty last week as intensified attacks on Ukraine’s Black Sea port infrastructure disrupted one of the world’s major agricultural export routes. Last week, Ukrainian officials reported that the country was working to redirect additional grain exports through rail, road, and Danube River routes as pressure on its seaports continued.
The potential impact is significant. Ukrainian officials estimate that alternative transportation routes can currently accommodate only about 50–55% of the volumes normally handled through the affected Black Sea ports. If the disruption is not resolved, just over 30 million metric tons of grain and oilseeds could fail to reach international markets.
Ukraine remains an important supplier to global agricultural markets, particularly for wheat, corn, and oilseeds. Any prolonged reduction in its export capacity could alter global commodity flows as international buyers look to other producing regions to meet demand.
That makes the situation particularly relevant for Canada and the United States as the 2026 harvest season approaches. Both countries are major agricultural exporters with extensive rail networks connecting producing regions with domestic and export markets. Canada is also entering the season with a strong export outlook, with current forecasts calling for approximately 50.5 million tonnes of grain and oilseed exports in the 2026–27 crop year.
For the rail industry, the question is whether disruption overseas ultimately translates into additional North American export demand. If purchasing patterns shift toward U.S. or Canadian suppliers, higher volumes could affect grain elevator activity, covered-hopper utilization, railcar availability, and the inspections, maintenance, cleaning, storage, and field support required to keep equipment moving efficiently.
PFL is watching how conditions in the Black Sea develop and whether global grain purchasing patterns begin to shift in response. It is still too early to determine the impact on North American volumes, but with harvest approaching and more than 30 million metric tons of Ukrainian grain and oilseeds potentially at risk of reaching global markets, the situation could become increasingly important for agricultural shippers and the rail industry in the weeks ahead.
We Are Watching Key Economic Indicators
Purchasing Managers Index (PMI)
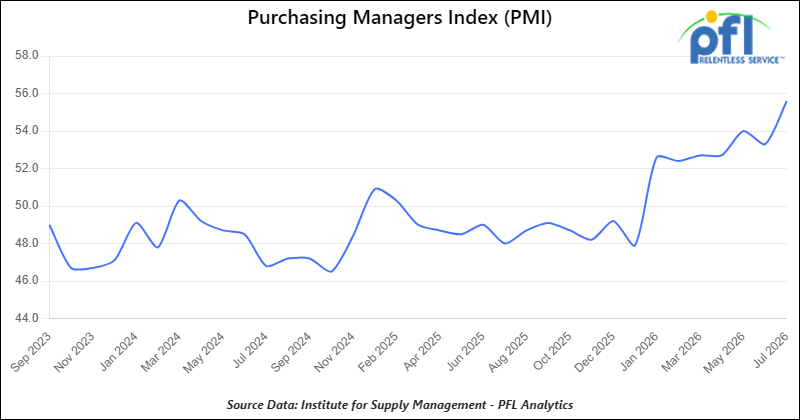
The Institute for Supply Management (ISM) releases two PMI reports each month—one covering manufacturing and the other covering services. These reports are based on surveys of supply managers across the country and measure changes in business activity. A reading above 50% indicates expansion, while a reading below 50% signals contraction, with the pace of change increasing as the index moves farther from 50.
The Manufacturing PMI registered 55.6% in July 2026, up from 53.3% in June and marking the seventh consecutive month of expansion. The reading was the strongest since May 2022, reflecting broad-based gains in production, new orders, and factory activity. While manufacturing momentum strengthened significantly, survey respondents continued to cite higher input costs and tariff-related price pressures as ongoing challenges.
The Services PMI registered 53.1% in July 2026, down from 54.0% in June, but remained firmly in expansion territory for the 25th consecutive month. Business activity and new orders continued to grow, though at a slower pace than in June, reflecting continued resilience in the service sector despite moderating growth. Employment remained in expansion, while easing price pressures suggested some improvement in operating cost inflation. Overall, the report indicates that the U.S. services sector continues to expand.
U.S. Unemployment
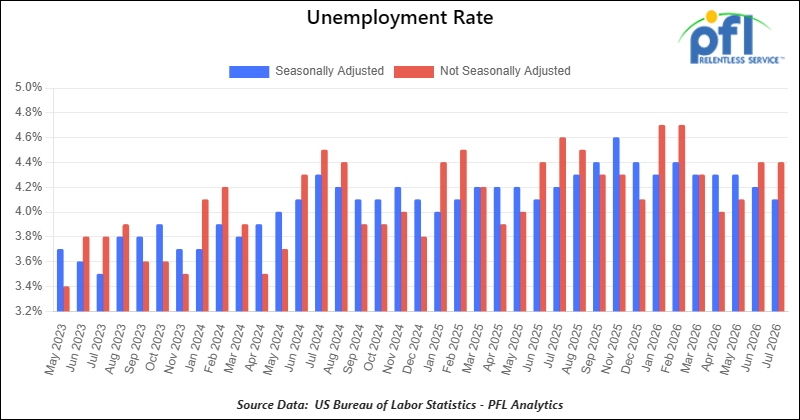
On August 7th, the U.S. Bureau of Labor Statistics (BLS) reported that the U.S. economy lost a preliminary 23,000 net nonfarm payroll jobs in July 2026, marking the first monthly decline in employment since February and falling short of market expectations. The BLS also revised employment figures for the prior two months downward, subtracting a combined 103,000 jobs from May and June totals. May was revised down to 63,000 new jobs, while June was revised down to 20,000.
According to the BLS, total nonfarm payroll employment has increased by approximately 60,000 jobs over the last three months (May through July 2026). The official unemployment rate edged down to 4.1% in July from 4.2% in June, although the decline was largely attributable to a drop in labor force participation rather than stronger hiring, suggesting labor market conditions weakened during the month. The good news is that government jobs continue to decline while manufacturing and private sector jobs continue to increase.
Lease Bids
- 20-50, 4000-5000 Covered Hoppers located off of UP or BNSF in Houston. For use in Urea, Potash, and Ammonium Sulfate service. Period: 6-12 Months.
- 30-50, 25.5K DOT 111 Tanks located off of All Class 1s in various locations. For use in Asphalt service. Period: 1-3 Years.
- 40, 29K DOT 111 Tanks located off of UP or BNSF in the Midwest. For use in Veg Oil service. Period: 5 Year.
- 20, DOT 117J Tanks located off of NS, CSX, CN, or CPKC in various locations. For use in C5 service. Period: 1 year. Need gauge rods.
- 300, 5200CF Covered Hoppers located off of CP or CM in Canada. For use in Petcoke service. Period: 3 Year.
- 10, 30K 117J Tanks located off of BNSF in Canada. For use in Propane or Butane service. Period: 3 Year.
- 20, 28K or larger 117J Tanks located off of BNSF or UP in California. For use in Crude service. Period: 6 months.
- 75, 30K 117 Tanks located off of NS in Ohio. For use in Condensate service. Period: 6-12 Months. Mag Rods Not Needed.
- 100, 28.3K DOT 111 or 117 Tanks located off of CP or CN in Canada. For use in VGO service. Period: 1-3 Years.
- 5, 28.3K DOT 111 or 117 Tanks located off of CN in Canada. For use in Bitumen service. Period: Trip Lease.
- 5-10, 25.5K DOT 111 Tanks located off of CN in Canada. For use in Caustic service. Period: 3-6 Months.
- 100, 340W Pressure Tank located off of CN or CP in Canada. For use in Propane service. Period: 6 Months.
- 10-20, 3200 or 3281 Covered Hoppercars located off of CN or CP in Canada. For use in Sodium Sulphate service. Period: 3-5 years. Lined.
- 50, 340W Pressure Tank located off of CN or CP in Canada. For use in Propane service. Period: Winter.
- 30-50, 340W pressure Tank located off of NS or CSX in Northeast U.S. For use in Propane service. Period: Winter.
- 25, 340W Pressure Tank located off of UP or BN in US. For use in Propane service. Period: Winter.
- 50, 28.3K 117J Tank located off of BNSF in Kansas/Oklahoma. For use in Fuel Oil service. Period: 6 Months.
- 100, 28.3K 117J Tank located off of CN in Canada. For use in Diesel service. Period: 1 year.
Sales Bids
- 28, 3400CF Covered Hoppers located off of UP or BNSF in Texas. For use in Cement service. Cement Gates needed.
- 20, 17K DOT111 Tanks located off of various class 1s in various locations. For use in corn syrup service.
- 120, Various Open-Top Aluminum Rotary Gondolas located off of various class 1s in various locations. For use in Sulphur service. Built 2004 or later.
- 12, 21.5K-25K DOT 111 Tanks located off of Various Class 1s in Michigan. For use in Diesel, Asphalt, Crude service. Coiled and Insulated.
Lease Offers
- 21, 6351 Covered Hoppers located off of CN in Wisconsin. Last used in DDG. Available until February 2027.
- 29, 6500 Covered Hoppers located off of CN in Wisconsin. Last used in DDG. Available until February 2027.
- 29, 25.5K DOT117J Tanks located off of UP or BNSF in Texas. Cars are currently clean.
- 200, 340W DOT 112J Tanks located off of all class 1s in Multiple Locations. Last used in propane and butane. Cars are currently clean.
- 15, 6200CF Covered Hoppers located off of all class 1s in Wisconsin. Last used in plastic. Cars are currently clean.
- 30, 6500CF Covered Hoppers located off of all class 1s in Wisconsin. Last used in plastic. Cars are currently clean.
- 6, 21K Stainless Steel Tanks located off of UP in Texas / Mexico Border. Last used in surfactant. Cars are currently clean.
- 100, 28.4K DOT 117J Tanks located off of UP or BNSF in Beaumont, TX. Cars are currently clean.
- 50, 30K DOT117J Tanks located off of UP or BNSF in the South. Last used in ethanol.
- 30, 30K DOT 117R Tanks located off of BNSF in Washington. Last used in renewable jet fuel.
- 80, 30K DOT 117R Tanks located off of BNSF in Washington. Last used in renewable diesel.
- 10, 30K DOT 117R Tanks located off of BNSF in Washington. Last used in renewable naphtha.
- 10, 29K DOT 117R Tanks located off of BNSF and UP in Texas. Last used in gasoline additive. Coiled and Insulated.
- 39, 31K CPC1232 Tanks located off of All Class 1s in Iowa. Last used in diesel.
- 2, 30K DOT 117R Tanks located off of BNSF and UP in Texas. Last used in Diesel.
- 1, 30K DOT 117R Tanks located off of BNSF and UP in Texas. Last used in gas blend stock.
- 3, 30K DOT 117R Tanks located off of BNSF and UP in Texas. Last used in gasoline.
- 41, 30K DOT 111 Tanks located off of in Brownsville. Last used in Diesel. Cars are currently clean.
Sales Offers
- 81, 31.8K CPC1232 Tanks located off of UP or BNSF in TX. Last used in Multiple Services. Requal Due in 2025.
- 35, 3400CF Covered Hoppers located off of UP or BNSF in the Midwest. Last used in Sand.
- 25, 30K 117J Tanks located off of CSX in Jackson, TN. Last used in Fuels. Newly Requalified.
Call PFL today to discuss your needs and our availability and market reach. Whether you are looking to lease cars, lease out cars, buy cars, or sell cars call PFL today at 239-390-2885
Railcar for Sale or Lease
| CAT | Type | Capacity | GRL | QTY | LOC | Class | Prev. Use | Offer | Note |
|---|
| CAT | Type | Size | GRL | QTY | LOC | Class | Term | Commodity | Offer | Note |
|---|
| CAT | Type | Capacity | GRL | QTY | LOC | Class | Prev. Use | Clean | Offer | Note |
|---|
| CAT | Type | Capacity | GRL | QTY | LOC | Class | Commodity | Offer | Note |
|---|
PFL will be at the Following Conferences

- Where: The Westin Galleria Dallas
- Attending: David Cohen (954-729-4774), and Curtis Chandler (239-405-3365)
- Conference Website

- Where: The Westin Galleria Dallas
- Attending: Brian Baker (239.297.4519)
- Conference Website