
“Our doubts are traitors and make us lose the good we oft might win by fearing to attempt.” -William Shakespeare
Jobs Update
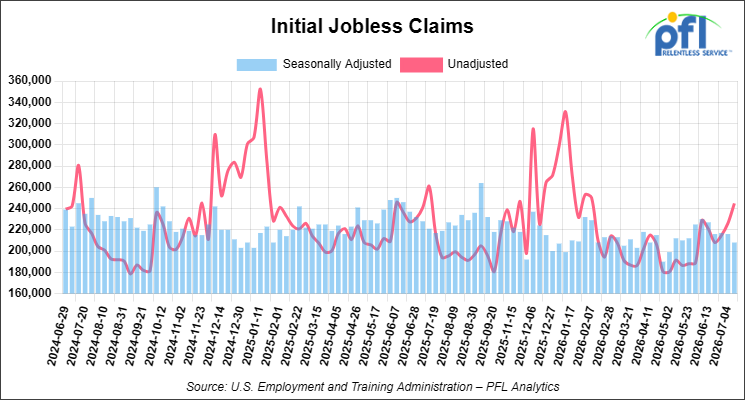
Initial jobless claims seasonally adjusted for the week ending July 11, 2026 came in at 208,000, versus the adjusted number of 216,000 people from the week prior, down 8,000 people week over week.
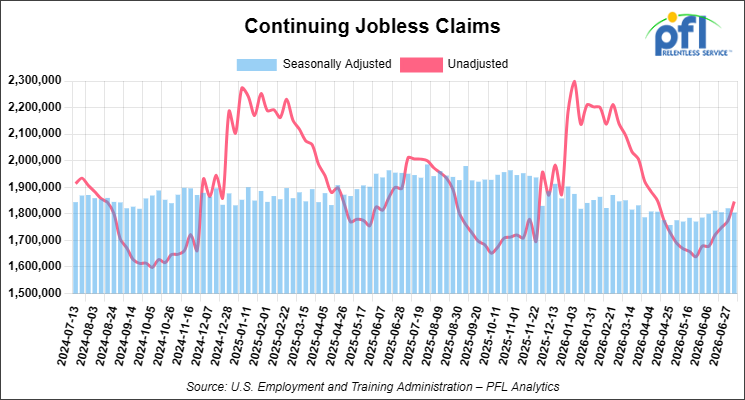
Continuing jobless claims came in at 1,805,000, versus the adjusted number of 1,821,000 people from the week prior, down 16,000 week-over-week.
Stocks closed lower on Friday of last week and lower week-over-week
The DOW closed lower on Friday of last week, down -406.76 points (-0.77%), closing out the week at 52,146.21, down -490.88 points week-over-week. The S&P 500 closed lower on Friday of last week, down -76.08 points (-1.01%), and closed out the week at 7,457.69, down -117.57 points week-over-week. The NASDAQ closed lower on Friday of last week, down -361.70 points (-1.40%), and closed out the week at 25,520.24, down -761.37 points week-over-week.
In overnight trading, DOW futures traded higher and are expected to open at 52,512 this morning, up 137 points from Friday’s close.
Crude oil closed higher on Friday of last week and higher week-over-week
West Texas Intermediate (WTI) crude closed up $3.54 per barrel (4.59%), to close at $82.49 on Friday of last week, and up $11.08 per barrel week-over-week. Brent crude closed up $3.87 per barrel (4.48%), to close at $88.10, and up $12.09 per barrel week-over-week.
One Exchange WCS (Western Canadian Select) for August delivery settled on Friday of last week at US$13.15 below the WTI-CMA (West Texas Intermediate – Calendar Month Average). The implied value was US$69.34 per barrel.
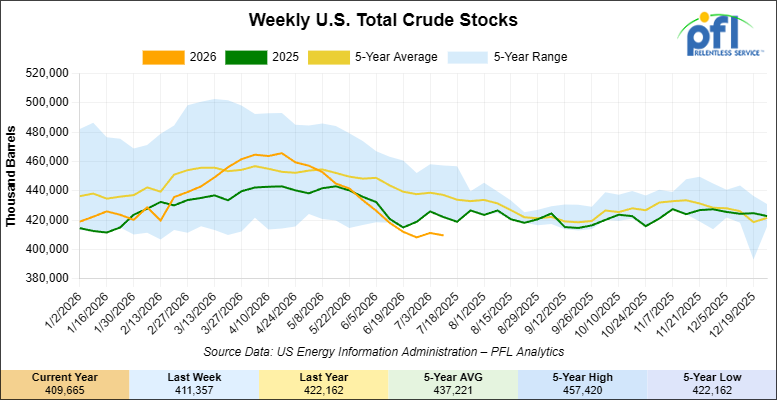
U.S. commercial crude oil inventories (excluding those in the Strategic Petroleum Reserve) decreased by 1.7 million barrels week-over-week. At 409.7 million barrels, U.S. crude oil inventories are 6% below the five-year average for this time of year.
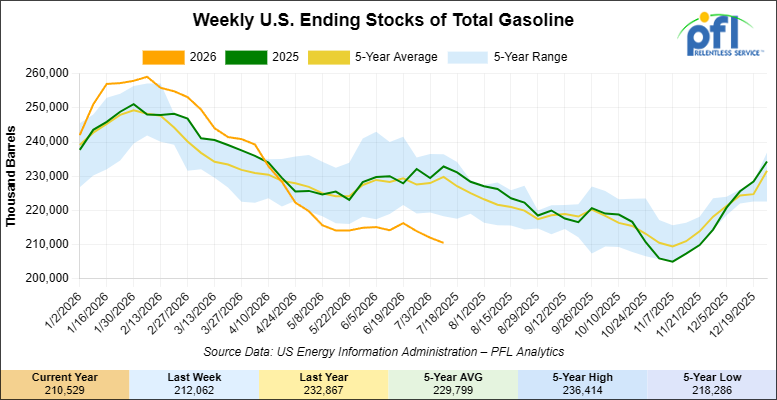
Total motor gasoline inventories decreased by 1.5 million barrels week-over-week and are 8% below the five-year average for this time of year.
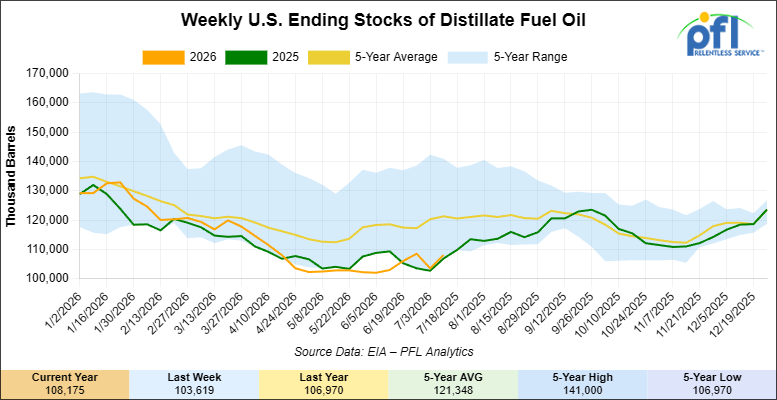
Distillate fuel inventories increased by 4.6 million barrels week-over-week and are 11% below the five-year average for this time of year.
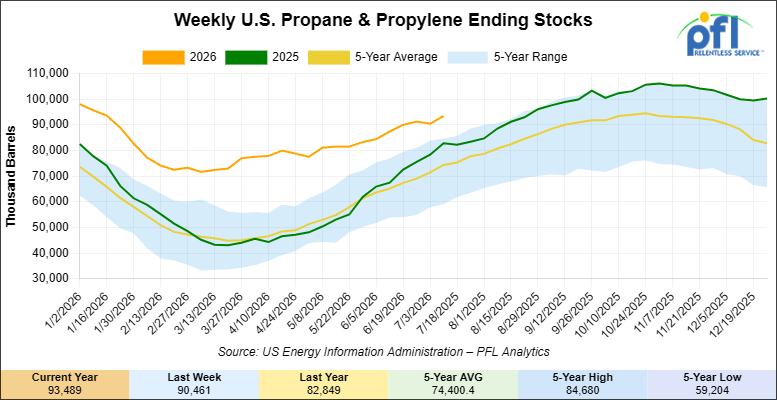
Propane/propylene inventories increased by 3 million barrels week-over-week and are 28% above the five-year average for this time of year.
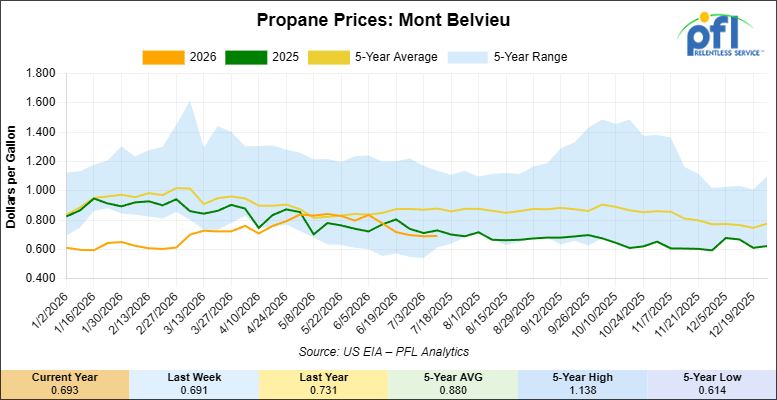
Propane prices closed at 69.3 cents per gallon on Friday of last week, up 0.2 cents per gallon week-over-week, but down 3.8 cents year-over-year.
Overall, total commercial petroleum inventories increased by 13.3 million barrels week-over-week during the week ending July 10, 2026.
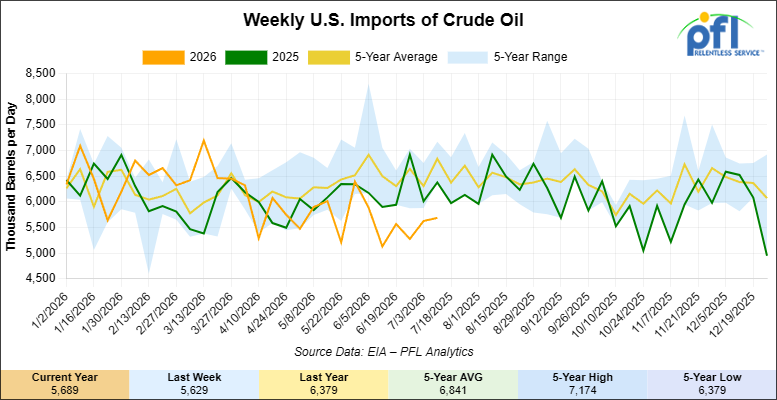
U.S. crude oil imports averaged 5.7 million barrels per day during the week ending July 10, 2026, an increase of 60,000 barrels per day week-over-week. Over the past four weeks, crude oil imports averaged 5.5 million barrels per day, 12.2% less than the same four-week period last year. Total motor gasoline imports (including both finished gasoline and gasoline blending components) averaged 354,000 barrels per day, and distillate fuel imports averaged 93,000 barrels per day during the week ending July 10, 2026.
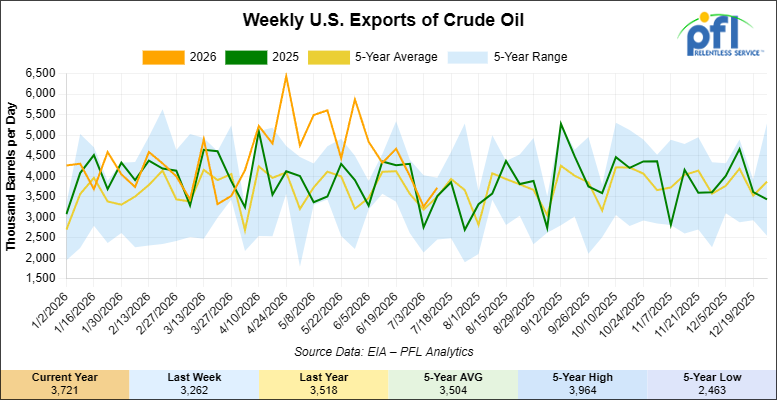
U.S. crude oil exports averaged 3.721 million barrels per day during the week ending July 10, 2026, an increase of 459,000 barrels per day week-over-week. Over the past four weeks, crude oil exports averaged 3.915 million barrels per day.
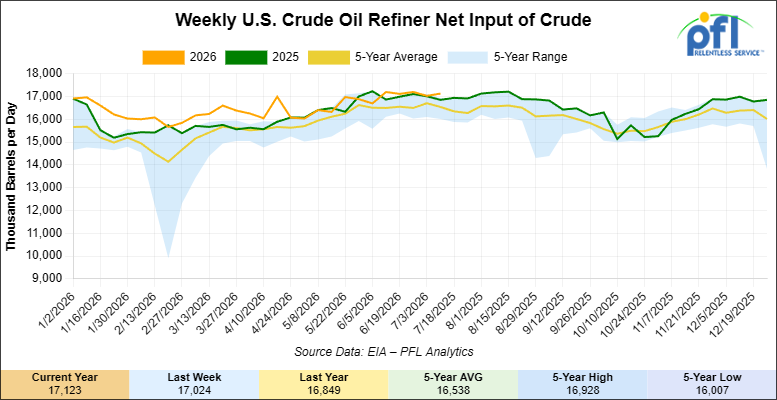
U.S. crude oil refinery inputs averaged 17.1 million barrels per day during the week ending July 10, 2026, which was 99,000 barrels per day more week-over-week.
WTI is poised to open at $81.34, down 44 cents per barrel from Friday’s close.
North American Rail Traffic
Week Ending July 15, 2026:
Total North American weekly rail volumes were up (+2.89%) in week 29, compared with the same week last year. Total Carloads for the week ending July 15, 2026 were 323,225, up (+1.83%) compared with the same week in 2025, while weekly Intermodal volume was 338,299, up (+3.93%) year over year. 8 of the AAR’s 11 major traffic categories posted year-over-year increases. The largest decrease came from Coal (-7.11%). The largest increase was Petroleum & Petroleum Products (+8.72%).
In the East, CSX’s total volumes were up (+2.38%), with the largest decrease coming from Coal (-13.46%), while the largest increase came from Other (+15.83%). NS’s total volumes were up (+3.16%), with the largest increase coming from Petroleum & Petroleum Products (+15.68%), while the largest decrease came from Grain (-13.94%).
In the West, BNSF’s total volumes were up (+5.07%), with the largest increase coming from Metallic Ores and Metals (+15.63%), while the largest decrease came from Grain (-6.17%). UP’s total volumes were up (+1.66%), with the largest increase coming from Metallic Ores and Metals (+24.36%), while the largest decrease came from Coal (-17.53%).
In Canada, CN’s total volumes were down (-1.23%), with the largest increase coming from Petroleum & Petroleum Products (+30.18%), while the largest decrease came from Intermodal Units (-14.32%). CPKCS’s total volumes were up (+4.84%), with the largest increase coming from Metallic Ores and Metals (+37.24%), while the largest decrease came from Chemicals (-17.51%).
Source Data: AAR – PFL Analytics
North American Rig Count Summary
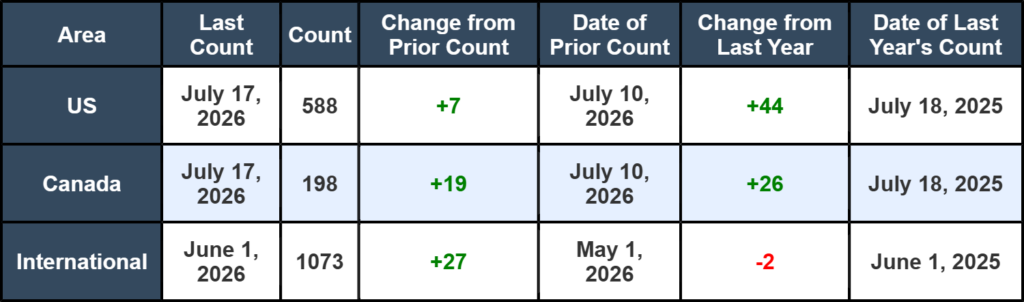
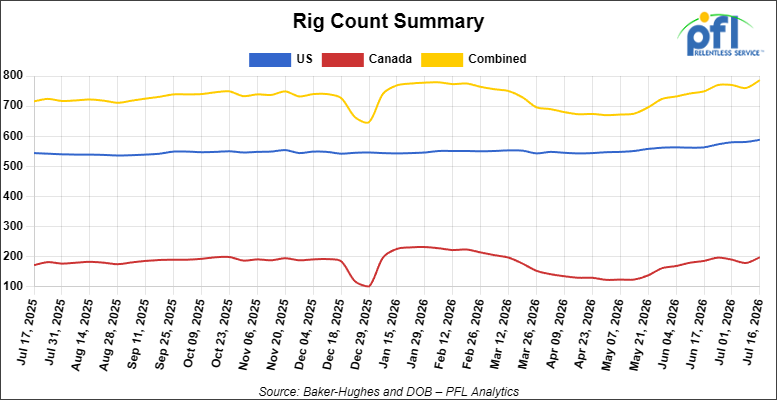
North American rig count was up by +26 rigs week-over-week. The U.S. rig count was up by +7 rigs week-over-week, and up by +44 rigs year-over-year. The US currently has 588 active rigs. Canada’s rig count was up by +19 rigs week-over-week and up by +26 rigs year-over-year. Canada currently has 198 active rigs. Overall, year-over-year we are up by +70 rigs collectively.
We are watching a few things out there for you:
PFL Attended MARS Summer Meeting in Lake Geneva, WI
The 2026 MARS Summer Meeting once again showed why it continues to be a staple of the rail industry. The conference drew a huge turnout, and every networking event was well attended, especially the annual scholarship golf outing, where plenty of good conversations took place. Much of the discussion centered around the future of the DOT-117 fleet and upcoming regulatory requirements, as well as the remaining DOT-111 cars that still need to be qualified but cannot remain in hazardous service after 2029. The general consensus was that many owners are choosing to scrap those DOT-111 cars, as there are limited opportunities to repurpose them into other services. Between the informative sessions and the networking throughout the event, this year’s MARS meeting once again proved to be one of the industry’s most important annual gatherings.
We Are Watching Petroleum Carloads
The four-week rolling average of petroleum carloads carried on the six largest North American railroads rose to 29,839 from 29,746 which was an increase of +93 rail cars week-over-week. Canadian volumes were mixed. CN’s shipments were lower by -4.0% week-over-week, CPKC’s volumes were higher by +1.0% week-over-week. U.S. shipments were also mixed. The NS had the largest percentage decrease and was down by -11.0% week-over-week. The BNSF had the largest percentage increase and was up by +5% week over week.
We Continue to Watch Our Strategic Petroleum Reserves
The ongoing emergency drawdown of the U.S. Strategic Petroleum Reserve (SPR) remains a major component of global efforts to offset crude oil supply disruptions stemming from the conflict involving Iran and the continued restrictions on oil shipments through the Strait of Hormuz. Since March, the Department of Energy (DOE) has awarded exchanges covering more than 133 million barrels of crude oil, with additional releases expected as part of a broader international response coordinated through the International Energy Agency (IEA).
The United States continues to execute its commitment to make available up to 172 million barrels from the SPR under the IEA’s collective plan to inject roughly 400 million barrels into global energy markets. Officials have argued that the releases are necessary to help stabilize crude supplies and limit further increases in fuel prices as refiners compete for replacement barrels amid ongoing transportation disruptions.
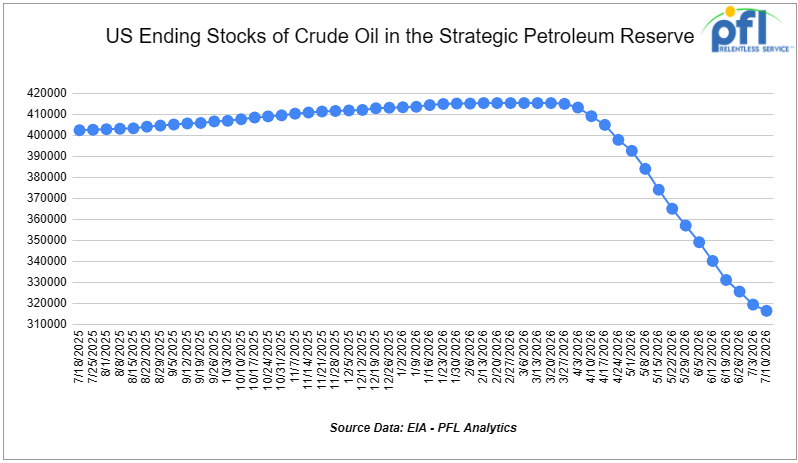
As releases have accelerated, inventories in the SPR have declined to 316.489 million barrels, down from 415.442 million barrels at the start of the conflict with Iran and reaching their lowest level since April 1983. Recent weekly withdrawals have ranked among the largest on record, highlighting the scale of the government’s intervention in oil markets. Since the first SPR drawdown began, the United States has withdrawn approximately 989,000 barrels per day from the SPR through the week ending July 10, 2026.
Global petroleum inventories have also tightened considerably. The IEA has reported substantial draws in commercial crude and refined-product stockpiles across major consuming nations, underscoring the strain that the conflict has placed on world energy markets. Agency officials have indicated that further coordinated actions remain possible should supply disruptions persist or intensify.
The Administration continues to emphasize that the current program consists primarily of exchange agreements, rather than outright sales. Under these arrangements, companies receiving crude oil today are required to return the borrowed barrels in the future along with additional volumes as a premium. Energy Secretary Chris Wright has stated that the objective is to eventually restore the SPR to levels above those that existed prior to the current emergency releases.
We Continue to Watch Hormuz
The June ceasefire is dead. President Trump declared the Iran deal over at last week’s NATO summit, and U.S. forces ran a second round of strikes after Iran fired on commercial vessels and again declared the strait closed. Tanker traffic through Hormuz has collapsed to a fraction of normal, shutting the waterway for the second time this year and choking off roughly a fifth of the world’s seaborne oil. Crude climbed on the escalation, with WTI back into the low $80s.
The war keeps a firm bid under North American crude and pulls barrels toward both coasts, with Asian import flows to the U.S. west coast disrupted and Canadian heavy finding firmer Pacific-basin bids as a Mideast substitute. No one is adding tank cars to chase a geopolitical spike, so what matters this cycle is whether the cars and commitments already in place are working, and right now most are. The Jones Act tanker waiver first issued in March has been extended again into the summer to keep Bakken barrels moving from the Gulf to eastern refineries.
We Continue to Watch Enbridge
Michigan issued the last major state permits for Enbridge’s Line 5 tunnel last Wednesday, with the Department of Environment, Great Lakes and Energy reissuing the wetlands and bottomlands permits and the Department of Natural Resources granting its rare-species permit. The approvals clear the state track for the four-mile tunnel under the Straits of Mackinac that would house the 540,000 barrel per day crude and NGL line, after roughly eight years of litigation and a 16-month review. Governor Gretchen Whitmer, who campaigned in 2018 on shutting the line down, drew the opponents’ fire directly, and Attorney General Dana Nessel’s shutdown effort continues alongside promised new lawsuits.
Two approvals still stand between Enbridge and construction: a water discharge permit EGLE expects to rule on by September 30, and the U.S. Army Corps of Engineers, which narrowed and sped up its review last year. The tunnel will cost $500 million and would take two years to build, which keeps the existing dual pipelines in service through the back half of the decade regardless of how the shutdown fight resolves. Line 5 feeds Sarnia and the Ontario refineries, and the shutdown risk has been the standing bull case for eastern Canadian rail demand for years. PFL has been watching this one for years and doubts the pipeline will ever be forced to be shut down.
We Are Watching CARB
The House Energy and Commerce environment subcommittee advanced the LOCOMOTIVES Act on Tuesday of last week, forwarding it to the full committee by voice vote. The Bill would pre-empt states from writing their own locomotive emissions standards, aimed squarely at the California Air Resources Board and its rule to force zero-emission locomotives onto the state’s rails by 2030. Sponsor Buddy Carter of Georgia framed CARB’s approach as a mandate that would ban much of the national fleet from operating in California and raise consumer prices without cleaner air.
CARB withdrew its EPA authorization request for the In-Use Locomotive rule in January 2025, but the industry wants the loophole shut by statute rather than left to the next administration. The Association of American Railroads has argued the rule would have forced early retirement of much of the national fleet and leaned on zero-emission locomotives that are not yet commercially viable. A companion Senate effort and related bills are moving on a parallel track. This is the rare regulatory fight where the fleet math and the politics point the same direction.
We Are Watching Trucking
The U.S. truckload spot market crossed a line in June it had not seen since February 2022, with the national average dry van spot rate moving above the contract rate. Rates climbed faster than volumes through the month, the signature of tightening capacity rather than a demand surge, and spot pricing pushed past the COVID-era peak. FMCSA enforcement has pulled tens of thousands of drivers out of service, small carriers keep exiting, and the Cass Truckload Linehaul Index ran 6.9% above a year ago in May.
As truckload rates and route-guide failures climb, intermodal is regaining some market share, with brokers flagging renewed shipper interest in moving freight back onto rail. Contract rates lag spot by roughly six months, so the cost pressure builds into 2027. For fleet operators, a tightening truck market is the tailwind that turns idle capacity into utilized capacity. PFL works with shippers positioning cars ahead of that shift, rather than scrambling after it.
We Are Watching Pueblo
Union Pacific took delivery of the first stick of rail from Rocky Mountain Steel’s new $1.2 billion long-rail mill in Pueblo, Colorado last Thursday, with CEO Jim Vena on site to mark the start of operations. The plant is the only dedicated steel rail mill left in the United States, rolling 328-foot sections that need about 80% fewer welds than standard 80-foot rail, running on electric arc furnaces powered by an 1,800-acre solar farm.
The mill anchors a seven-year contract signed in April under which Union Pacific buys the majority of its rail from the Colorado steelmaker, now under Orion Steel ownership. The deal ended UP’s Nebraska lawsuit over rail pricing, though BNSF’s dispute with the mill is still pending. Union Pacific tied the reopening directly to its pending Norfolk Southern merger, framing domestic rail supply as part of the case for the first transcontinental railroad.
Longer rail means fewer welds, fewer defects, and a network built to run heavier for longer. PFL helps shippers and fleet operators keep pace with that buildout through storage, inspections, repairs, cleaning, and transloading, the unglamorous work that keeps cars in service while the majors pour billions into track.
We Continue to Watch Left Wing Carney
The Pathways carbon capture agreement we flagged last week as the missing piece is now signed. Ottawa, Alberta, and the five-company Oil Sands Alliance made the memorandum public last Monday, clearing the condition Carney and Premier Danielle Smith attached to the West Coast oil pipeline they unveiled in Calgary on July 2. Ottawa commits to extend carbon capture investment tax credits to 2035, and Alberta to bankroll incentives that spur the oil production growth needed to fill the new line.
Pathways would capture about six million tonnes of CO2 a year once its first phase reaches service on January 1, 2032, with the full build three years later. Set against the roughly 92 million tonnes the oil sands emitted in 2024, the project offsets about 7% of current output while the pipeline it unlocks is engineered to drive production higher. The price tag has already climbed from an initial $16.5 billion to a range of $20 billion to $30 billion.
The West Coast line itself is a Crown project, led by Trans Mountain Corporation with Pembina the lone private investor, on the same taxpayer-funded model as the $34 billion Trans Mountain expansion. Binding agreements with each producer are due by November 15. It is Canadian taxpayers underwriting both the pipe and the capture hub. In our opinion, this is not a market building pipelines. It is a government buying them, then calling a 7% offset a climate plan. Our message to Prime Minister Carney – put out the wildfires in Canada! Enact proper forest management measures. That would be the first step for saving the planet from climate change. The active wildfires in Canada release vast quantities of pollution each day, with daily emissions shifting based on weather and how fast the blazes spread. While overall total volume fluctuates, researchers tracking individual peak fire days have measured daily carbon dioxide emissions hitting as high as 1.7 million megatons (1.73 million metric tonnes per-day) during extreme flare-ups.
We Are Watching 45Z
The regulatory fog around clean fuel policy thinned a little earlier this month. The White House budget office’s 2026 Unified Agenda, released July 3rd, lists final 45Z Clean Fuel Production Credit rules targeted for November, the first firm timeline producers have had since proposed rules landed in February. The credit runs through 2029 and covers ethanol, biodiesel, renewable diesel, renewable natural gas, and sustainable aviation fuel, all of which move by rail in volume.
The bigger structural shift is on feedstock. Fuel produced after 2025 must use feedstocks grown in the United States, and USDA’s finalized Regenerative Feedstock Rule, effective July 29, sets the framework for corn, soybean, sorghum, and spring canola grown under qualifying practices to earn lower carbon scores. A domestic-only feedstock rule redraws where the grain and oil originate, pulling more volume onto North American rail and away from imported inputs. Until Treasury finalizes in November, the ethanol and renewable diesel plants sizing 2027 volumes are working off a proposed rule, and that limbo is exactly what freezes committed rail bookings.
We are Watching Key Economic Indicators
Producer Price Index
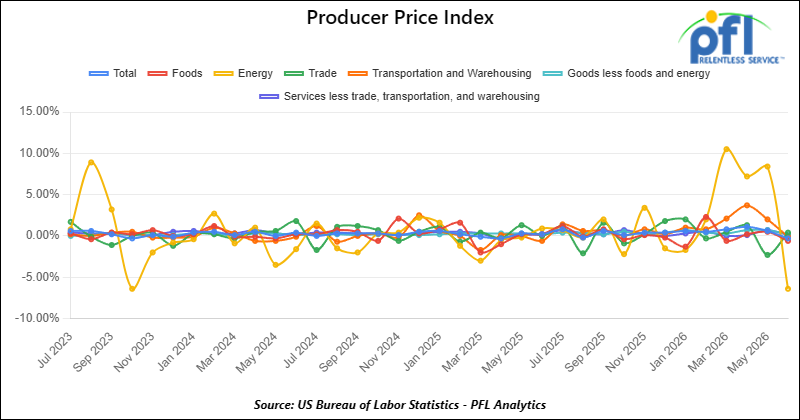
In June 2026, the Producer Price Index (PPI) for final demand declined 0.3% month-over-month, following a 1.1% increase in May, reflecting a sharp easing in upstream price pressures as energy prices retreated. Core PPI (final demand less foods and energy) increased 0.2% month over month, indicating underlying inflation remained relatively stable despite the decline in headline producer prices. The monthly decrease was driven primarily by goods, which fell 1.4%, led by a 6.4% decline in energy prices, including a sharp drop in gasoline prices. Food prices also declined modestly, while core goods (excluding foods and energy) increased 0.2%, suggesting underlying goods inflation remained firm. Within services, prices rose 0.2%, led by stronger trade margins, while transportation and warehousing edged lower, pointing to continued resilience in service-sector inflation despite easing commodity costs.
In June 2026, the Consumer Price Index (CPI) decreased 0.4% month-over-month, reversing May’s 0.5% increase, while the index was up 3.5% year over year. Core CPI (all items less food and energy) was unchanged on the month and increased 2.6% year over year. The decline in headline inflation was driven primarily by a 5.7% drop in energy prices, which more than offset continued increases in food and shelter costs. Food prices continued to rise modestly, while shelter remained one of the largest contributors to underlying inflation. Despite the sharp decline in headline CPI, core inflation remained relatively stable, suggesting that most of the month’s improvement reflected lower energy prices rather than a broad-based easing in underlying inflation pressures.
Industrial Output and Capacity Utilization
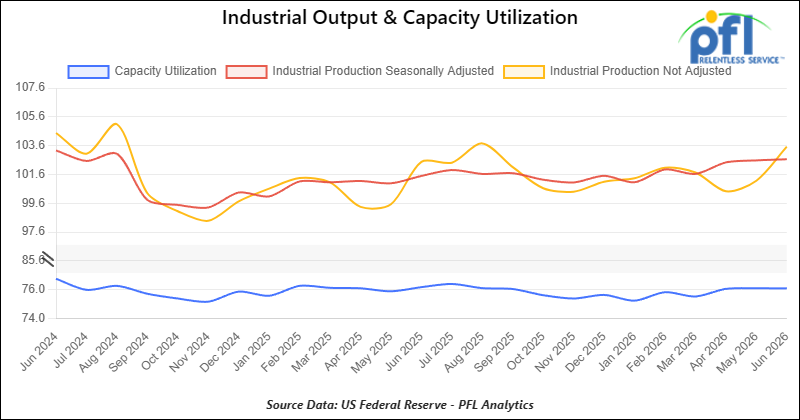
Manufacturing accounts for approximately 75% of total output. Manufacturing output in June increased 0.08% from May 2026.
Capacity utilization is a measure of how fully firms are using machinery and equipment. Capacity utilization decreased by 0.01 percentage points from May in June.
Lease Bids
- 20-50, 4000-5000 Covered Hoppers located off of UP or BNSF in Houston. For use in Urea, Potash, and Ammonium Sulfate service. Period: 6-12 Months.
- 30-50, 25.5K DOT 111 Tanks located off of All Class 1s in various locations. For use in Asphalt service. Period: 1-3 Years.
- 40, 29K DOT 111 Tanks located off of UP or BNSF in the Midwest. For use in Veg Oil service. Period: 5 Year.
- 20, DOT 117J Tanks located off of NS, CSX, CN, or CPKC in various locations. For use in C5 service. Period: 1 year. Need gauge rods.
- 300, 5200CF Covered Hoppers located off of CP or CM in Canada. For use in Petcoke service. Period: 3 Year.
- 10, 30K 117J Tanks located off of BNSF in Canada. For use in Propane or Butane service. Period: 3 Year.
- 20, 28K or larger 117J Tanks located off of BNSF or UP in California. For use in Crude service. Period: 6 months.
- 75, 30K 117 Tanks located off of NS in Ohio. For use in Condensate service. Period: 6-12 Months. Mag Rods Not Needed.
- 100, 28.3K DOT 111 or 117 Tanks located off of CP or CN in Canada. For use in VGO service. Period: 1-3 Years.
- 5, 28.3K DOT 111 or 117 Tanks located off of CN in Canada. For use in Bitumen service. Period: Trip Lease.
- 5-10, 25.5K DOT 111 Tanks located off of CN in Canada. For use in Caustic service. Period: 3-6 Months.
- 100, 340W Pressure Tank located off of CN or CP in Canada. For use in Propane service. Period: 6 Months.
- 10-20, 3200 or 3281 Covered Hoppercars located off of CN or CP in Canada. For use in Sodium Sulphate service. Period: 3-5 years. Lined.
- 50, 340W Pressure Tank located off of CN or CP in Canada. For use in Propane service. Period: Winter.
- 30-50, 340W pressure Tank located off of NS or CSX in Northeast U.S. For use in Propane service. Period: Winter.
- 25, 340W Pressure Tank located off of UP or BN in US. For use in Propane service. Period: Winter.
Sales Bids
- 28, 3400CF Covered Hoppers located off of UP or BNSF in Texas. For use in Cement service. Cement Gates needed.
- 20, 17K DOT111 Tanks located off of various class 1s in various locations. For use in corn syrup service.
- 120, Various Open-Top Aluminum Rotary Gondolas located off of various class 1s in various locations. For use in Sulphur service. Built 2004 or later.
Lease Offers
- 21, 6351 Covered Hoppers located off of CN in Wisconsin. Last used in DDG. Available until February 2027.
- 29, 6500 Covered Hoppers located off of CN in Wisconsin. Last used in DDG. Available until February 2027.
- 50, 20K DOT117J Tanks located off of all class 1s in Moving. Last used in styrene.
- 29, 25.5K DOT117J Tanks located off of UP or BNSF in Texas. Cars are currently clean.
- 200, 340W DOT 112J Tanks located off of all class 1s in Multiple Locations. Last used in propane and butane. Cars are currently clean.
- 15, 6200CF Covered Hoppers located off of all class 1s in Wisconsin. Last used in plastic. Cars are currently clean.
- 30, 6500CF Covered Hoppers located off of all class 1s in Wisconsin. Last used in plastic. Cars are currently clean.
- 6, 21K Stainless Steel Tanks located off of UP in Texas / Mexico Border. Last used in surfactant. Cars are currently clean.
- 100, 28.4K DOT 117J Tanks located off of UP or BNSF in Beaumont, TX. Cars are currently clean.
- 50, 30K DOT117J Tanks located off of UP or BNSF in the South. Last used in ethanol.
- 30, 30K DOT 117R Tanks located off of BNSF in Washington. Last used in renewable jet fuel.
- 80, 30K DOT 117R Tanks located off of BNSF in Washington. Last used in renewable diesel.
- 10, 30K DOT 117R Tanks located off of BNSF in Washington. Last used in renewable naphtha.
- 10, 29K DOT 117R Tanks located off of BNSF and UP in Texas. Last used in gasoline additive. Coiled and Insulated.
- 39, 31K CPC1232 Tanks located off of All Class 1s in Iowa. Last used in diesel.
- 2, 30K DOT 117R Tanks located off of BNSF and UP in Texas. Last used in giesel.
- 1, 30K DOT 117R Tanks located off of BNSF and UP in Texas. Last used in gas blend stock.
- 3, 30K DOT 117R Tanks located off of BNSF and UP in Texas. Last used in gasoline.
- 41, 30K DOT 111 Tanks located off of in Brownsville. Last used in Diesel. Cars are currently clean.
Sales Offers
- 81, 31.8K CPC1232 Tanks located off of UP or BNSF in TX. Last used in Multiple Services. Requal Due in 2025.
- 35, 3400CF Covered Hoppers located off of UP or BNSF in the Midwest. Last used in Sand.
- 25, 30K 117J Tanks located off of CSX in Jackson, TN. Last used in Fuels. Newly Requalified.
Call PFL today to discuss your needs and our availability and market reach. Whether you are looking to lease cars, lease out cars, buy cars, or sell cars call PFL today at 239-390-2885
Railcar for Sale or Lease
| CAT | Type | Capacity | GRL | QTY | LOC | Class | Prev. Use | Offer | Note |
|---|
| CAT | Type | Size | GRL | QTY | LOC | Class | Term | Commodity | Offer | Note |
|---|
| CAT | Type | Capacity | GRL | QTY | LOC | Class | Prev. Use | Clean | Offer | Note |
|---|
| CAT | Type | Capacity | GRL | QTY | LOC | Class | Commodity | Offer | Note |
|---|
PFL will be at the Following Conferences

- Where: The Westin Galleria Dallas
- Attending: David Cohen (954-729-4774), and Curtis Chandler (239-405-3365)
- Conference Website

- Where: The Westin Galleria Dallas
- Attending: Brian Baker (239.297.4519)
- Conference Website