
“May you live all the days of your life.” – Jonathan Swift
Jobs Update
Initial jobless claims seasonally adjusted for the week ending May 23, 2026 came in at 215,000, versus the adjusted number of 210,000 people from the week prior, up 5,000 people week over week.
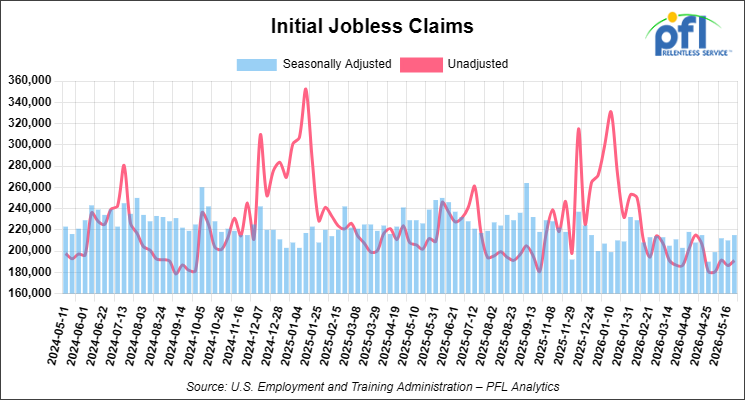
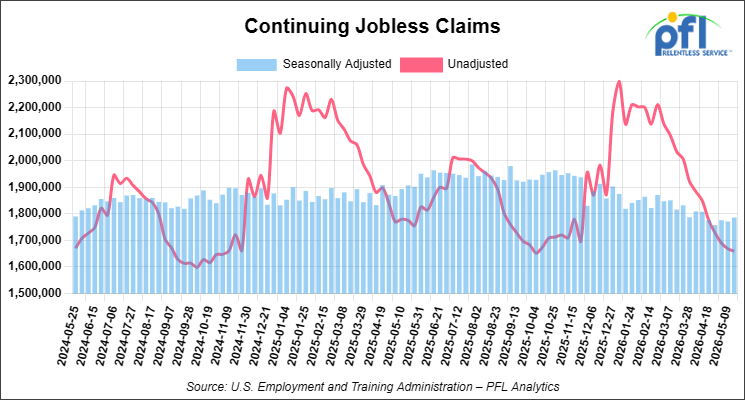
Continuing jobless claims came in at 1,786,000, versus the adjusted number of 1,771,000 people from the week prior, up 15,000 week-over-week.
Stocks closed higher on Friday of last week and higher week-over-week
The DOW closed higher on Friday of last week, up 363.49 points (0.72%), closing out the week at 51,032.46, up 452.51 points week-over-week. The S&P 500 closed higher on Friday of last week, up 16.43 points (0.22%), and closed out the week at 7,580.06, up 106.62 points week-over-week. The NASDAQ closed higher on Friday of last week, up 55.15 points (0.20%), and closed out the week at 26,972.62, up 628.65 points week-over-week.
In overnight trading, DOW futures traded higher and are expected to open at 51,262 this morning, up 185 points from Friday’s close.
Crude oil closed lower on Friday of last week and lower week-over-week
West Texas Intermediate (WTI) crude closed down -1.54 per barrel (-1.7%), to close at $87.69 on Friday of last week, and down $8.91 week-over-week. Brent crude closed down -1.66 per barrel (-1.8%), to close at $92.05, and down $11.49 week-over-week.
One Exchange WCS (Western Canadian Select) for July settled on Friday of last week at US$13.40 below the WTI-CMA (West Texas Intermediate – Calendar Month Average). The implied value was US$74.29 per barrel.
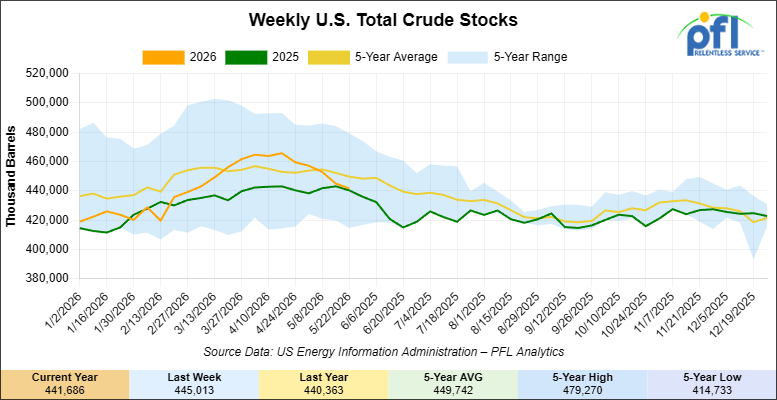
U.S. commercial crude oil inventories (excluding those in the Strategic Petroleum Reserve) decreased by 3.3 million barrels week-over-week. At 441.7 million barrels, U.S. crude oil inventories are 2% below the five-year average for this time of year.
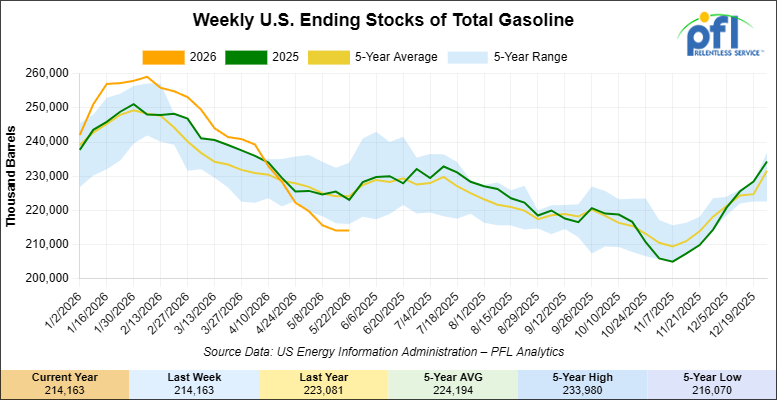
Total motor gasoline inventories decreased by 2.6 million barrels week-over-week and are 6% below the five-year average for this time of year.
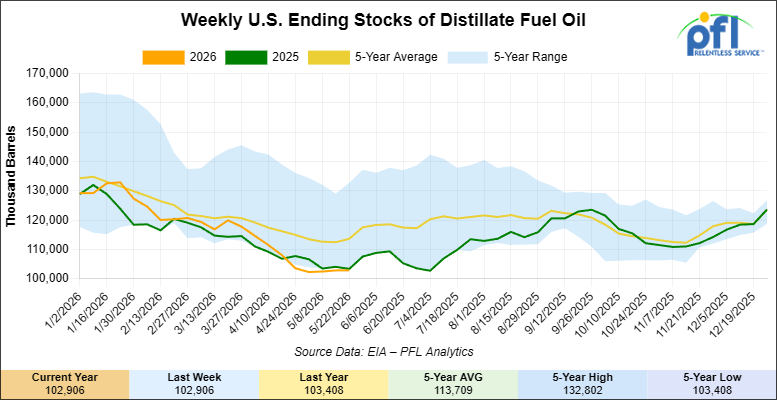
Distillate fuel inventories decreased by 2.1 million barrels week-over-week and are 11% below the five-year average for this time of year.
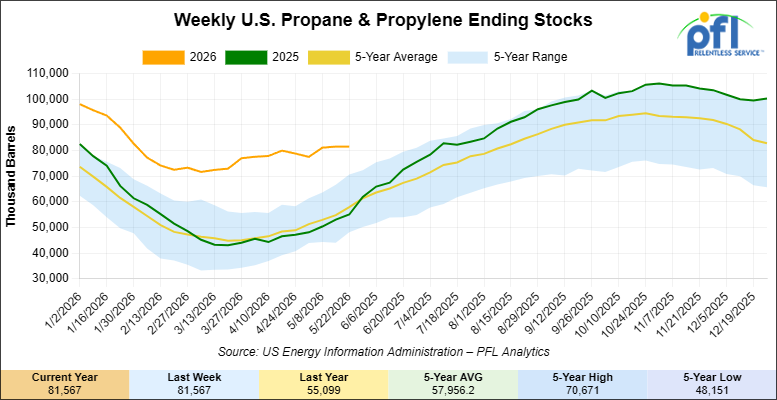
Propane/propylene inventories decreased by 400,000 barrels week-over-week and are 46% above the five-year average for this time of year.
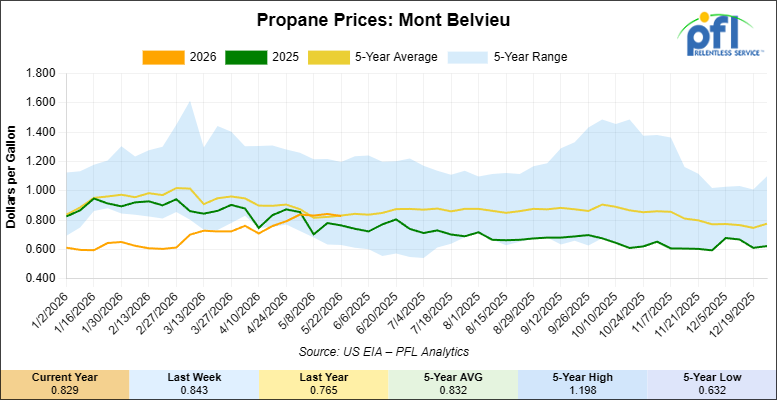
Propane prices closed at 82.9 cents per gallon on Friday of last week, down 1.4 cents per gallon week-over-week, but up 6.4 cents year-over-year.
Overall, total commercial petroleum inventories decreased by 8.3 million barrels week-over-week during the week ending May 22, 2026.
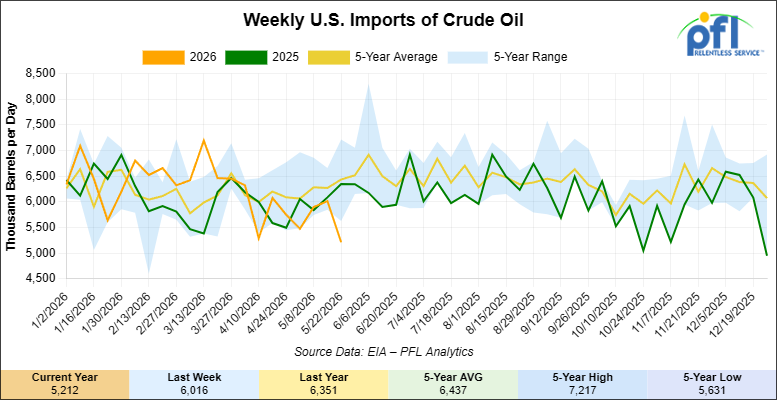
U.S. crude oil imports averaged 5.2 million barrels per day during the week ending May 22, 2026, a decrease of 804,000 barrels per day week-over-week. Over the past four weeks, crude oil imports averaged 5.7 million barrels per day, 7.1% less than the same four-week period last year. Total motor gasoline imports (including both finished gasoline and gasoline blending components) averaged 555,000 barrels per day, and distillate fuel imports averaged 127,000 barrels per day during the week ending May 22, 2026.
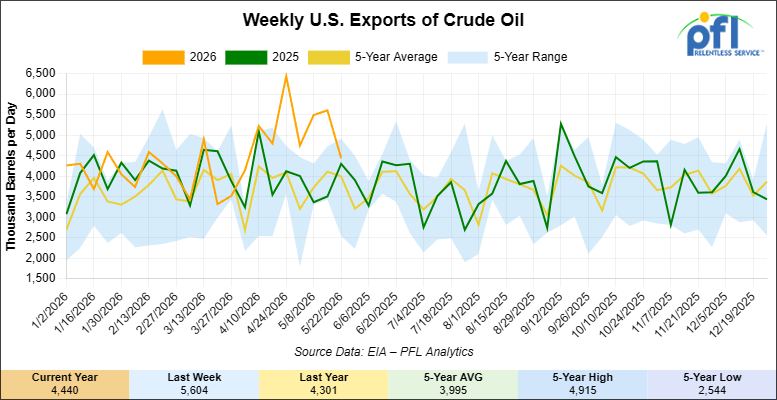
U.S. crude oil exports averaged 4.44 million barrels per day during the week ending May 22, 2026, a decrease of 1.164 million barrels per day week-over-week. Over the past four weeks, crude oil exports averaged 5.072 million barrels per day.
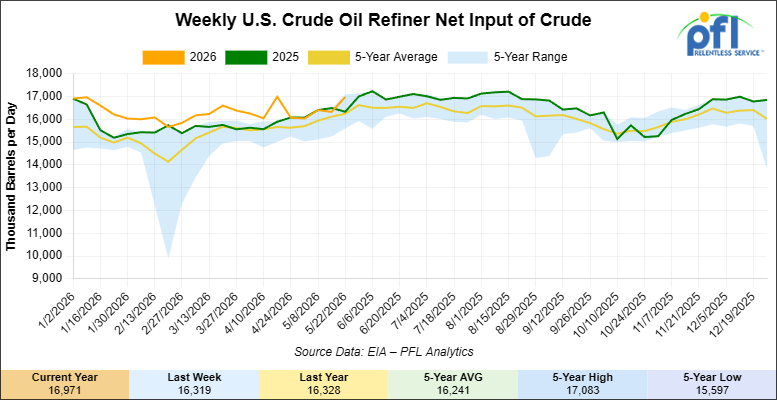
U.S. crude oil refinery inputs averaged 17 million barrels per day during the week ending May 22, 2026, which was 652,000 barrels per day more week-over-week.
WTI is poised to open at $90.75, up $3.39 per barrel from Friday’s close.
North American Rail Traffic
Week Ending May 27, 2026:
Total North American weekly rail volumes were up (+7.00%) in week 22, compared with the same week last year. Total Carloads for the week ending May 27, 2026 were 334,410, up (+3.14%) compared with the same week in 2025, while weekly Intermodal volume was 353,704, up (+10.93%) year over year. 10 of the AAR’s 11 major traffic categories posted year-over-year increases. The largest decrease came from Coal (-0.50%). The largest increase was Grain (+16.16%).
In the East, CSX’s total volumes were up (+7.36%), with the largest decrease coming from Grain (-16.52%), while the largest increase came from Other (+13.86%). NS’s total volumes were up (+4.11%), with the largest increase coming from Petroleum & Petroleum Products (+14.87%), while the largest decrease came from Other (-9.16%).
In the West, BNSF’s total volumes were up (+15.59%), with the largest increase coming from Coal (+51.99%), while the largest decrease came from Chemicals (-6.35%). UP’s total volumes were up (+4.33%), with the largest increase coming from Metallic Ores and Metals (+17.94%), while the largest decrease came from Coal (-14.22%).
In Canada, CN’s total volumes were up (+2.18%), with the largest increase coming from Grain (+53.16%), while the largest decrease came from Metallic Ores and Metals (-11.24%). CPKCS’s total volumes were down (-3.58%), with the largest increase coming from Nonmetallic Minerals (+38.68%), while the largest decrease came from Coal (-43.75%).
Source Data: AAR – PFL Analytics
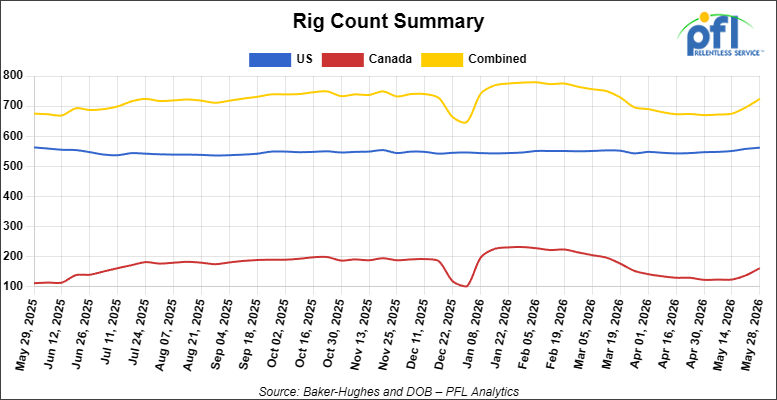
North American Rig Count Summary
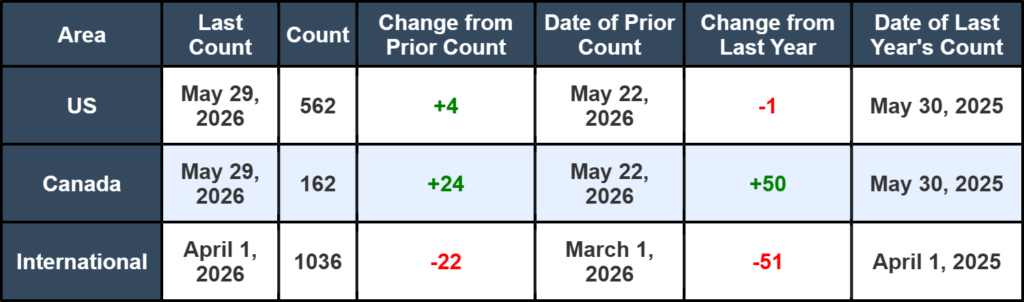
North American rig count was up by +28 rigs week-over-week. The US rig count was up by +4 rigs week-over-week, but down by -1 rig year-over-year. The US currently has 562 active rigs. Canada’s rig count was up by +24 rigs week-over-week and up by +50 rigs year-over-year. Canada currently has 162 active rigs. Overall, year-over-year we are up by +49 rigs collectively.
We are watching a few things out there for you:
We Are Watching Petroleum Carloads
The four-week rolling average of petroleum carloads carried on the six largest North American railroads rose to 29,494 from 29,257 which was an increase of +237 rail cars week-over-week. Canadian volumes were mixed. CKPC’s shipments were lower by -7.0% week-over-week, CN’s volumes were higher by +8.0% week-over-week. U.S. shipments were mostly lower. The CSX had the largest percentage decrease and was down by -8.0%. The NS was the sole gainer and was up by +5.0% week-over-week.
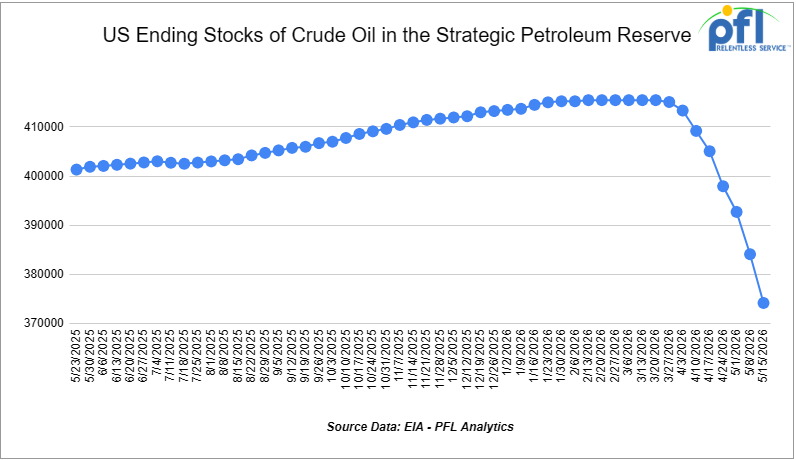
We Continue to Watch Our Strategic Petroleum Reserves
The ongoing emergency drawdown of the U.S. Strategic Petroleum Reserve (SPR) remains a major component of global efforts to offset crude oil supply disruptions stemming from the conflict involving Iran and the continued restrictions on oil shipments through the Strait of Hormuz. Since March, the Department of Energy (DOE) has awarded exchanges covering more than 80 million barrels of crude oil, with additional releases expected as part of a broader international response coordinated through the International Energy Agency (IEA).
The United States committed to making up to 172 million barrels available from the SPR under the IEA’s collective plan to inject roughly 400 million barrels into global energy markets. Officials have argued that the releases are necessary to help stabilize crude supplies and limit further increases in fuel prices as refiners compete for replacement barrels amid ongoing transportation disruptions.
As releases have accelerated, inventories in the SPR have declined to 365.112 million barrels, down sharply from levels above 450 million barrels earlier this year and approaching the lowest levels since mid-2024. Recent weekly withdrawals have ranked among the largest on record, highlighting the scale of the government’s intervention in oil markets. On average, since the war started with Iran, we have pulled 964,226 barrels per day from storage for the week ending May 22, 2026.
Global petroleum inventories have also tightened considerably. The IEA has reported substantial draws in commercial crude and refined-product stockpiles across major consuming nations, underscoring the strain that the conflict has placed on world energy markets. Agency officials have indicated that further coordinated actions remain possible should supply disruptions persist or intensify.
The Administration continues to emphasize that the current program consists primarily of exchange agreements, rather than outright sales. Under these arrangements, companies receiving crude oil today are required to return the borrowed barrels in the future along with additional volumes as a premium. Energy Secretary Chris Wright has stated that the objective is to eventually restore the SPR to levels above those that existed prior to the current emergency releases.
Meanwhile, energy prices remain elevated compared with pre-conflict levels, keeping fuel costs a focus for consumers, businesses, and policymakers alike. Market participants continue to monitor developments in the Middle East, future IEA actions, and the pace of SPR releases as key factors influencing oil prices through the remainder of the year.
We are Watching Canadian Crude Oil Exports by Rail
The Canadian Energy regulator reported on May 20, 2026, that 74,248 barrels were exported during the month of March 2026, down from 79,057 barrels in February of 2026, a decrease of -4,809 barrels per day month-over-month and its lowest level since July of 2025 where only 70,031 barrels per day were exported. It will be interesting to see how April volumes come in.
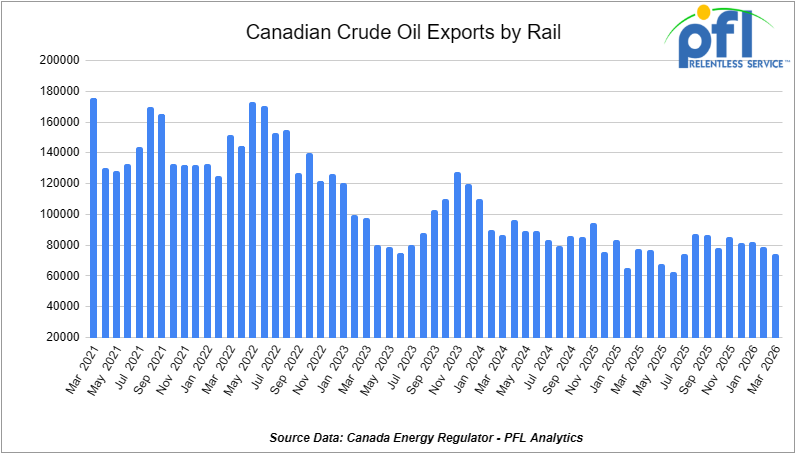
Crude by rail will always be necessary out of Canada for stranded oil not connected by pipelines. Raw bitumen, which is shipped as a non-haz product and is not able to flow in pipelines, is competitive with pipeline tolls and is a growing market to keep an eye on, particularly in light of Strathcona and Gibson announcing new projects. Other factors would be existing long-term contractual commitments and basis – we really need to see basis WTI-CMA (West Texas Intermediate – Calendar Month Average) blowout to -18 per barrel for sustained periods of time to make economic sense. Current rail rates from Alberta to the U.S. Gulf Coast have averaged $15.36 per barrel, making rail competitive whenever WCS-WTI spreads exceed $18 per barrel, including quality adjustments.
We Continue to Watch Hormuz
The Iran ceasefire framework moved closer to a durable extension last week, and crude markets responded with the kind of move we have been waiting on for three months. Brent closed at $92.56 on Friday, May 29th and WTI at $87.18, leaving Brent down roughly 19% in May, its worst month since the COVID collapse. WTI Houston traded at $88.47 to close the week, off $12.27. LLS gave up $12.39. Bakken at Clearbrook fell $9.54 to $87.03 and WCS at Hardisty was down $6.29 at $71.43.
The product complex moved with it. USGC gasoline lost just over 30 cents on the week, ULSD lost just under 30 cents, and New York Harbor jet fuel hit its lowest level since the start of the Iran war last Wednesday. Diesel inventories told a different story, falling to 91.2 million barrels for the week ended May 22, the lowest level since November 2014. That is what a war does to inventory levels when refined product exports stay elevated. May diesel exports averaged 1.34 million barrels per day per Kpler, the highest in at least nine years.
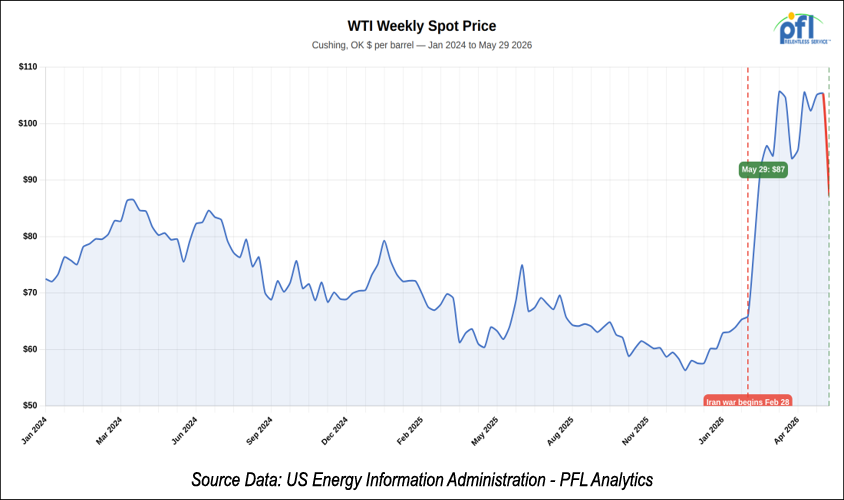
The peace framework remains technically unsigned. U.S. and Iranian forces exchanged strikes last Thursday before markets settled lower on hopes the ceasefire extension would hold. Amos Hochstein told CNBC the same morning that the Iranians will control the Strait of Hormuz for the foreseeable future no matter what the deal says, and that everyone in the region understands this. That is the operating assumption now. Tankers are starting to transit again under Iranian protection, but volume is well below pre-war levels and the security premium will linger.
U.S. retail gasoline averaged $4.475 per gallon in the week ended May 25, still up $1.538 from the week before the war began. PFL is not calling the bottom on this move, and neither should anyone else. Hormuz has resolved itself partially, twice, in the past ten weeks, and re-escalated each time. The OPEC+ ministerial meeting next Sunday is the next catalyst.
We Continue to Watch the Enbridge
We flagged the June Mainline number last week. The new wrinkle is that the Trans Mountain system is expected to be apportioned for the first time since the Expansion came online in May 2024. Both major WCSB egress pipelines are now effectively full at the same time, a setup we have not seen in two years. Enbridge rejected 19% of heavy crude nominations on the 3.1 million barrel per day Mainline for June flow, the highest level since before TMX started up. TMX June loadings traded at a $6.40 discount to June CMA Nymex on an fob Vancouver basis for prompt 21-30 June cargoes, and May loadings averaged 491,000 barrels perday, per Kpler, a six-month high. Asia-Pacific demand for heavy Canadian barrels has been the swing factor. The Iran war disrupted Mideast Gulf medium and heavy sour supply and Vancouver became the reliable alternative in the Pacific basin.
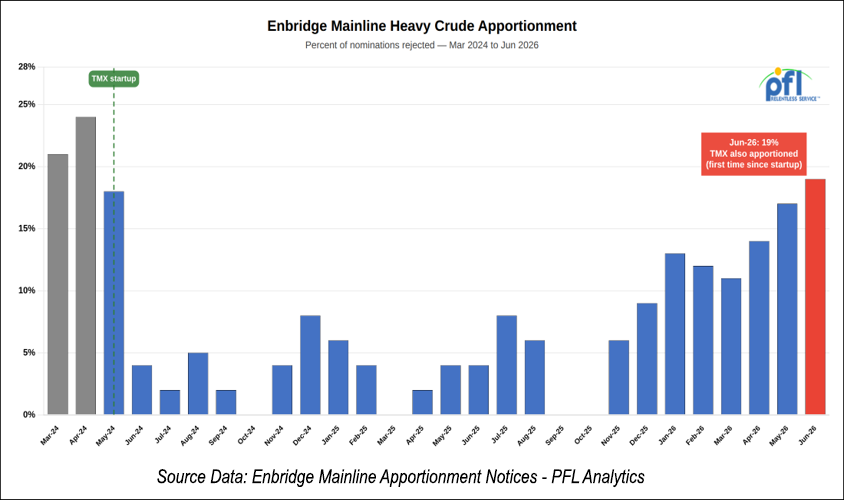
On the rail economics, the picture is improving but not there yet. WCS at Houston traded around a $7.10 premium to Hardisty during the May trade cycle, well short of the $15 to $20 spread that typically makes uncommitted crude by rail movements viable. The Alberta to USGC unit train rate for June is roughly $17 per barrel. The bitumen is there. Q1 thermal production hit a record 1.74 million barrels per day. The egress is the bottleneck.
This could be the beginning of another crude by rail cycle if pipeline constraints persist and the basis blows out further and crude price remains elevated. Time will tell, and it is geopolitically dependent. If Hormuz reopens and Pacific basin demand for Vancouver barrels cools, TMX apportionment would be the first thing to ease. Stay tuned to PFL for further details.
We Continue to Watch Left Wing Carney
Carney spent last week pitching U.S. investors at the Economic Club of New York and tightening his domestic carbon framework. His position on Alberta is now formalized in four words: no pathways, no pipeline. Alberta is on the hook to submit its West Coast pipeline application to the Major Projects Office by July 1, and Ottawa has committed to designating it a project of national interest by October 1st.
The May 15th Implementation Agreement detailed the carbon side of the trade. Alberta’s industrial carbon price will sit at $100 per tonne from 2027 through 2029, then step up to $140 by 2040, with a floor of $110 per tonne by 2040. Both the Oil Sands Alliance and CAPP have publicly stated the levy is uniquely Canadian and places uncompetitive costs on the industry. That is the producer view of a deal Ottawa is calling a compromise.
The trilateral with the Oil Sands Alliance on Pathways remains unresolved, despite an April 1 deadline that came and went. Without Pathways, by Carney’s own framing, there is no pipeline. Putting significant new capital into oil sands projects to fill that pipeline, beyond optimization and debottlenecking, now requires additional scrutiny from a consortium that is already at odds with the federal carbon framework. The math is not in dispute. Pathways is large, expensive, technically intricate, and dependent on the same companies the federal government is taxing at a higher rate.
Premier Smith has appealed the judicial ruling that quashed Alberta’s separation referendum question, and BC Premier Eby has openly questioned whether projects should be fast-tracked because a premier threatens to leave the country. The internal politics of this deal are nowhere near settled, and we are not convinced the September 2027 construction commencement date will hold. Ottawa wants the headline. The producers want the economics. Those two things have not yet been reconciled, and we will believe the September 2027 timeline when we see steel in the ground.
We Are Watching Prairie Connector
South Bow announced last Thursday that its proposed Prairie Connector pipeline secured the binding commitments it needed in the March 30 open season. Twenty-year firm transportation commitments from Hardisty to U.S. delivery points are now in hand, with a final investment decision targeted for mid-2027. Reuters reported earlier this month that at least 400,000 barrels per day was committed against the 450,000 barrels per day on offer. South Bow did not disclose the final tally.
The project would extend from Hardisty to the Canada-U.S. border in Phillips County, Montana, using roughly 150 kilometres of partially built and currently unused Keystone XL infrastructure, plus 380 kilometres of new 36-inch pipe. At the border, Prairie Connector hands off to Bridger Pipeline’s proposed 550,000 barrel per day expansion that runs south to Guernsey, Wyoming. President Trump approved the cross-border permit for that crossing on April 30, his third time signing off on a permit at that location. Biden rescinded the previous one in 2021.
ATB Cormark estimates the project will cost approximately $3 billion and take two to three years to build after FID. Under South Bow’s stated mid-2027 FID target and a conservative construction window, that puts honest in-service somewhere in 2030, not before, and the permit durability risk is real. Energy analyst AJ O’Donnell at TPH said publicly that without assurances a future U.S. administration would not revoke the permit, as Biden did with Keystone XL, the project is likely to be stalled. South Bow CEO Bevin Wirzba has been using the word durable in every public statement on the project for a reason.
Spreading the cross-border risk between South Bow and Bridger, rather than concentrating it in one developer the way TC Energy carried Keystone XL on its own, is a meaningful structural change. Whether it is meaningful enough to survive a future administration that decides cross-border crude pipelines are politically inconvenient remains to be seen. For our customers, the relevant point is that this is a 2030 story at the earliest, and that the egress crunch will be resolved by rail, not by Prairie Connector, in the near term.
We Are Watching the Jones Act
The Jones Act waiver Trump signed on March 17 has now generated more than 60 foreign-flag vessel movements between U.S. ports, including at least six crude cargoes. Phillips 66 has used the waiver twice to move WTI and Bakken from its Nederland terminal in Texas to its Bayway refinery in New Jersey, which is exactly the route Bakken-loaded tank cars have served for the past decade. The Aframax Front Altair loaded 596,700 barrels of WTI at Beaumont on April 29 and discharged at Bayway on May 13. That cargo alone represents roughly 1,100 tank cars of equivalent volume.
Foreign-flag tonnage is cheaper than Jones Act tonnage, and cheaper than rail when the rail spread is wherever it is on a given week. PBF Energy plans to use the waiver this quarter to move WTI and other domestic grades to its Paulsboro refinery in New Jersey, which historically ran Saudi Aramco crude, and a foreign-flagged Suezmax recently moved 848,000 barrels of WTI from Enterprise to Monroe Energy’s Trainer refinery in Pennsylvania. Marathon has used the waiver to move jet fuel from the USGC to Alaska and alkylate from the USGC to Los Angeles. Phillips 66 has tripled its time-chartered vessel count over the past two years and is leveraging that flexibility hard.
The waiver runs through August 15, 2026. Every gallon of crude that moves coastwise during the waiver window is a gallon that does not move by rail or by pipeline, and the displaced demand has shown up directly in Bakken-to-east-coast rail economics. If Hormuz reopens cleanly and the waiver is allowed to expire on schedule, that displaced demand comes back. If the waiver is extended into the fall, it does not. The Offshore Marine Service Association is fighting the extension. Hawaii’s congressional delegation is pushing for it.
PFL has been fielding calls from shippers on east coast crude routings and what August 15th actually means for fleet utilization. Our take is straightforward: assume the waiver expires on schedule, plan for the rail demand to come back, and be ready for an extension that pushes the recovery into Q4.
We Continue to Watch the Surface Transportation Board
The STB accepted the revised Union Pacific-Norfolk Southern merger application Thursday of last week, then immediately put the entire process on hold. The proceedings are now in abeyance until UP and NS submit supplemental information by July 27th, and the National Environmental Policy Act review is on hold along with everything else.
The Board identified specific areas where the revised application is unclear or underdeveloped, including market share projections, service assurance plans, and passenger rail considerations. It also denied UP and NS’s motion to allow informal communications between the railroads and Board members outside the formal record, citing concern that a broad waiver at this stage could compromise the integrity of the proceeding. The walk-away clause remains January 28, 2028. Either side can exit by then.
BNSF, CN, CPKC, the National Industrial Transportation League, the Freight Rail Customer Alliance and the Stop the Rail Merger Coalition all issued statements welcoming the additional scrutiny. NITL’s executive director said even with the application now deemed complete, it is still lacking the transparency the Board and stakeholders need for a thorough review. UP has said publicly it will exit the deal if the Board orders widespread line sales or broad trackage rights as approval conditions, and the request for more detail on market share and service assurance suggests the Board is not ready to take UP and NS’s numbers at face value. That is the central tension. UP wants a clean approval. The Board wants thorough analysis. Those goals are not the same.
The July 27tg supplemental filing deadline pushes the formal review further into the second half of 2026 and makes a final decision before late 2027 highly unlikely. PFL is unconvinced this merger gets across the finish line on the timeline UP and NS originally floated, and the abeyance order last week makes that doubt sharper.
We Are Watching CPKC
CPKC’s roughly 300 signals and communications workers walked off the job at 8:00 a.m. Mountain Daylight Time Sunday morning after the International Brotherhood of Electrical Workers Canadian Signals and Communications System Council No. 11 rejected the railroad’s latest contract offers. CPKC has implemented its contingency plans and says safe and efficient rail service has continued across its Canadian network. The strike was backed by a 96% mandate vote and follows months of bargaining including federally mandated conciliation and mediation. CPKC is publicly encouraging the IBEW to accept binding arbitration to end the work stoppage.
These are the people who install and repair trackside signals, switches, and grade-crossing warning systems across CPKC’s Canadian network. CPKC has stated it has contingency plans to maintain safe and efficient operations, but a strike of any meaningful duration degrades the railroad’s ability to respond to signal failures and grade-crossing incidents, full stop. Replacement coverage is not the same as a fully staffed signals department, and every shipper on the CPKC network knows it.
The union is citing wages, on-call obligations, work-life balance, and retention. Their position is that experienced workers are leaving for better-paying opportunities elsewhere and that CPKC’s offer does not address it. CPKC says its offer is consistent with the wage and benefit increases it has negotiated with every other Canadian union in the past year, and that negotiations are continuing in good faith. Both things can be true. The 96% mandate suggests the workforce does not see it that way.
For our customers and the broader Canadian rail network, a prolonged CPKC C&S strike means slower trains, more cautious dispatch decisions, and a real possibility of federal intervention if the work stoppage extends beyond a week. Folks, the Canadian rail labour environment has been a slow-rolling problem for two years, and the strike that started Sunday morning is the latest chapter.
We Are Watching Key Economic Indicators
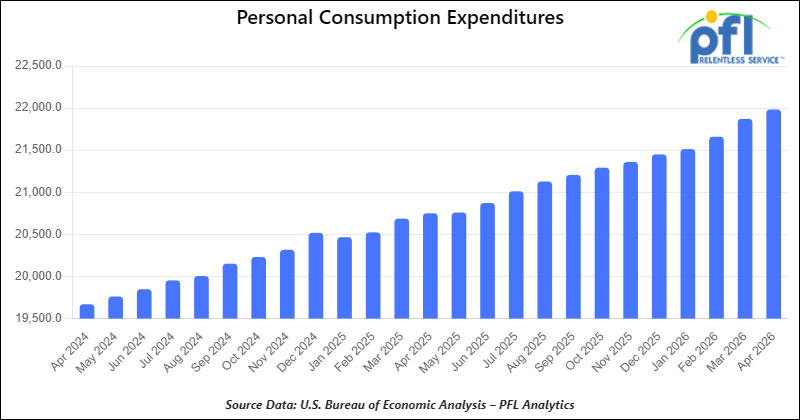
Consumer Spending
In April 2026, total consumer spending adjusted for inflation rose 0.2% from March 2026, continuing a moderate pace of growth in household demand. This follows a 0.1% increase in February and a 0.5% increase in January. Year-over-year inflation-adjusted total spending in April 2026 was up 2.7%.
Inflation-adjusted spending on goods rose 0.1% in April, following a 0.3% increase in March 2026. Inflation-adjusted spending on services increased 0.3% in April, extending the ongoing strength in service-sector consumption and marking the thirteenth consecutive month-to-month increase.
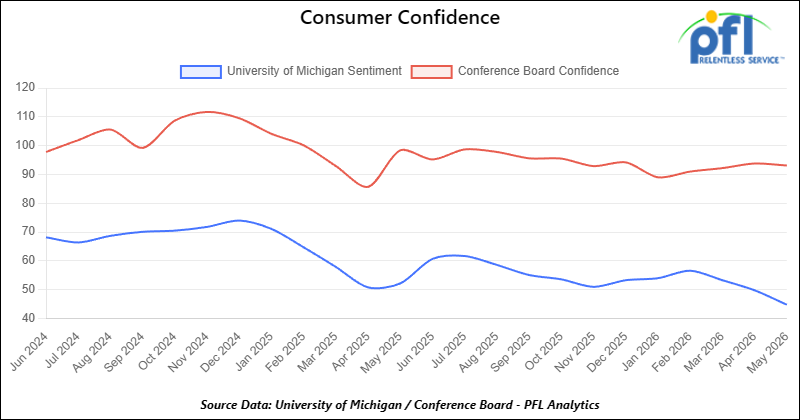
Consumer Confidence
The Index of Consumer Sentiment from the University of Michigan decreased from 49.8 in April to 44.8 in May.
The Conference Board Consumer Confidence Index decreased from 93.8 in April to 93.1 in April.
Lease Bids
- 100, 21.9K 117J Tanks located off of All Class 1s in the Midwest. For use in CO2 service. Period: 6 months.
- 30-50, 30K 117J Tanks located off of NS or CSX in the Northeast. For use in C5 service. Period: 1 year.
- 20-50, 4000-5000 Covered Hoppers located off of UP or BNSF in Houston. For use in Urea, Potash, and Ammonium Sulfate service. Period: 6-12 Months.
- 200, 33K Pressure Tanks located off of CSX or NS in Ohio. For use in Propylene service. Period: 18 Months.
- 30-50, 25.5K DOT 111 Tanks located off of All Class 1s in various locations. For use in Asphalt service. Period: 1-3 Years.
- 40, 33K Pressure Tanks located off of UP in Eunice, LA. For use in Propane service. Period: 1 Year.
- 40, 29K DOT 111 Tanks located off of UP or BNSF in the Midwest. For use in Veg Oil service. Period: 5 Year.
- 70, 30K DOT 117 Tanks located off of NS or CSX in Ohio. For use in Diesel service. Period: 3 months.
- 20, DOT 117J Tanks located off of NS, CSX, CN, or CPKC in various locations. For use in C5 service. Period: 1 year. Need gauge rods.
- 300, 5200CF Covered Hoppers located off of CP or CM in Canada. For use in Petcoke service. Period: 3 Year.
- 10, 30K 117J Tanks located off of BNSF in Canada. For use in Propane or Butane service. Period: 3 Year.
- 20, 28K or larger 117J Tanks located off of BNSF or UP in California. For use in Crude service. Period: 6 months.
- 75, 30K 117 Tanks located off of NS in Ohio. For use in Condensate service. Period: 6-12 Months. Mag Rods Not Needed.
Sales Bids
- 28, 3400CF Covered Hoppers located off of UP or BNSF in Texas. For use in Cement service. Cement Gates needed.
- 20, 17K DOT111 Tanks located off of various class 1s in various locations. For use in corn syrup service.
- 120, Various Open-Top Aluminum Rotary Gondolas located off of various class 1s in various locations. For use in Sulphur service. Built 2004 or later.
- 30, 29K DOT111 Tanks located off of various class 1s in Chicago. For use in Veg Oil service.
Lease Offers
- 21, 6351 Covered Hoppers located off of CN in Wisconsin. Last used in DDG. Available until February 2027.
- 29, 6500 Covered Hoppers located off of CN in Wisconsin. Last used in DDG. Available until February 2027.
- 50, 20K DOT117J Tanks located off of all class 1s in Moving. Last used in styrene.
- 29, 25.5K DOT117J Tanks located off of UP or BNSF in Texas. Cars are currently clean.
- 200, 340W DOT 112J Tanks located off of all class 1s in Multiple Locations. Last used in propane and butane. Cars are currently clean.
- 15, 6200CF Covered Hoppers located off of all class 1s in Wisconsin. Last used in plastic. Cars are currently clean.
- 30, 6500CF Covered Hoppers located off of all class 1s in Wisconsin. Last used in plastic. Cars are currently clean.
- 6, 21K Stainless Steel Tanks located off of UP in Texas / Mexico Border. Last used in surfactant. Cars are currently clean.
- 100, 28.4K DOT 117J Tanks located off of UP or BNSF in Beaumont, TX. Cars are currently clean.
- 50, 30K DOT117J Tanks located off of UP or BNSF in the South. Last used in ethanol.
- 30, 30K DOT 117R Tanks located off of BNSF in Washington. Last used in renewable jet fuel.
- 80, 30K DOT 117R Tanks located off of BNSF in Washington. Last used in renewable diesel.
- 10, 30K DOT 117R Tanks located off of BNSF in Washington. Last used in renewable naphtha.
- 10, 29K DOT 117R Tanks located off of BNSF and UP in Texas. Last used in gasoline additive. Coiled and Insulated.
- 39, 31K CPC1232 Tanks located off of All Class 1s in Iowa. Last used in diesel.
- 99, 31K CPC1232 Tanks located off of BNSF and UP in Texas. Last used in diesel.
- 1, 31K CPC1232 Tanks located off of BNSF and UP in Texas. Last used in naphtha.
- 2, 30K DOT 117R Tanks located off of BNSF and UP in Texas. Last used in giesel.
- 1, 30K DOT 117R Tanks located off of BNSF and UP in Texas. Last used in gas blend stock.
- 3, 30K DOT 117R Tanks located off of BNSF and UP in Texas. Last used in gasoline.
- 36, 31K CPC1232 Tanks located off of CPKC in Texas. Last used in diesel.
- 6, 31K CPC1232 Tanks located off of CPKC in Texas. Last used in naphtha.
Sales Offers
- 81, 31.8K CPC1232 Tanks located off of UP or BNSF in TX. Last used in Multiple Services. Requal Due in 2025.
- 35, 3400CF Covered Hoppers located off of UP or BNSF in the Midwest. Last used in Sand.
- 25, 30K 117J Tanks located off of CSX in Jackson, TN. Last used in Fuels. Newly Requalified.
Call PFL today to discuss your needs and our availability and market reach. Whether you are looking to lease cars, lease out cars, buy cars, or sell cars call PFL today at 239-390-2885
Live Railcar Markets
| CAT | Type | Capacity | GRL | QTY | LOC | Class | Prev. Use | Offer | Note |
|---|
PFL will be at the Following Conferences

- Where: Loews Arlington Hotel
- Attending: Brian Baker (239.297.4519), David Cohen (954-729-4774), and Curtis Chandler (239-405-3365)
- Conference Website

- Where: The Westin Galleria Dallas
- Attending: David Cohen (954-729-4774), and Curtis Chandler (239-405-3365)
- Conference Website

- Where: The Westin Galleria Dallas
- Attending: Brian Baker (239.297.4519)
- Conference Website