
“Happiness and moral duty are inseparably connected.” – George Washington
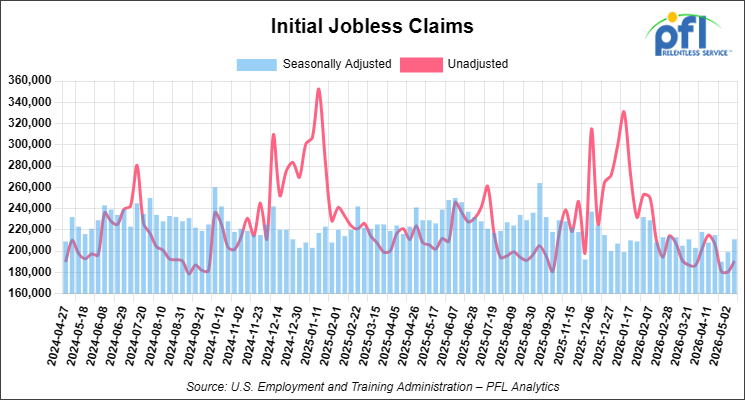
Jobs Update
Initial jobless claims seasonally adjusted for the week ending May 9, 2026 came in at 211,000, versus the adjusted number of 199,000 people from the week prior, up 12,000 people week over week.
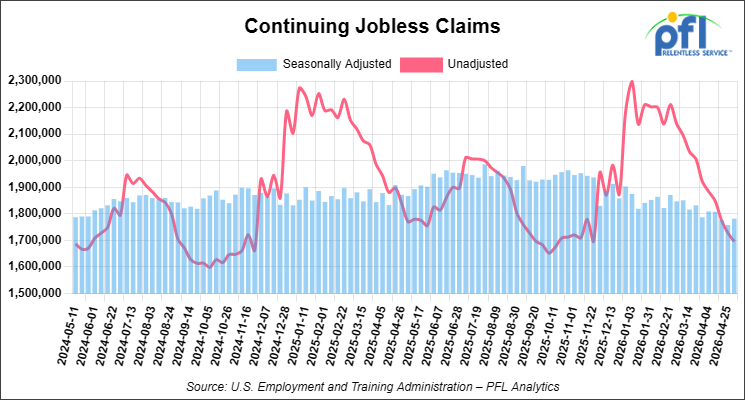
Continuing jobless claims came in at 1,782,000, versus the adjusted number of 1,758,000 people from the week prior, up 24,000 week-over-week.
Stocks closed lower on Friday of last week and mixed week-over-week
The DOW closed lower on Friday of last week, down -537.29 points (-1.07%), closing out the week at 49,526.17, down -82.99 points week-over-week. The S&P 500 closed lower on Friday of last week, down -92.74 points (-1.24%), and closed out the week at 7,408.50, up 9.57 points week-over-week. The NASDAQ closed lower on Friday of last week, down -410.08 points (-1.54%), and closed out the week at 26,224.14, down -22.94 points week-over-week.
In overnight trading, DOW futures traded lower and are expected to open at 49,316 this morning, down 301 points from Friday’s close.
Crude oil closed higher on Friday of last week and higher week-over-week
West Texas Intermediate (WTI) crude closed up $4.25 per barrel (4.2%), to close at $105.42 on Friday of last week, and up $10.00 week-over-week. Brent crude closed up $3.54 per barrel (3.35%), to close at $109.26, and up $7.97 week-over-week.
One Exchange WCS (Western Canadian Select) for June delivery settled on Friday of last week at US$15.35 below the WTI-CMA (West Texas Intermediate – Calendar Month Average). The implied value was US$80.90 per barrel.
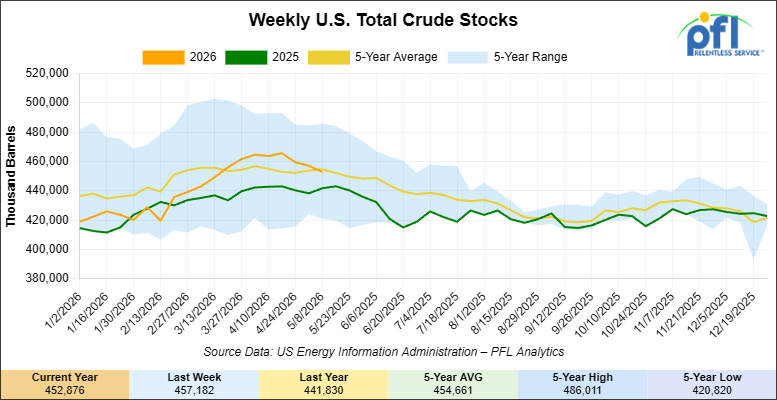
U.S. commercial crude oil inventories (excluding those in the Strategic Petroleum Reserve) decreased by 4.3 million barrels week-over-week. At 452.9 million barrels, U.S. crude oil inventories are 0.3% below the five-year average for this time of year.
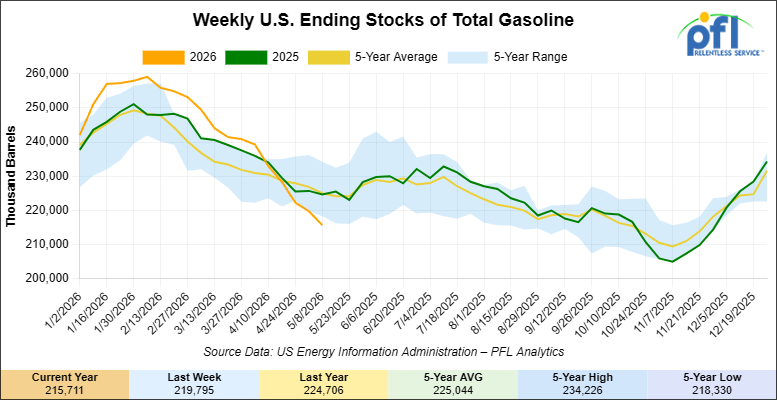
Total motor gasoline inventories decreased by 4.1 million barrels week-over-week and are 5% below the five-year average for this time of year.
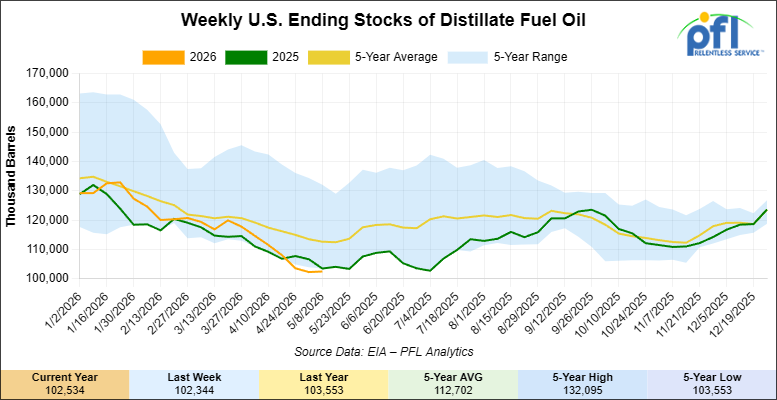
Distillate fuel inventories increased by 200,000 barrels week-over-week and are 9% below the five-year average for this time of year.
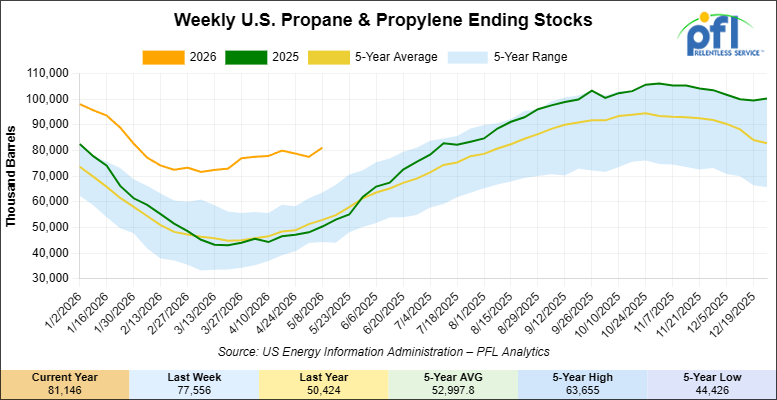
Propane/propylene inventories increased by 3.6 million barrels week-over-week and are 55% above the five-year average for this time of year.
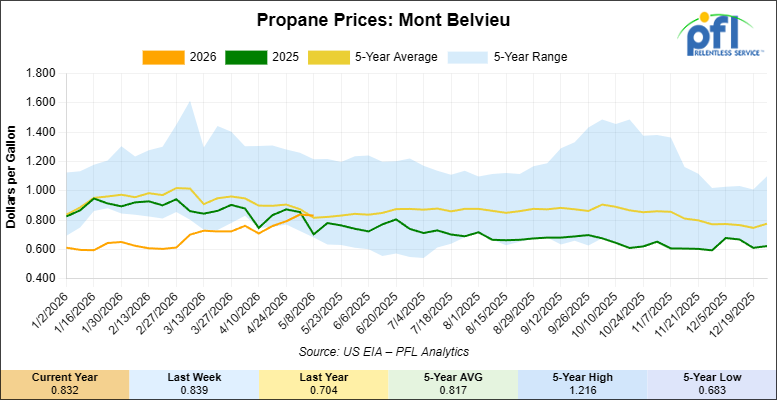
Propane prices closed at 83.2 cents per gallon on Friday of last week, down 0.7 cents per gallon week-over-week, but up 12.8 cents year-over-year.
Overall, total commercial petroleum inventories decreased by 5.1 million barrels week-over-week during the week ending May 8, 2026.
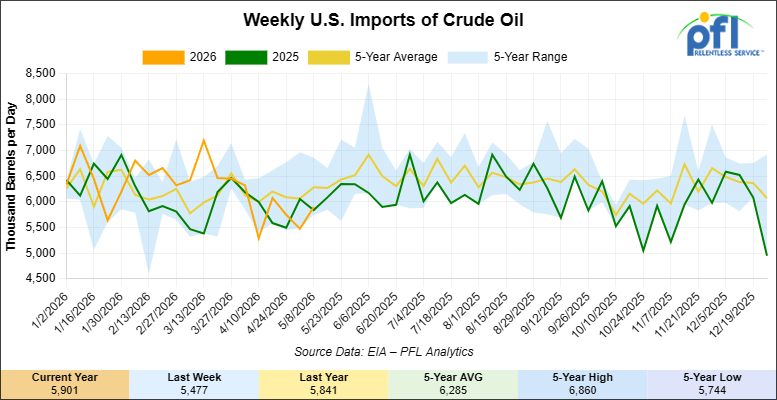
U.S. crude oil imports averaged 5.9 million barrels per day during the week ending May 8, 2026, an increase of 424,000 barrels per day week-over-week. Over the past four weeks, crude oil imports averaged 5.8 million barrels per day, 1.0% more than the same four-week period last year. Total motor gasoline imports (including both finished gasoline and gasoline blending components) averaged 303,000 barrels per day, and distillate fuel imports averaged 214,000 barrels per day during the week ending May 8, 2026.
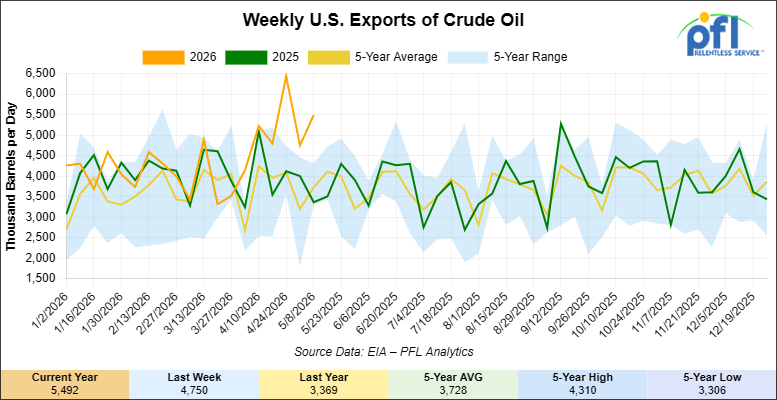
U.S. crude oil exports averaged 5.492 million barrels per day during the week ending May 8, 2026, an increase of 742,000 barrels per day week-over-week. Over the past four weeks, crude oil exports averaged 5.37 million barrels per day.
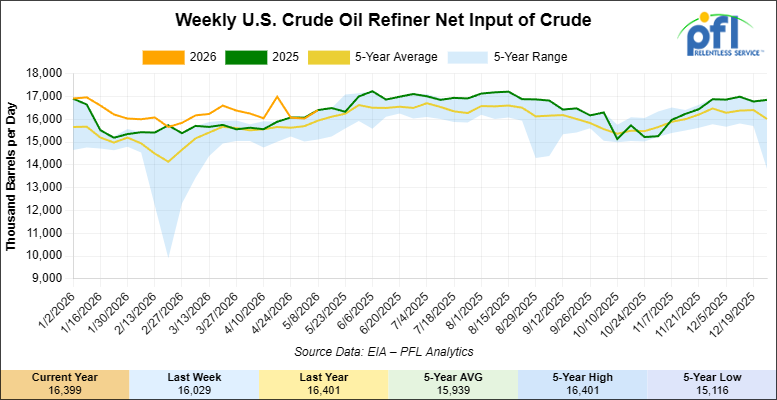
U.S. crude oil refinery inputs averaged 16.4 million barrels per day during the week ending May 8, 2026, which was 369,000 barrels per day more week-over-week.
WTI is poised to open at $102.05, up $1.03 per barrel from Friday’s close.
North American Rail Traffic
Week Ending May 13, 2026:
Total North American weekly rail volumes were up (+4.11%) in week 20, compared with the same week last year. Total Carloads for the week ending May 13, 2026 were 334,332, up (+4.45%) compared with the same week in 2025, while weekly Intermodal volume was 341,673, up (+3.78%) year over year. 10 of the AAR’s 11 major traffic categories posted year-over-year increases. The largest decrease came from Metallic Ores and Metals (-9.28%). The largest increase was Grain (+18.73%).
In the East, CSX’s total volumes were up (+5.50%), with the largest decrease coming from Grain (-7.32%), while the largest increase came from Metallic Ores and Metals (+11.16%). NS’s total volumes were up (+2.12%), with the largest increase coming from Petroleum & Petroleum Products (+45.88%), while the largest decrease came from Nonmetallic Minerals (-6.26%).
In the West, BNSF’s total volumes were up (+8.21%), with the largest increase coming from Coal (+51.96%), while the largest decrease came from Metallic Ores and Metals (-7.29%). UP’s total volumes were up (+2.23%), with the largest increase coming from Grain (+42.32%), while the largest decrease came from Coal (-21.19%).
In Canada, CN’s total volumes were down (-5.98%), with the largest increase coming from Coal (+51.96%), while the largest decrease came from Metallic Ores and Metals (-35.65%). CPKCS’s total volumes were up (+13.63%), with the largest increase coming from Nonmetallic Minerals (+36.18%), while the largest decrease came from Other (-21.51%).
Source Data: AAR – PFL Analytics
North American Rig Count Summary
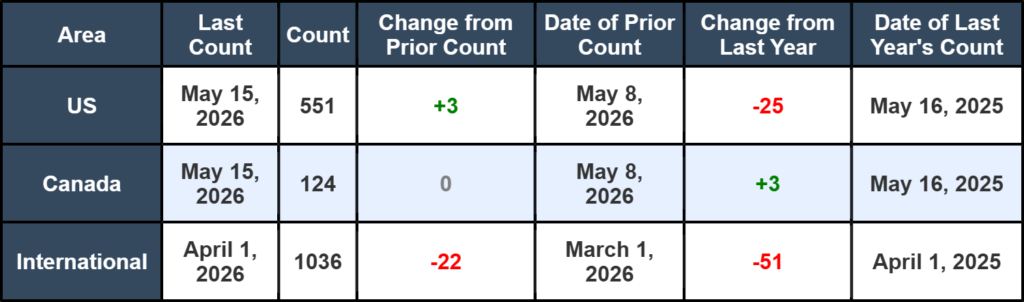
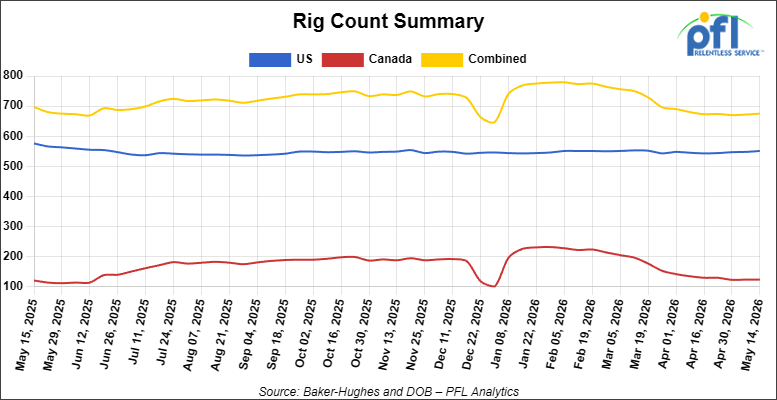
North American rig count was up by +3 rigs week-over-week. The US rig count was up by +3 rigs week-over-week, but down by -25 rigs year-over-year. The US currently has 551 active rigs. Canada’s rig count was unchanged week-over-week and up by +3 rigs year-over-year. Canada currently has 124 active rigs. Overall, year-over-year we are down by -22 rigs collectively.
We are watching a few things out there for you:
We Are Watching the BNSF
In a sign of true patriotism, the BNSF rolled out special locomotives to commemorate the United States’ upcoming 250th anniversary.
The Class 1 last week introduced three specially painted locomotives designed to mark the nation’s 250th birthday on July 4.
Painted by Mid-America Car Inc. in Kansas City, Missouri, the locomotives sport red, white and blue colors and an America250 logo. They also are decorated with the words, “We the People,” and “Freedom and Liberty.” The locomotives will travel along BNSF’s 32,500-mile network for special events:
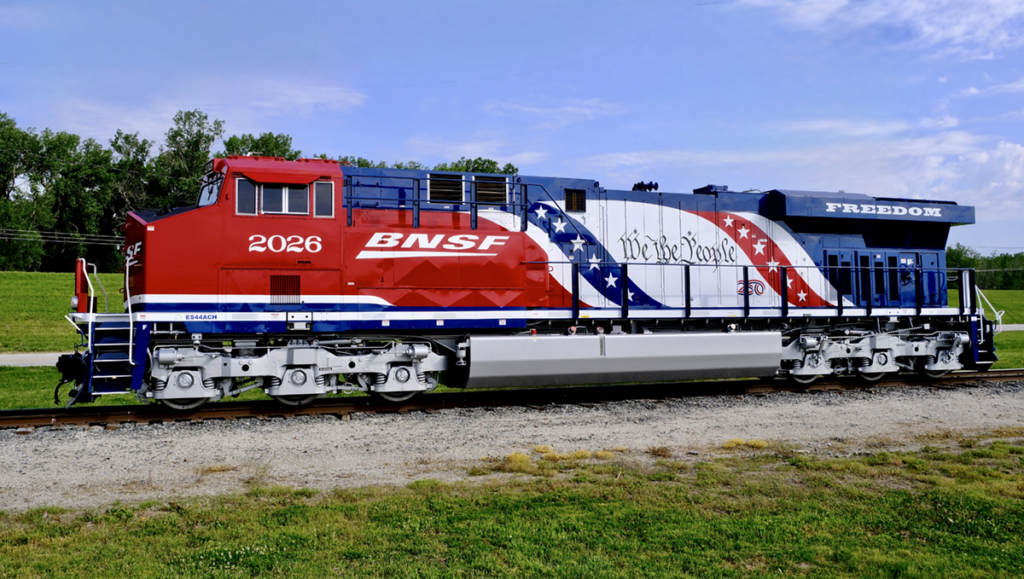
The Class 1’s history dates back to 1849 with the Aurora Branch Railroad in Illinois.
“Few institutions are woven into the fabric of America quite like the railroad, and BNSF is honored to celebrate our nation’s 250th anniversary with these specially painted locomotives,” said BNSF president and CEO Katie Farmer. We like this one, folks – some good news in these unsettled times – Go U.S.A, go!
We Are Watching Petroleum Carloads
The four-week rolling average of petroleum carloads carried on the six largest North American railroads rose to 29,206 from 28,820 which was an increase of +386 rail cars week-over-week. Canadian volumes were mixed. CPKC’s shipments were lower by -3.0% week-over-week, CN’s volumes were higher by +11.0% week-over-week. U.S. shipments were also mix. The CSX had the largest percentage decrease and was down by -7.0%. The NS had the largest percentage increase and was up by +19.0% week-over-week.
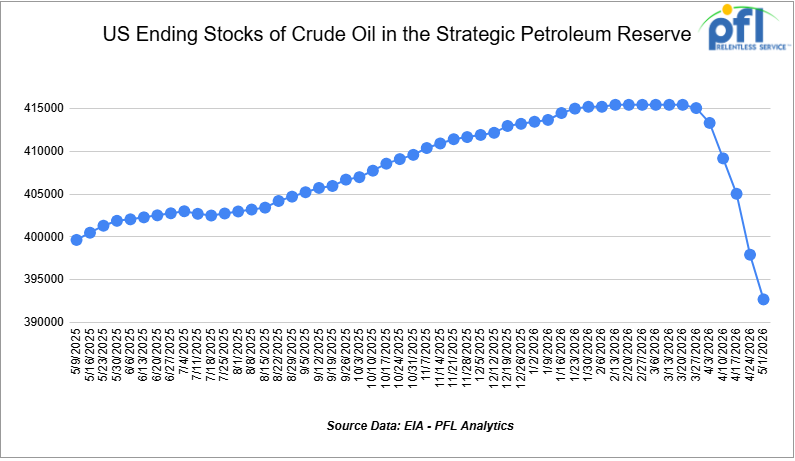
We Continue to Watch Our Strategic Petroleum Reserves
The Trump Administration announced on Monday of last week that it will loan 53.3 million barrels of crude oil from the U.S. Strategic Petroleum Reserve (SPR) to energy companies as part of an international effort to stabilize oil markets disrupted by the U.S.-Israeli war with Iran. Nine companies, including Exxon Mobil, Trafigura, and Marathon Petroleum, accepted about 58% of the 92.5 million barrels the Department of Energy had offered last month.
The DOE has already loaned roughly 80 million barrels this spring and is aiming to release a total of 172 million barrels under a March agreement with more than 30 countries in the International Energy Agency to collectively release around 400 million barrels. The coordinated action is intended to offset supply disruptions and soaring prices caused by Iran’s closure of the Strait of Hormuz, through which about 20% of global oil supply normally passes.
IEA chief Fatih Birol described the conflict as the biggest energy crisis ever and said additional reserve releases remain possible. So far, member countries have released about 20% of available reserves.
Rising fuel prices have become a political concern ahead of the November midterm elections, with U.S. gasoline prices reaching an average of $4.52 per gallon, the highest level since 2022. The DOE said companies will repay the SPR loans in crude oil with premiums of up to 24%, arguing the program stabilizes markets without direct taxpayer cost. The SPR currently holds about 384 million barrels, equal to less than four days of global oil consumption.
We Continue to Watch Hormuz
As previously stated above, WTI closed on Friday of last week at $105.42 per barrel, up 4.4% on the day and roughly 11% on the week, as the Strait of Hormuz remains effectively closed and the latest round of U.S. – Iran negotiations have collapsed. The International Energy Agency’s May Oil Market Report, published on Wednesday of last week, put cumulative supply losses since February at more than 1 billion barrels with 14.4 million barrels per day of Gulf production shut in, and warned the global market will remain “materially undersupplied” through October even if shipping resumes next month.
The U.S. Energy Information Administration confirmed on Wednesday of last week that Hormuz crude and fuel flows fell by nearly 6 million barrels per day in the first quarter. Crude tanker tonne-mile demand in April dropped to the lowest monthly total since November 2020. The Trump administration’s “Project Freedom” tanker escort program has moved a handful of vessels but is not changing the picture. President Trump told reporters last week that the ceasefire is on “massive life support.” On the U.S. side, the gasoline picture is now genuinely tight heading into the summer driving season. Inventories hit a 23-week low at 215.7 million barrels for the week ended May 8, with stocks down 13% since the war started in late February.
Gulf Coast CBOB has averaged $3.43 per gallon so far in May, a $1.40 per gallon jump from pre-war levels and the highest since June 2022. The national retail average hit $4.50 per gallon for the week ended May 11. U.S. gasoline exports surged to 1.05 million barrels per day last week, up 22% on the week and the highest May volume on record going back to 2016, while imports collapsed by 60% to 303,000 barrels per day. Energy Secretary Chris Wright went on Meet the Press on Sunday, May 10th asking refiners to shorten spring maintenance to keep more product moving. Asking, not telling, but a clear signal of how tight the system is.
For the rail thesis, the spreads still do not give us any meaningful crude-by-rail return. WCS Hardisty was $80.52 with WTI Houston at $106.92 on Friday of last week, implying a roughly $26 per barrel differential before transport. The unit train rate from Alberta to the U.S. Gulf Coast is $16.94 per barrel. The math does not yet cross the sustained negative $18 basis hurdle, and even if it did, the structural points have not changed: not many 117J crude cars suitable for crude by rail are available, one-to-two-year build times is the norm, and with leasing companies and car owners demanding five-year lease commitments and with the class ones also echoing similar long term commitments it is a little bit of a hurdle for the producer to overcome. For now PFL’s view is unchanged, crude by rail is not a swing component, but we could be in the beginning of another crude by rail cycle if current trends continue. We are watching this one closely.
We Continue to Watch Left Wing Carney
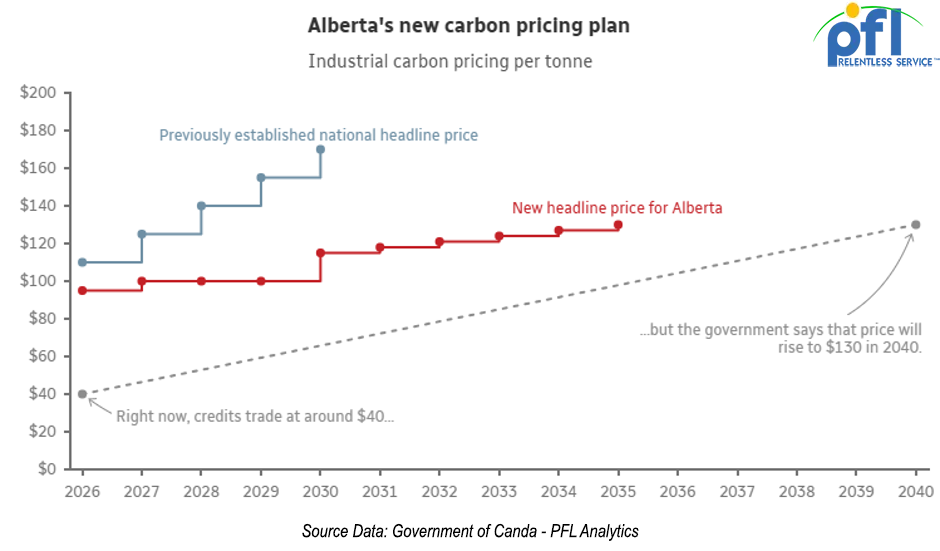
Prime Minister Mark Carney and Alberta Premier Danielle Smith signed an implementation agreement in Calgary on Friday last week that, on paper, advances a West Coast bitumen pipeline of more than 1 million barrels per day. Alberta has committed to submit the project to the federal Major Projects Office by July 1, with Ottawa targeting designation as a “project of national interest” by October 1 and construction potentially starting as early as September 1, 2027. In our opinion, this is not a very good deal for Alberta to sign and we are puzzled by the willingness of the Premier to sign such a one sided deal with the Left wing Prime Minister. Smith has agreed to a phased industrial carbon price of C$100 per tonne from 2027 through 2029, rising to C$140 per tonne by 2040. That is a real concession with a real cost to oil sands operators. What she got in return is a process with deadlines, not a pipeline.
There is no private sector proponent. There is no chosen route. British Columbia Premier David Eby and Energy Minister Adrian Dix went on the record Friday saying Ottawa is “rewarding bad behaviour” tied to the October 19 separation referendum, and that B.C. has $88 billion of shovel-ready projects getting nothing close to the same federal attention. First Nations along the North Coast have already said they will not support any pipeline to tidewater “now or ever.” And the Pathways CCS project that the Oil Sands Alliance has been chasing for years, estimated at C$16.5 billion, was conspicuously absent from Friday’s announcement.
Carney got industrial carbon pricing certainty, an answer to the separation problem brewing in Alberta, and a national political headline. Smith got a process. Even on the optimistic timetable, this pipeline does not start construction for sixteen months and does not move a barrel before the back end of the decade. The egress problem in Alberta is now, not in 2030. The rail rate from Alberta to the U.S. Gulf coast on a unit train moved to $16.94 per barrel for June, up $1.54 on the week, and Trans Mountain ran at 96% capacity in April with chief executive Mark Maki publicly saying Canada needs another pipeline “somewhere.”
PFL has been beating this drum for two years. The Carney government finally moved off the dime but did he, by the time the pipeline gets built we will be over C$100 per MT for the tax alone pushing towards C$130 per MT, the deal Alberta signed Friday looks more like political theater than infrastructure. Smith has put a real carbon price on the table for a pipeline that may never get built. PFL will be watching to see whether a private sector proponent shows up, whether B.C. is brought into the room, and whether the Pathways CCS deal gets done. Until those three things happen, the egress story still belongs to the railroads.
We Continue to Watch BP
Two months into the lockout at BP’s 440,000 barrel per day Whiting refinery, the company and United Steelworkers Local 7-1 agreed on Wednesday of last week to return to the bargaining table , the first formal negotiations since BP locked out more than 800 hourly workers in mid-March.
The union went public Tuesday of last week accusing BP of stalling, saying the company had previously told the local it was “unavailable to meet for nearly two weeks” despite publicly claiming it wanted to bargain. BP has run the refinery on a replacement workforce throughout the lockout, which is now the longest at Whiting since the 101-day work stoppage in 2015. Whiting is the largest refinery in the Midwest and one of the largest single destinations in PADD 2 for Bakken light and Western Canadian heavy, processing close to 280,000 barrels per day of Canadian crude under normal operations.
The refinery continues to run, but every week the dispute increases the probability of an operational incident that pulls capacity offline at the worst possible moment for the Midwest gasoline and diesel markets. With Gulf coast gasoline stocks at 23-week lows and national retail prices at the highest since July 2022, the system has no slack to absorb a Whiting outage. PFL will be watching whether this week’s sessions produce a framework or just another round of recriminations.
We Are Watching the Surface Transportation Board
The procedural calendar on Union Pacific and Norfolk Southern’s amended merger application is closed. Public comments on completeness were due Friday May 8, applicants filed their reply on Tuesday of last week, and the Surface Transportation Board now has to decide whether the revised application meets the regulations to proceed to substantive review. All four remaining Class I railroads filed against the application as incomplete. BNSF, Canadian National, Canadian Pacific Kansas City, and CSX each filed separate comments urging the STB to reject the revised application, in our opinion an extraordinary show of unity among competitors that rarely agree on anything.
BNSF’s May 8th filing called the amended application a set of “cosmetic changes to gloss over the serious and fundamental competition, pricing, and service concerns that were previously raised” and accused UP of “lowballing” projected market shares to the regulator while signaling higher shares to Wall Street. CN said only one of the three deficiencies the Board identified in January has been meaningfully addressed, namely the complete merger agreement, and that the application still omits required market share data and St. Louis terminal control specifics. The Teamsters and the Coalition to Stop the Rail Merger remain in opposition.
UP and NS responded last Tuesday saying the updated application “is comprehensive and complete, and provides all the information” the regulator needs, repeating projections of $3.5 billion in annual shipper savings and 2.1 million truck conversions. The 39% combined market share figure UP cites would put the new entity roughly on par with BNSF, although BNSF disputes the methodology.
The STB’s next move is the completeness ruling. If it accepts the application, a procedural schedule for substantive review follows and the multi-year clock begins in earnest. PFL has been watching this one for a long time. With the entire rest of the Class I universe on record against, the STB may have a path to bounce this back again. Stay tuned to PFL for further updates.
We Are Watching Rail Crime
The U.S. House of Representatives passed the Combating Organized Retail Crime Act on Tuesday of last week by a vote of 348-60, with 206 cosponsors split roughly evenly across both parties. The bill, H.R. 2853, now moves to the Senate. The Association of American Railroads reports 75,000 rail theft incidents in 2025 with losses exceeding $200 million, more than a 50% year-over-year increase off a 2024 figure that was already up 40%. One in ten attempts result in an arrest.
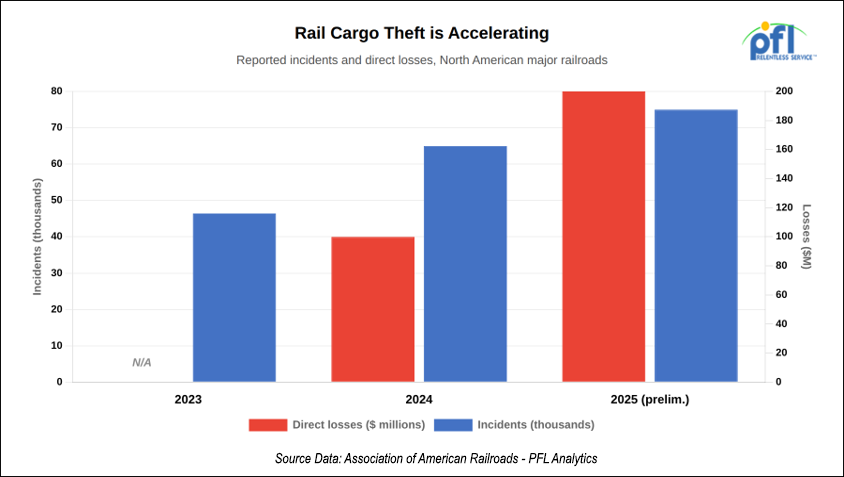
These are not opportunistic crimes. Theft rings are cutting brake lines to stop trains in remote areas, using fraudulent shipping documents to redirect entire loads, and timing strikes around terminal congestion and modal handoffs. The geography is consistent: the Los Angeles to Inland Empire corridor reported more than $1 billion in stolen goods in 2024 alone, with Texas, Arizona, and Chicago’s rail yards as the other persistent hotspots. CargoNet reports strategic theft, the identity-fraud and document variant, has surged 1,500% since 2021.
CORCA puts the Department of Homeland Security in charge of a unified national response, establishes a coordination center inside Homeland Security Investigations, and provides grants and training to frontline law enforcement. The AAR, the Intermodal Association of North America, and the American Trucking Associations all endorsed the bill and are pushing the Senate to move quickly.
Every stolen load is a service failure on top of the insurance and security cost. The bill in the Senate is progress, but it is not law yet, and until it is, the jurisdictional gaps these criminal networks exploit are still wide open. PFL will be watching how quickly the Senate moves.
We Are Watching The Supreme Court
The Supreme Court handed down a unanimous 9-0 decision Thursday in Montgomery v. Caribe Transport II, LLC that every company arranging freight, including the 3PLs and freight forwarders who book the truck legs of intermodal moves, needs to understand. Justice Amy Coney Barrett wrote the opinion, with a concurrence by Justice Kavanaugh joined by Justice Alito. The Seventh Circuit was reversed.
The background: a 2017 Illinois highway accident left Shawn Montgomery without his leg after a Caribe Transport truck, hired by freight broker C.H. Robinson, struck him on the shoulder. Caribe Transport had a “conditional” safety rating from federal regulators when Robinson booked it. Montgomery sued Robinson for negligent hiring. Lower courts threw the case out under the Federal Aviation Administration Authorization Act, which pre-empts state laws related to a broker’s price, route, or service. The Supreme Court held that the FAAAA’s safety exception, which preserves a state’s regulatory authority “with respect to motor vehicles,” saves negligent-hiring claims against brokers from preemption. The federal preemption shield that brokers have used since the Seventh Circuit’s 2023 Ye v. GlobalTranz decision is gone. The ruling is effective immediately in all fifty states.
The opinion is written about brokers because the defendant was a broker, but the logic extends to anyone in the supply chain who selects a carrier and has access to publicly available safety data. 3PLs and freight forwarders arranging the drayage and truck legs of intermodal rail moves now have direct exposure if they book carriers with FMCSA red flags. Pure rail-to-rail interchanges are outside the scope, since the statute targets motor vehicles, but the moment a truck enters the move, the duty of ordinary care in carrier selection attaches. Justice Kavanaugh’s concurrence emphasized that brokers who select reputable carriers should still be able to defeat these cases. Reasonable vetting is the defense.
Plaintiff’s firms have been waiting for this decision for years and have cases ready to file. Insurance costs for brokers and 3PLs without a solid carrier vetting process are going to rise. PFL’s customers who use 3PLs to book the truck portions of their moves should be asking those providers how they document carrier safety reviews. That question is now a real one.
We Are Watching Key Economic Indicators
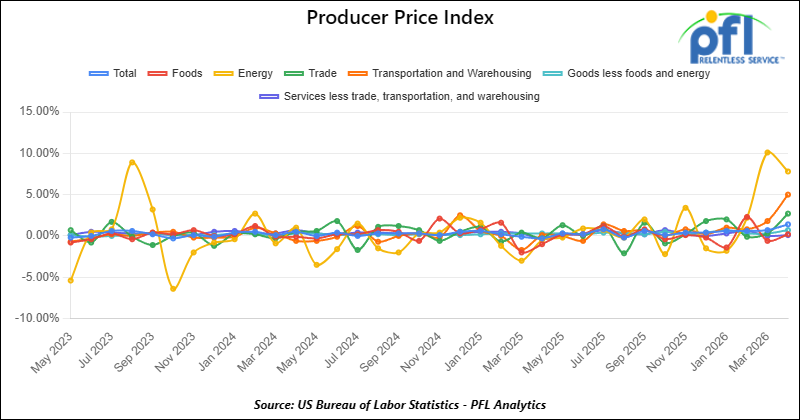
Producer Price Index
In April 2026, the Producer Price Index (PPI) for final demand rose 0.1% month-over-month, slowing further from the 0.2% increase in March and signaling continued moderation in upstream price pressures. Core PPI (final demand less foods, energy, and trade services) increased 0.2% month over month, matching March’s pace. The monthly increase was driven primarily by services, which rose 0.2%, while goods were relatively flat. Within goods, food prices posted modest gains while energy prices declined, and goods less foods and energy increased slightly, indicating stable but subdued core goods inflation. Within services, trade margins softened somewhat, transportation and warehousing were mixed, and services less trade, transportation, and warehousing remained moderate, suggesting broader services inflation continued to cool gradually.
In April 2026, the Consumer Price Index (CPI) increased 0.2% month-over-month, easing from March’s 0.3% gain, and was up approximately 2.6% year over year. Core CPI (all items less food and energy) rose 0.2% month-over-month and was up approximately 2.8% year-over-year. Shelter remained one of the primary contributors to the monthly increase, though its pace continued to moderate. Food prices increased modestly, while energy prices declined, contributing to a softer headline figure compared to the prior month.
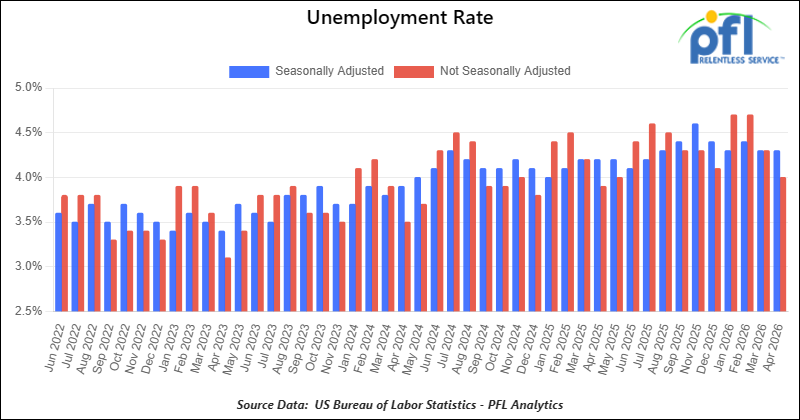
Unemployment Rate
On May 8, 2026, the U.S. Bureau of Labor Statistics reported that total nonfarm payroll employment increased by 162,000 in April 2026, reflecting continued but moderating hiring growth following March’s gain.
According to the BLS, prior months’ payroll figures were revised modestly lower, reinforcing evidence of a gradually cooling labor market. The official unemployment rate remained at 4.3% in April, unchanged from March, suggesting labor market conditions stabilized further despite softer hiring momentum. The good news in the report was the continued decline in government employment and another increase in manufacturing jobs, a trend that we will hopefully see continue.
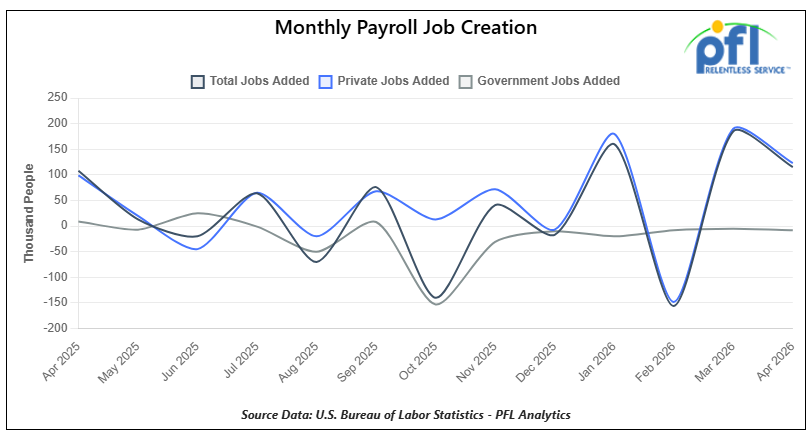
The good news is, government jobs continue to fall and the private sector continues to add jobs on a net basis. Private sector jobs were up 123,000 jobs month over month while the Government sector jobs were down 8,000 jobs month-over-month. Since President Trump effectively took control of the White House in January of 2025 we have seen the addition of 641,000 Private sector jobs and the elimination of 221,000 Government jobs.
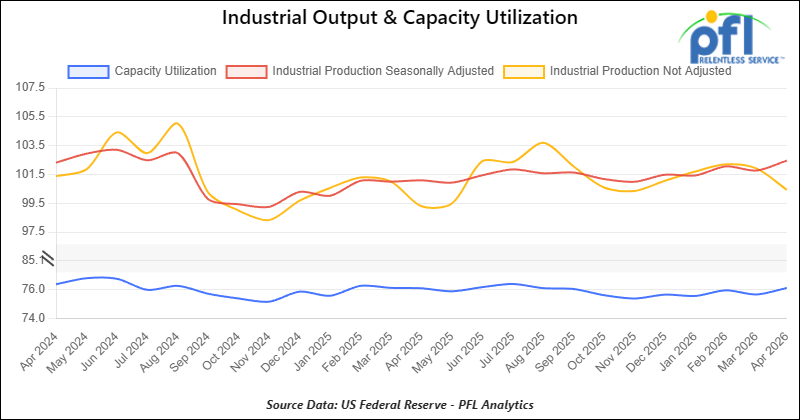
Industrial Output and Capacity Utilization
Manufacturing accounts for approximately 75% of total output. Manufacturing output in April declined 0.2% from March 2026, following a 0.1% decline in March.
Capacity utilization is a measure of how fully firms are using machinery and equipment. Capacity utilization decreased by 0.3% from March in April.
Lease Bids
- 100, 21.9K 117J Tanks located off of All Class 1s in the Midwest. For use in CO2 service. Period: 6 months.
- 30-50, 30K 117J Tanks located off of NS or CSX in the Northeast. For use in C5 service. Period: 1 year.
- 20-50, 4000-5000 Covered Hoppers located off of UP or BNSF in Houston. For use in Urea, Potash, and Ammonium Sulfate service. Period: 6-12 Months.
- 200, 33K Pressure Tanks located off of CSX or NS in Ohio. For use in Propylene service. Period: 18 Months.
- 30-50, 25.5K DOT 111 Tanks located off of All Class 1s in various locations. For use in Asphalt service. Period: 1-3 Years.
- 40, 33K Pressure Tanks located off of UP in Eunice, LA. For use in Propane service. Period: 1 Year.
- 40, 29K DOT 111 Tanks located off of UP or BNSF in the Midwest. For use in Veg Oil service. Period: 5 Year.
- 70, 30K DOT 117 Tanks located off of NS or CSX in Ohio. For use in Diesel service. Period: 3 months.
- 100, 33K Pressure Tanks located off of UP or BNSF in Texas. For use in Propane service. Period: 6 Months.
- 20, DOT 117J Tanks located off of NS, CSX, CN, or CPKC in various locations. For use in C5 service. Period: 1 year. Need gauge rods.
- 50, 30K DOT 117J Tanks located off of CP or CN in Canada. For use in Jet Fuel service. Period: 1 Year.
- 300, 5200CF Covered Hoppers located off of CP or CM in Canada. For use in Petcoke service. Period: 3 Year.
- 10, 30K 117J Tanks located off of BNSF in Canada. For use in Propane or Butane service. Period: 3 Year.
Sales Bids
- 28, 3400CF Covered Hoppers located off of UP or BNSF in Texas. For use in Cement service. Cement Gates needed.
- 20, 17K DOT111 Tanks located off of various class 1s in various locations. For use in corn syrup service.
- 120, Various Open-Top Aluminum Rotary Gondolas located off of various class 1s in various locations. For use in Sulphur service. Built 2004 or later.
- 30, 29K DOT111 Tanks located off of various class 1s in Chicago. For use in Veg Oil service.
Lease Offers
- 21, 6351 Covered Hoppers located off of CN in Wisconsin. Last used in DDG. Available until February 2027.
- 29, 6500 Covered Hoppers located off of CN in Wisconsin. Last used in DDG. Available until February 2027.
- 50, 20K DOT117J Tanks located off of all class 1s in Moving. Last used in styrene.
- 29, 25.5K DOT117J Tanks located off of UP or BNSF in Texas. Cars are currently clean.
- 200, 340W DOT 112J Tanks located off of all class 1s in Multiple Locations. Last used in propane and butane. Cars are currently clean.
- 15, 6200CF Covered Hoppers located off of all class 1s in Wisconsin. Last used in plastic. Cars are currently clean.
- 30, 6500CF Covered Hoppers located off of all class 1s in Wisconsin. Last used in plastic. Cars are currently clean.
- 6, 21K Stainless Steel Tanks located off of UP in Texas / Mexico Border. Last used in surfactant. Cars are currently clean.
- 100, 28.4K DOT 117J Tanks located off of UP or BNSF in Beaumont, TX. Cars are currently clean.
- 50, 30K DOT117J Tanks located off of UP or BNSF in the South. Last used in ethanol.
- 30, 30K DOT 117R Tanks located off of BNSF in Washington. Last used in renewable jet fuel.
- 80, 30K DOT 117R Tanks located off of BNSF in Washington. Last used in renewable diesel.
- 10, 30K DOT 117R Tanks located off of BNSF in Washington. Last used in renewable naphtha.
- 10, 29K DOT 117R Tanks located off of BNSF and UP in Texas. Last used in gasoline additive. Coiled and Insulated.
- 39, 31K CPC1232 Tanks located off of All Class 1s in Iowa. Last used in diesel.
- 99, 31K CPC1232 Tanks located off of BNSF and UP in Texas. Last used in diesel.
- 1, 31K CPC1232 Tanks located off of BNSF and UP in Texas. Last used in naphtha.
- 2, 30K DOT 117R Tanks located off of BNSF and UP in Texas. Last used in giesel.
- 1, 30K DOT 117R Tanks located off of BNSF and UP in Texas. Last used in gas blend stock.
- 3, 30K DOT 117R Tanks located off of BNSF and UP in Texas. Last used in gasoline.
- 36, 31K CPC1232 Tanks located off of CPKC in Texas. Last used in diesel.
- 6, 31K CPC1232 Tanks located off of CPKC in Texas. Last used in naphtha.
Sales Offers
- 81, 31.8K CPC1232 Tanks located off of UP or BNSF in TX. Requal Due in 2025.
- 35, 3400CF Covered Hoppers located off of UP or BNSF in the Midwest. Last used in Sand.
- 25, 30K 117J Tanks located off of CSX in Jackson, TN. Last used in Fuels. Newly Requalified.
Call PFL today to discuss your needs and our availability and market reach. Whether you are looking to lease cars, lease out cars, buy cars, or sell cars call PFL today at 239-390-2885
Live Railcar Markets
| CAT | Type | Capacity | GRL | QTY | LOC | Class | Prev. Use | Offer | Note |
|---|
PFL will be at the Following Conferences

- Where: Loews Arlington Hotel
- Attending: Brian Baker (239.297.4519), David Cohen (954-729-4774), and Curtis Chandler (239-405-3365)
- Conference Website

- Where: The Westin Galleria Dallas
- Attending: David Cohen (954-729-4774), and Curtis Chandler (239-405-3365)
- Conference Website

- Where: The Westin Galleria Dallas
- Attending: Brian Baker (239.297.4519)
- Conference Website