“Keep your face always toward the sunshine and shadows will fall behind you.“
Walt Whitman
COVID 19 and Markets Update
The United States currently has 7,992,932 confirmed COVID 19 cases and 219,706 confirmed deaths.
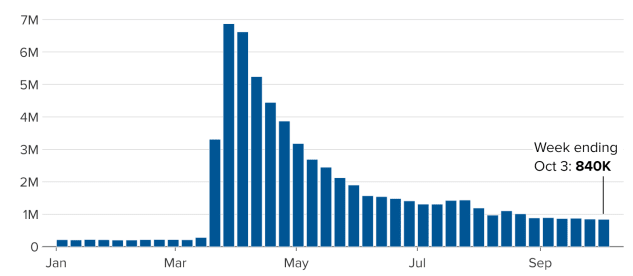
The U.S. Labor Department stated on Thursday of last week that U.S. workers filed an additional 840,000 initial jobless claims. The number of first-time filers for unemployment benefits were higher than expected. Claims have remained above 800,000 week over week since March as companies are slowly hiring. There is still 25.5 million workers collecting some form of benefits.
U.S. Initial Claims for Unemployment Insurance

DOW and NASDAQ
The DOW closed higher on Friday, up 161.39 points (0.57%) to finish out the week at 28,586.90, up 904.09 points week over week. The S&P 500 traded higher 30.30 points (0.88%) on Friday, closing at 3,477.13, up 128.69 points week over week. The Nasdaq finished Friday’s session higher as well, gaining 158.96 points (1.39%) and closing out the week at 11,579.94, up 504.92 points week over week. In overnight trading, DOW futures traded lower and are expected to open down this morning 23 points.
Oil Markets
Oil prices declined on Friday of last week after a significant weekly gain. WTI traded down 59 cents to close at $40.52 a gain of $3.55 (+9.6%) per barrel week over week.
Brent traded down 49 cents on Friday of last week to close at $42.85, a gain of $3.58 (+9.1%) per barrel week over week.
U.S. crude inventories increased by 500K/bbls last week and now stand at 493 MM/bbls, according to the EIA. Consensus was for a build of 294K/bbls. Record crude production was shut in in the gulf totaling 1.7MM/bpd in anticipation of the arrival of Hurricane Delta. Distillate inventories were down by 1.4MM/bbls and Gasoline stocks decreased by 1MM/bbl
Oil is lower in overnight trading and, as of the writing of this report, WTI is poised to open at 40.00, down 60 cents per barrel from Friday’s close.
North American Rail Traffic
Total North American rail volumes were up 1.0% year over year in week 40 (U.S. +0.8%, Canada +6.1%, Mexico -13.9%), resulting in year to date volumes that are down 9.8% (U.S. -10.4%, Canada -7.3%, Mexico -10.7%). 7 of the AAR’s 11 major traffic categories posted year over year increases with the largest increases coming from intermodal (+5.6%), grain (+23.1%) and metallic ores & metals (20.3%). The largest decrease came from coal (-22.3%).
In the East
CSX’s total volumes were down 1.2%, with the largest decrease coming from coal (-22.9%). The largest increase came from intermodal (+5.4%). NS’s total volumes were down 3.5%, with the largest decreases coming from coal (-38.7%) and petroleum (-60.6%). The largest increases came from intermodal (+5.5%) and motor vehicles & parts (+18.2%).
In the West
BN’s total volumes were down 1.3%, with the largest decreases coming from coal (-22.0%), petroleum (-32.0%) and stone sand & gravel (-40.1%). The largest increases came from grain (+53.9%) and intermodal (+4.9%). UP’s total volumes were up 0.3%, with the largest increases coming from intermodal (+7.6%) and grain (+48.8%). The largest decreases came from coal (-25.0%) and petroleum (-38.3%).
In Canada
CN’s total volumes were up 5.6% with the largest increases coming from intermodal (+7.7%) and metallic ores (+58.8%). The largest decrease came from motor vehicles & parts (-20.4%). RTMs were up 5.3%. CP’s total volumes were up 3.0%, with the largest increases coming from farm products (+96.9%) and chemicals (+18.1%). The largest decrease came from petroleum (-38.8%). RTMs were up 11.4%.
Kansas City Southern
KCS’s total volumes were up 6.6%, with the largest increases coming from coal (+76.7%) and intermodal (+6.1%).
Things we are keeping an eye on:
- Intermodal Rail Traffic is roaring back. Folks, U.S. imports of consumer goods are surging. They set an all-time monthly record in August 2020, with China supplying a huge share of them. After stalling in the spring, China’s export machine has come roaring back and now controls 14.6% of the global exports. In a recent article in the New York Times an author noted, China “has grabbed a much larger share of global markets this summer from other manufacturing nations…. The pandemic has also found China better placed than other exporting nations. It is making exactly what the world’s hospitals and housebound family’s needs right now: personal protection gear, home improvement products and lots of consumer electronics.”
A boom in U.S. imports from China and elsewhere in Asia means that some U.S. ports are seeing much higher volumes than they expected a few months ago. At the Port of Los Angeles, for example, August 2020 was the highest-volume month in history. Gene Seroka, the port’s executive director, recently said, “In May [2020] we saw our lowest container volumes in more than a decade. Since then, there has been a significant replenishment of warehouse inventories. Coupled with retailers planning for consumer holiday spending, it has created a surge of imports.” It is our view that the surge will cool in the coming months due to a variety of factors including weakening consumer demand and satisfying the replenishing of business inventory. - We are watching Economic Indicators:
- GDP- On September 30, the Bureau of Economic Analysis (BEA) released its third and final Q2 2020 GDP growth estimate: an annualized -31.4%, a slight change from the second estimate the month before of -31.7%. The most recent GDP estimate from the Federal Reserve Bank indicates that GDP grew 35% in the third quarter of 2020. The BEA’s first official estimate for Q3 GDP will be released October 29.
- Purchasing Managers Index (PMI)- PMI, from the Institute for Supply Management (ISM), is based on a survey of several hundred supply managers at manufacturers throughout the country. The PMI is considered an indicator both of “on-the-ground” conditions as well as near- to medium-term sentiment. The Services PMI (what was formally called the “Non-Manufacturing Index” (or NMI)) is like the PMI, except it tracks services instead of manufacturing. Both surveys track the direction of changes in business activity, rather than the magnitude of business activity. For both, a reading > 50 indicates expansion and < 50 signals contraction. The PMI was 55.4 in September, down from 56.0 in August. It’s been above 50 for four straight months. The overall PMI fell in September largely because its new orders component fell from 67.6 in August (its highest level in more than 15 years) to 60.2 in September (which is still higher than any month in 2019). Of the 18 manufacturing industries in the PMI, 14 reported growth in September, down slightly from 15 in August.
- Consumer Confidence – The Conference Board’s consumer confidence index soared from 86.3 in August to 101.8 in September, the highest it’s been since March 2020. That’s good news, but it’s still well below the average of around 130 in the 18 months prior to the pandemic. Meanwhile, the University of Michigan’s index of consumer sentiment reached 78.9 in September, up from 74.1 in August and also the highest it’s been since March 2020.
- Consumer Spending – Consumer spending has been increasing over the past four months — it rose 1.0% in August — but the pace of growth is slowing. Since consumer spending accounts for approximately 70% of U.S. GDP, that’s a worrying sign for the overall economy.
- Petroleum by Rail –The four-week rolling average of petroleum carried on the largest North American railroads rose to 22,093 compared with 21,963 the prior week. CP shipments fell by 11.8% and CN volumes rose 10.9%. In the U.S. CSX had the largest percentage increase at 12.2% while the NS had the largest percentage loss at -6.4%.
- Railcars in Storage – As of October 1st, the total number of cars in storage continued its downtrend to 451,781 cars, representing a month over month decline of 24,791 cars or -5.2%. The number of cars in storage remains 88,141 cars (24.24%) higher than this time last year. Despite total cars in service decreasing slightly, the percentage of the total fleet in storage declined to 27.12% from 28.57% last month; this is well below the July high of 31.55% of the total fleet in storage, but still higher than 21.71% of the total fleet in storage this time last year. Lastly, looking at pre-pandemic levels, we are still 57,931 cars (14.71%) higher then where we were on March 1st. For more information on railcars in storage please visit PFL’s website and view our latest storage report free online.
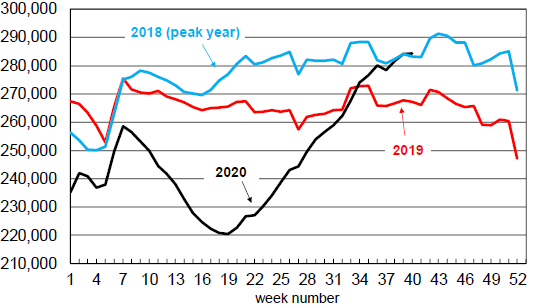
US Rail Intermodal Units (6 Week Moving Average)

Rig Count
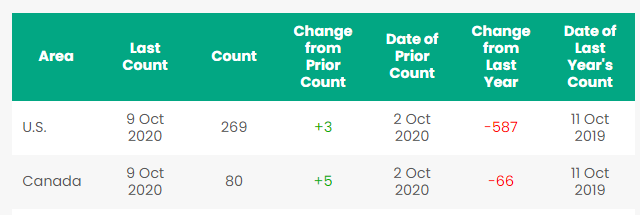
North America rig count is up 8 Rigs week over week. The U.S. gained 3 rigs week over week with 269 active rigs. Canada gained 5 rigs week over week and Canada’s overall rig count is now at 80 active rigs. Year over year we are down 655 rigs collectively.
North American Rig Count Summary

We have been extremely busy at PFL with return on lease programs involving rail car storage instead of returning cars to a shop. A quick turnaround is what we all want and need. Railcar storage in general has been extremely active. Please call PFL now at 239-390-2885 if you are looking for rail car storage, want to trouble shoot a return on lease scenario or have storage availability. Whether you are a car owner, lessor or lessee or even a class 1 that wants to help out a customer we are here to “help you help your customer!”
Railcar Markets
PFL is seeking:
- 2 Covered hoppers for purchase 5500 series, for storage at plant site in the Chicago area, BN or NS connection,
- 20 117R’s 30,000 gallon cars needed for alcohol service cars have to be non -lined
- 340W’s LPG pressure cars for various locations and lease terms,
- 17 30.3 gal for lease in New Mexico 1 year crude
- 5-15 6000+ high sided gons, no interior bracing for purchase off the CN or CP Ontario destination,
- 200 117Rs 30K plus Diesel or Gas Houston dirty – negotiable
- 100 CPC 1232 31.8 prior gasoline service for 3-6 month lease (extendable with mutual agreement) in Texas.
- 100 4750’s for grain service in the Midwest, one year lease,
- 50-90 263 or 286 GRL needed for corn syrup for purchase,
- 50-60 Sulfuric acid cars 13.6 for purchase,
- 40-50 molten Sulfur Cars 13.8 for purchase,
- 100 coal gons for lease
- 15 500W tanks for CO2 use for lease 6-12 months
- 10 20K to 23.5 coiled and insulated for lease one year for ethylene glycol,
- 100 1232 tanks for crude 8 month lease in Edmonton CA
- 10 23-25.5 for glycerin 6-12 months UP or CN MO to WY
- 200 1232 25.5K Gal Texas UP BN 2 years fuel oil
- 19 117R 28.3 Gal Texas Class One Open 2-5 years Diesel
- 6 31.8 Gal tanks Ohio 3-5 years Noneno
PFL is offering:
- Various tank cars for lease with dirty to dirty service including, nitric acid, gasoline, diesel, crude oil, Lease terms negotiable,
- 60 340W Pressure cars in VA – last Ammonia dirty 12-18 mos NS or CSX
- 50 CPC 1232 cars in Texas clean last petroleum lease negotiable
- 10-20 340W pressure cars in Miss. – last butane – dirty lease negotiable
- Short and long term opportunities available clean cars are available 1-5 years scattered across the country. Various last commodities. Leases on 117Js and 117Rs, dirty to dirty for sublease,
- 450 117Js 28.3 C/I for sale or lease in Texas
- 200 CPC 1232 Compliant 25.5’s C/I for sale or lease
- 100 65 ft. bulkhead flat cars, for sale or lease
- 200 30K tankers cleaned and ready for service, for sale or lease,
- 100 5650 PD hoppers brand new 65 ft, lease only, available in 30 days,
- 218 73 ft 286 GRL riserless deck, center part for sale,
- 28 auto-max II automobile carrier racks – tri-level for sale,
- 100 65’ 100 ton log cars for lease, various locations,
- 10 food grade 14.3 tanks lined for phosphoric acid for sale in Louisiana,
- 49 60’ Box cars 286 EOL refurbished in Tenn.,
- 132 286 GRL DOT111s coiled and insulated 29K Gal for sale
- 20 low sided gondolas for lease in NJ 2743 cu ft,
- 100 34.2 Gallon Dot 111 for lease great for Ethanol or Alcohol
- 20 food grade stainless steel cars
- 30 340W dirty propane or butane west coast negotiable
- 50-80 117J or Rs 28K BN, UP, CN, Diesel dirty multiple locations negotiable
- 100 CPC1232 28.3 gal in Montana crude dirty BNSF negotiable
- 30 111A 30K clean Texas BNSF last ethanol negotiable
- 30 CPC 1232 25.5K Pennsylvania NS clean negotiable
- 10 CPC 1232 23.5 K W Michigan Calcium Chloride dirty negotiable
- 175 117R s or Js 30K Diesel or gasoline dirty to dirty Texas lease negotiable
- 50 300 series Pressure cars
- 100 CPC1232 28K Crude dirty to dirty CN Alberta lease negotiable
- 40 GP 20K in Southeast CSX clean last soap negotiable
- PFL has a number of steel and aluminum hoppers for various commodities for sale,
- Sand cars, box cars, coal cars and hoppers including sugar covered hoppers and plastic pellet cars, are also available for sale or lease in various locations.
Call PFL today to discuss your needs and our availability and market reach. Whether you are looking to lease cars, lease out cars, buy cars or sell cars call PFL today 239-390-2885
PFL offers turn-key solutions to maximize your profitability. Our goal is to provide a win/win scenario for all and we can handle virtually all of your railcar needs. Whether it’s loaded storage, empty storage, subleasing or leasing excess cars, filling orders for cars wanted, mobile railcar cleaning, blasting, mobile railcar repair, or scrapping at strategic partner sites, PFL will do its best to assist you. PFL also assists fleets and lessors with leases and sales and offer Total Fleet Evaluation Services. We will analyze your current leases, storage, and company objectives to draw up a plan of action. We will save Lessor and Lessee the headache and aggravation of navigating through this rapidly changing landscape.
PFL IS READY TO CLEAN CARS TODAY ON A MOBILE BASIS. WE ARE CURRENTLY IN EAST TEXAS
Live Railcar Markets
| CAT | Type | Capacity | GRL | QTY | LOC | Class | Prev. Use | Clean | Offer | Note |
|---|
