
“Difference will always exist, but division doesn’t always have to result” – Beth Moore
Jobs Update
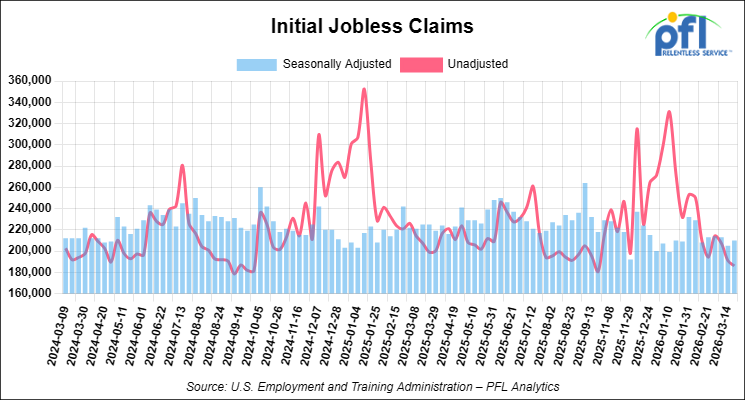
- Initial jobless claims seasonally adjusted for the week ending March 21, 2026 came in at 210,000, versus the adjusted number of 205,000 people from the week prior, up 5,000 people week over week.
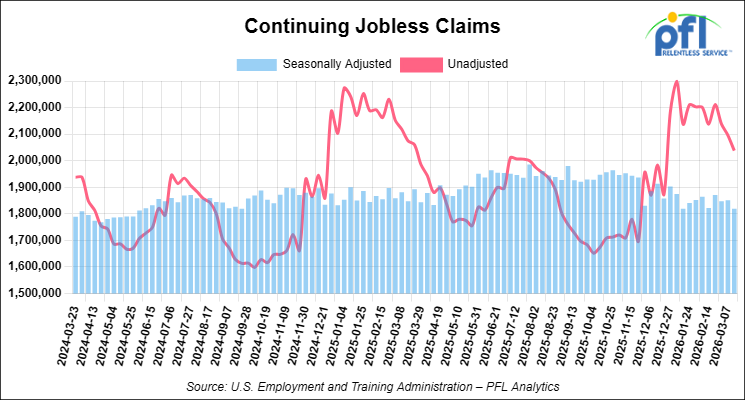
- Continuing jobless claims came in at 1,819,000, versus the adjusted number of 1,851,000 people from the week prior, down 32,000 week-over-week.
Stocks closed lower on Friday of last week and lower week-over-week
The DOW closed lower on Friday of last week, down -793.47 points (-1.73%), closing out the week at 45,166.64, down -410.83 points week-over-week. The S&P 500 closed lower on Friday of last week, down -108.31 points (-1.67%), and closed out the week at 6,368.85, down -137.63 points week-over-week. The NASDAQ closed lower on Friday of last week, down -459.72 points (-2.15%), and closed out the week at 20,948.36, down -699.25 points week-over-week.
In overnight trading, DOW futures traded higher and are expected to open at 45,584 this morning, up 160 points from Friday’s close.
Crude oil closed higher on Friday of last week and higher week-over-week
West Texas Intermediate (WTI) crude closed up 5.16 per barrel (5.5%), to close at $99.64 on Friday of last week, and up $1.32 week-over-week. Brent crude closed up 4.56 per barrel (4.2%), to close at $112.57, and up $0.38 week-over-week.
One Exchange WCS (Western Canadian Select) for May delivery settled on Friday of last week at US$11.50 below the WTI-CMA (West Texas Intermediate – Calendar Month Average). The implied value was US$88.14 per barrel.
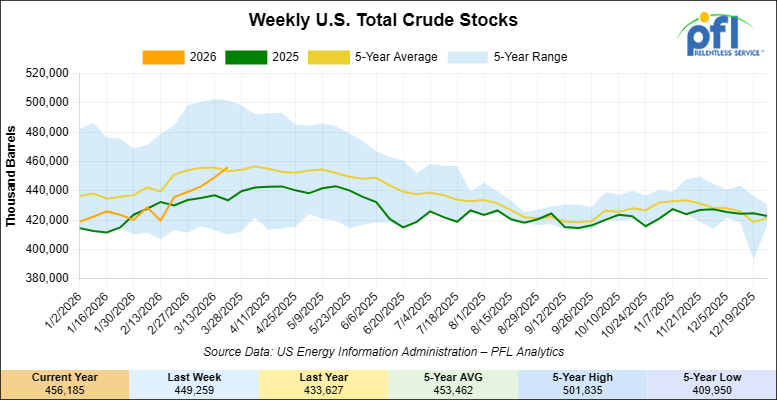
U.S. commercial crude oil inventories (excluding those in the Strategic Petroleum Reserve) increased by 6.9 million barrels week-over-week. At 456.2 million barrels, U.S. crude oil inventories are 0.1% above the five-year average for this time of year.
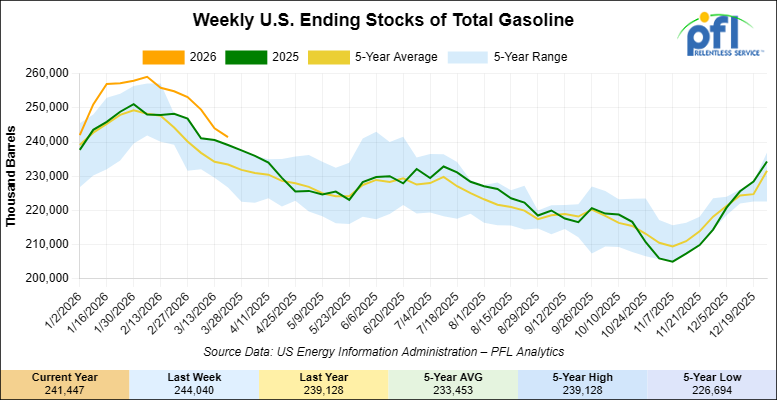
Total motor gasoline inventories decreased by 2.6 million barrels week-over-week and are 3% above the five-year average for this time of year.
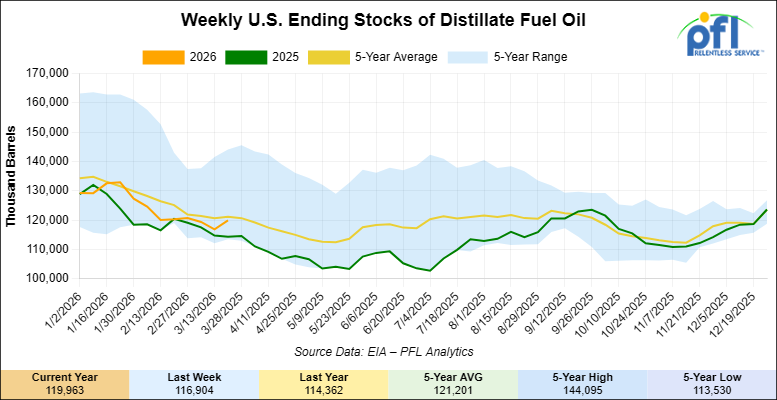
Distillate fuel inventories increased by 3 million barrels week-over-week and are about 0.4% below the five-year average for this time of year.
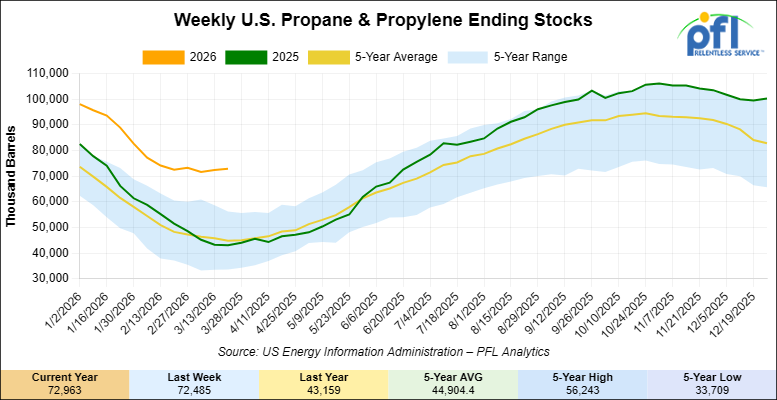
Propane/propylene inventories increased by 500,000 barrels week-over-week and are 59% above the five-year average for this time of year.
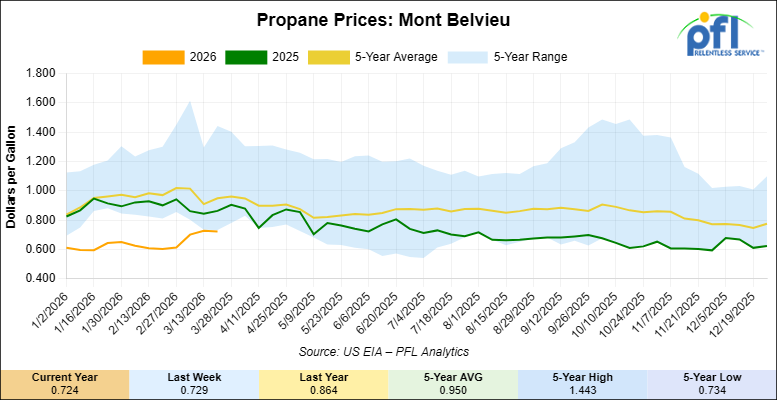
Propane prices closed at 72.4 cents per gallon on Friday of last week, down 0.5 cents per gallon week-over-week, and down 14 cents year-over-year.
Overall, total commercial petroleum inventories increased by 8.3 million barrels week-over-week, during the week ending March 20, 2026.
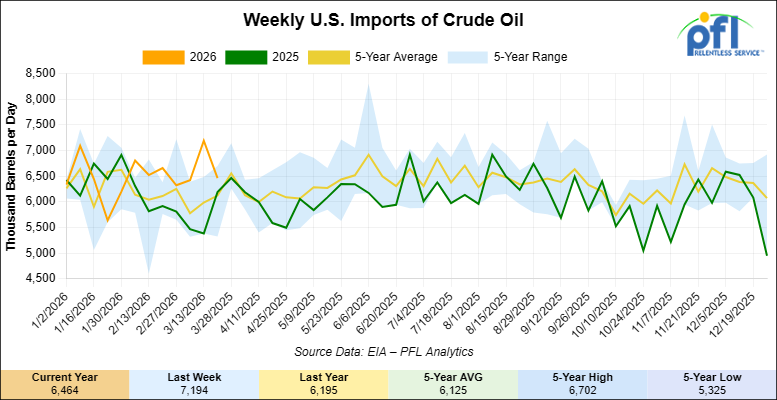
U.S. crude oil imports averaged 6.5 million barrels per day during the week ending March 20, 2026, a decrease of 730,000 barrels per day week-over-week. Over the past four weeks, crude oil imports averaged 6.6 million barrels per day, 15.5% more than the same four-week period last year. Total motor gasoline imports (including both finished gasoline and gasoline blending components) averaged 443,000 barrels per day, and distillate fuel imports averaged 155,000 barrels per day during the week ending March 20 2026.
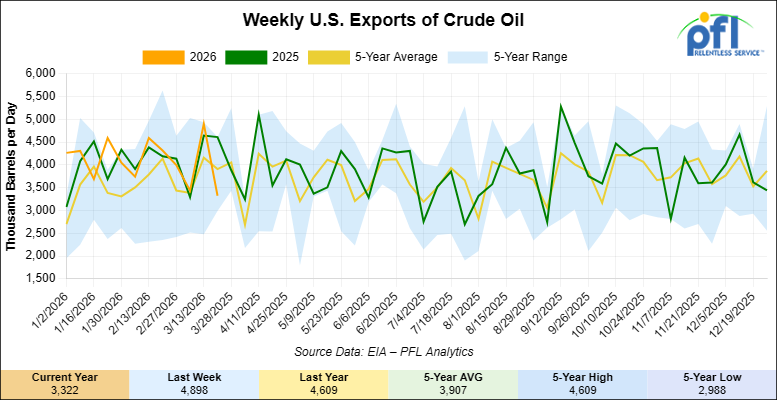
U.S. crude oil exports averaged 3.322 million barrels per day during the week ending March 20, 2026, a decrease of 1.576 million barrels per day week-over-week. Over the past four weeks, crude oil exports averaged 3.913 million barrels per day.
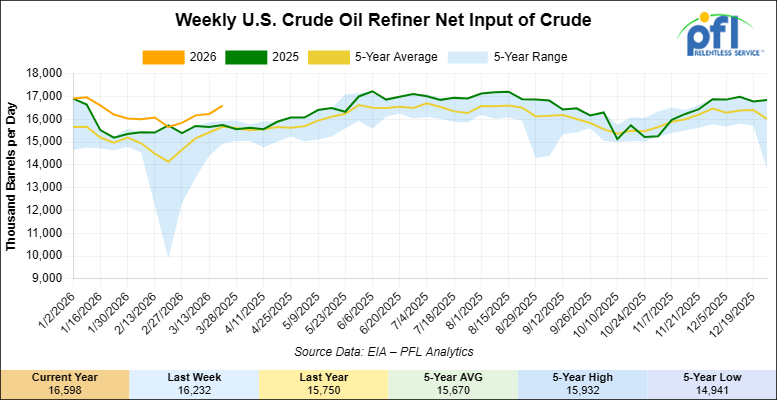
U.S. crude oil refinery inputs averaged 16.6 million barrels per day during the week ending March 20, 2026, which was 366,000 barrels per day more week-over-week.
WTI is poised to open at $101.61 this morning, up $1.97 from Friday’s close.
North American Rail Traffic
Week Ending March 25, 2026:
Total North American weekly rail volumes were down (-0.74%) in week 13, compared with the same week last year. Total Carloads for the week ending March 25, 2026 were 334,409, up (+1.14%) compared with the same week in 2025, while weekly Intermodal volume was 328,970, down (-2.58%) year over year. 7 of the AAR’s 11 major traffic categories posted year-over-year increases. The largest decrease came from Forest Products (-24.62%). The largest increase was Other (+7.11%).
In the East, CSX’s total volumes were up (+4.70%), with the largest decrease coming from Metallic Ores and Metals (-22.99%), while the largest increase came from Farm Products (+12.65%). NS’s total volumes were down (-0.22%), with the largest increase coming from Petroleum & Petroleum Products (+31.86%), while the largest decrease came from Forest Products (-21.51%).
In the West, BNSF’s total volumes were up (+2.41%), with the largest increase coming from Other (+27.80%), while the largest decrease came from Forest Products (-7.82%). UP’s total volumes were down (-2.24%), with the largest increase coming from Coal (+15.82%), while the largest decrease came from Intermodal Units (-10.42%).
In Canada, CN’s total volumes were down (-1.59%), with the largest increase coming from Petroleum & Petroleum Products (+26.31%), while the largest decrease came from Forest Products (-22.43%). CPKCS’s total volumes were down (-25.99%), with the largest increase coming from Coal (+17.27%), while the largest decrease came from Forest Products (-69.69%).
Source Data: AAR – PFL Analytics
North American Rig Count Summary
Rig Count
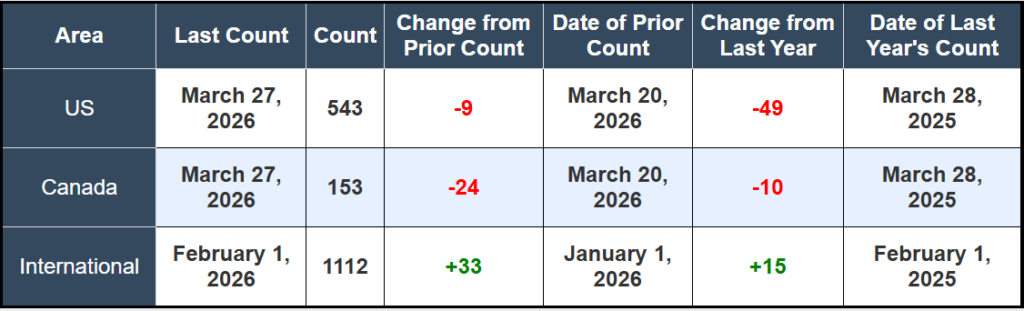
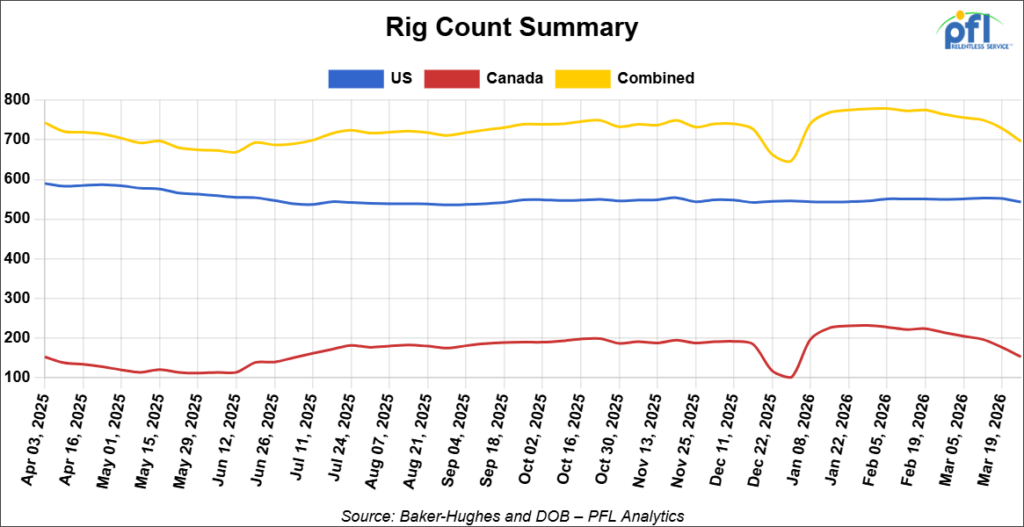
North American rig count was down by -33 rigs week-over-week. The U.S. rig count was down by -9 rigs week-over-week, and down by -49 rigs year-over-year. The U.S. currently has 543 active rigs. Canada’s rig count was down by -24 rigs week-over-week and down by -10 rigs year-over-year. Canada currently has 153 active rigs. Overall, year-over-year we are down by -59 rigs collectively.
We are watching a few things out there for you:
PFL is watching the STB
On Thursday of last week, the Surface Transportation Board unanimously voted to overhaul its environmental review process for rail infrastructure, the first update since 1991. Public comments are due April 24, 2026.
The biggest change for shippers: connecting track along existing rights-of-way would be categorically excluded from environmental review. New loading spurs, terminal connections, and crude-by-rail access points that currently require lengthy approvals get a direct path to construction.
For shippers in the Permian, Bakken, and Eagle Ford, faster infrastructure approvals mean more options to move product, more carrier competition, and a stronger negotiating position.
Where environmental assessments are still required, the rule imposes shorter timelines and page limits, reducing the time and cost of bringing rail infrastructure online.
This builds on the STB’s January 2026 proposal to repeal restrictions on reciprocal switching, which would expand competitive rail access for shippers currently served by a single carrier. Together, the two proposals represent the most significant shift in freight rail policy in a generation.
The comment deadline is April 24, 2026. If new rail access is part of your business plan, now is the time to engage.
We are Watching Petroleum Carloads
The four-week rolling average of petroleum carloads carried on the six largest North American railroads fell to 29,853 from 29,988 which was a decrease of -135 rail cars week-over-week. Canadian volumes were mixed. CN’s shipments were lower by -2% week-over-week, CPKC’s volumes were higher by +5.0% week-over-week. U.S. shipments were also mixed. The NS had the largest percentage decrease and was down by -7.0%. The UP had the largest percentage increase and was up by +8.0% week-over-week.
We are Watching Canadian Crude Oil Exports by Rail
The Canadian Energy regulator reported on March 20, 2026, that 82,183 barrels were exported during the month of January 2026, up from 81,189 barrels in December of 2025, an increase of 994 barrels per day month-over-month.
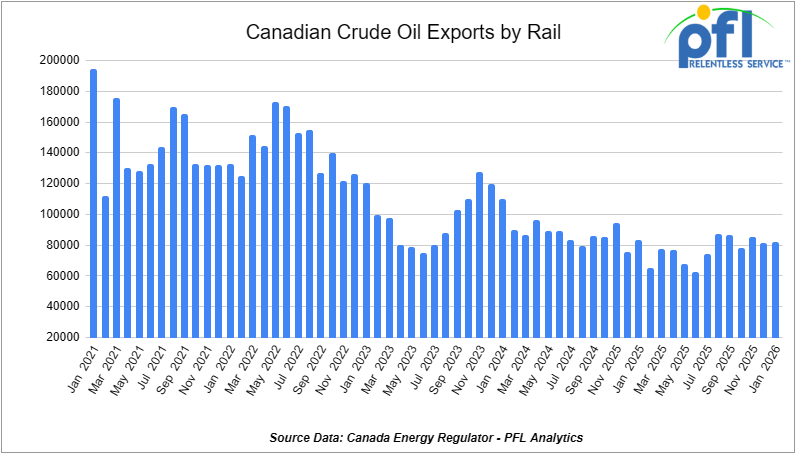
Crude by rail will always be necessary out of Canada for stranded oil not connected by pipelines. Raw bitumen, which is shipped as a non-haz product and is not able to flow in pipelines, is competitive with pipeline tolls and is a growing market to keep an eye on, particularly in light of Strathcona and Gibson announcing new projects. Other factors would be existing long-term contractual commitments and basis – we really need to see basis WTI-CMA (West Texas Intermediate – Calendar Month Average) blowout to -18 per barrel for sustained periods of time to make economic sense. Current rail rates from Alberta to the U.S. Gulf Coast have averaged $15.36 per barrel, making rail competitive whenever WCS-WTI spreads exceed $18 per barrel, including quality adjustments. However, with Oil closing near $100 per barrel on Friday of last week it does not matter for the Canadian producer at this point – what this tells us that there are simply not enough railcars out there to load crude into or readily available loading capacity.
We Continue to Watch Iran
The Strait of Hormuz now has a fee schedule. Iran’s Islamic Revolutionary Guard Corps has formalized what shipping analysts are calling the “Tehran toll booth,” a vetting and payment system that ships must submit to before receiving IRGC clearance to transit the waterway. Vessels are paying up to $2 million per passage through a narrow Iranian-controlled corridor. Before the U.S.-Israel strikes began on February 28, more than 110 ships transited the strait daily; last week that number was fewer than 10.
Iran’s parliament introduced legislation last week to codify the toll structure, treating the strait as an Iranian corridor for which the world pays passage rather than a shared international waterway. This is not a blockade that ends with a ceasefire handshake. It is a structural claim on the world’s most important oil shipping lane.
WTI at Houston settled at $99.64/bl on Friday of last week, and Western Canadian Select at Hardisty finished the week at $88.14/bl. The WCS discount to the calendar month average WTI narrowed to approximately $11.50/bl, its tightest level since October, as Asian refiners bid aggressively for heavy Canadian crude to replace lost Middle East supply. Chicago WCS refining margins have averaged $41.21/bl since the strikes began on February 28, nearly double the prior-year average. Canadian grades are now among the most competitively priced spot crudes moving into China.
President Trump announced a 15-point peace proposal and gave Iran a 10-day extension while pausing strikes on Iran’s energy infrastructure through April 6. The market shrugged. The IRGC turned back three container ships including COSCO-linked vessels attempting to transit the approved corridor, then reiterated the strait is closed. Trump called Iran’s limited vessel passage last week a “present.” Eight boats in a week is not a present; it is a reminder of who holds the keys.
We are Watching Left Wing Canadian Prime Minister Carney
Here are the facts, folks: The Enbridge Mainline was apportioned nine months of 2025 and enters this crisis period fully loaded. Transmountain does have some spare capacity – rail seems to be another way to get barrels out of Canada, but is not happening due to the lack of readily available rail cars or the lack of loading capacity. Our guess is that shippers are reluctant to commit to long term leases (that leasing companies and car owners want) for what may be a short-term arbitrage opportunity and then there is the class 1’s (CN and CP) they want a long-term commitment from shippers as well.
TC Energy CEO François Poirier made a point at CERAWeek in Houston last week which is worth sharing with our readers: The U.S. produces roughly 120 percent of its annual energy needs. Canada produces approximately 185 percent of its. Japan produces around 10 percent, and most of Europe is in similar territory. Those three numbers explain almost everything about who is sweating the Hormuz closure and who is not.
The countries scrambling hardest for alternative crude supply right now — Japan, South Korea, India, much of Europe — are structurally dependent on Middle East flows in a way that North America simply is not. That dependency does not disappear when a crisis ends. It shapes long-term procurement strategy, and the lesson being absorbed in Tokyo and Seoul last week is that a supply chain running through a single Iranian-controlled chokepoint is not a supply chain, it is a vulnerability.
The irony for Canada is considerable. The country sitting on the world’s fourth-largest oil reserves and producing nearly twice its own energy needs yet cannot get its crude to tidewater in meaningful new volumes because it cannot permit a pipeline. The buyers who want Canadian crude most desperately right now — Asian refiners paying premium prices for WCS as a Hormuz alternative — are being served through a Trans Mountain system that has not settled its toll structure two years after opening a proposed west coast expansion that has no builder. Canada is energy rich and infrastructure poor, and the gap between those two facts is a policy failure that no amount of CERAWeek speechmaking corrects.
In other Carney news – Prime Minister Mark Carney’s April 1st pipeline deliverables are not going to be delivered in a deal that he had with the Alberta Government. Speaking in Houston at CERAWeek, Alberta Premier Danielle Smith acknowledged the first set of MOU deadlines tied to the west coast pipeline agreement will be missed, saying she did not want to delay “very long” but was working toward the timeframe. No private builder has stepped forward for the project. Alberta is still evaluating five potential B.C. port sites. TC Energy CEO Francois Poirier, told anyone who would listen that Ottawa’s two-year approval timeline is not competitive in a world of rising energy demand and that industry needs six months, not twenty-four. The Major Projects Office that Ottawa set up in Calgary is six months old and has approved nothing of significance.
While Ottawa talks about a west coast pipeline it cannot build, the market has voted with its feet. Enbridge EVP Colin Gruending at CERAWeek laid out the sequencing bluntly: south first, where there is a ready market and existing corridors, then a west coast project later, maybe. Premier Smith told the same audience that Americans will get first access to new Alberta volumes and that she has seen roughly 2.5 million barrels per day worth of southbound pipeline proposals. That is not a diversification strategy. It is an acknowledgment of where the pipes that actually get built tend to go.
Trans Mountain is not helping the west coast narrative either. Nearly two years after the TMX expansion entered service, final tolls have still not been set because of a dispute over billions of dollars in cost overruns that shippers refuse to absorb. Last week Trans Mountain asked the Canada Energy Regulator for another three-month extension to July 11 to keep negotiating with shippers. A federally owned pipeline cannot settle its own pricing two years after opening. A west coast pipeline with no builder, no confirmed route, missed first-month deadlines, and a regulatory agency that has yet to approve anything is not an energy policy for a country sitting on the world’s fourth-largest oil reserves during a global supply crisis.
PFL will keep watching, and so should Mark Carney, his left-wing green policies are now not only affecting the Canadian economy and its people but affecting world stability. This is his moment to shine and he is missing it.
We are watching BP
The BP Whiting lockout moved from threat to reality. More than 800 United Steelworkers Local 7-1 members have been on the picket line since March 19 outside the largest inland refinery in the United States, while BP runs the 440,000 barrel-per-day facility with a contingency team that logged more than 80,000 hours of training in preparation. Whiting is the dominant Midwest outlet for Western Canadian heavy crude, including WCS delivered by rail.
With Chicago WCS refining margins running at nearly double year-ago levels, BP has every financial reason to keep throughput intact. Whether the contingency team can actually sustain that rate is the open question heading into week three. BP’s March 17 proposal includes eliminating roughly 100 union positions, wage cuts across nearly all classifications, and a six-year agreement that would remove Whiting from national pattern bargaining. The union rejected the earlier offer 98.3%. The question is no longer whether a replacement team can start the refinery. It is whether that team can sustain 440,000 barrels per day, week after week, without the experienced union workforce.
PFL is monitoring the situation closely and can work with shippers managing exposure in that corridor.
We Are Watching Ethanol
The Ethanol market had a busy week on two fronts. The EPA on Wednesday of last week issued an emergency E15 waiver authorizing year-round sales of 15 percent ethanol blends from May 1 through May 20, with the agency signaling it is prepared to extend if supply conditions warrant. The agency simultaneously removed federal impediments to E10 and suspended enforcement of certain state-level fuel requirements that had been restricting blending volumes. Rail-delivered ethanol in Chicago was up week over week, strengthening as blending demand pulled ahead of the regulatory changes.
Then on Friday of last week the EPA finalized the Renewable Fuel Standard “Set 2” rule, setting conventional biofuel blending mandates at 15 billion gallons for both 2026 and 2027, the highest in the program’s twenty-year history. Biomass-based diesel volumes were set at 9.07 billion gallons in 2026, rising to 9.2 billion gallons in 2027. The EPA estimates that biodiesel and renewable diesel production will need to jump by more than 60 percent versus 2025 volumes, a year when production had already fallen by a third from 2024 levels. The rule also reallocates 70 percent of renewable fuel volumes lost to small refinery exemptions from 2023 through 2025, restoring roughly 2.03 billion gallons of previously lost demand.
Colonial Pipeline complicated the picture on Friday by announcing it will maintain its existing Reid Vapor Pressure fuel standards regardless of the E15 waiver, which limits how quickly incremental ethanol volumes flow through that corridor. Even so, the overall picture for ethanol demand is as constructive as it has been in years. Ethanol moves almost entirely by rail, and a 60-plus percent increase in biomass-based diesel volumes on top of an emergency summer waiver and the highest-ever blending mandate is a sustained tailwind for tank car demand, not a one-week event. Shippers looking to structure ethanol car commitments around this new mandate environment should be talking to PFL.
We are Watching Targa
Targa Resources’ Galena Park LPG export terminal on the Houston Ship Channel returned to near-normal operations last week after compressor failures forced a force majeure declaration on March 18. Loading volumes recovered to an estimated 493,000 barrels per day, up from just 233,000 the week before. The recovery is real, but the details of how it happened tell a more interesting story: the compressor failures primarily affected propane, and Targa has been shifting customers to butane loads while repairs continue.
That substitution reflects where the NGL market is right now. Butane has surged on international demand as buyers across Asia scramble for U.S. supply to replace Middle East cargoes that cannot move through the strait. India, which normally sources roughly 90 percent of its LPG’s from the Mideast Gulf, is on track to receive record volumes of U.S. LPG’s in March. Propane, by contrast, is drowning in domestic supply, sitting approximately 59 percent above the five-year seasonal average. Butane and propane, which normally move in tandem, are printing entirely different price charts this month, and the spread between them has blown out to levels not seen in years.
The Conway-to-Mont Belvieu butane spread has widened as Gulf coast prices outpaced midcontinent gains, creating arbitrage that moves product south via rail from Kansas and Oklahoma to fractionation and export terminals. PFL works with operators in this space and can help structure the pressurized car capacity needed to move incremental volumes.
We are watching Fertilizer
Corn Belt farmers are heading into the spring application window with fertilizer costs at levels not seen since 2022. Nitrogen is up because natural gas, the primary feedstock for ammonia and urea, has been rising throughout the Iran conflict. Phosphate remains constrained by Chinese export restrictions that have cut global supply by more than half since 2021. Potash is running approximately 21 percent above year-ago levels, with U.S. buyers caught between a 10 percent import tariff on Canadian product and no realistic alternative source.
The Fertilizer Transparency Act was introduced in the Senate last week week by Amy Klobuchar and John Thune, requiring domestic and foreign manufacturers and wholesalers to report prices and volumes weekly to USDA for public disclosure. The bipartisan bill is a direct response to the pricing that hits farmers hardest during supply shocks. Spring application is compressed into a matter of weeks, delays cost yield, and the demand for on-time delivery of ammonia and liquid nitrogen fertilizer by rail is at its seasonal peak right now.
The new RFS mandate adds a wrinkle to acreage decisions. Elevated fertilizer costs are squeezing corn margins at the same moment a record biodiesel mandate is creating a strong incentive to plant soybeans. Some corn-to-soy acre shifts this spring look likely, which would trim nitrogen demand but add soybean oil supply right when the biomass-based diesel market needs more feedstock. PFL works with shippers moving ammonia and UAN solution and can help structure car capacity around the peak window.
We are Watching Key Economic Indicators
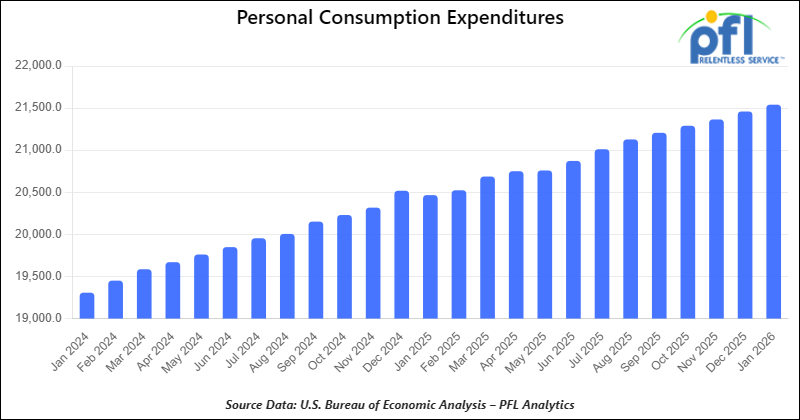
Consumer Spending
In January 2026, total consumer spending continued to expand, with personal consumption expenditures (PCE) rising 0.2 percent from December 2025, reflecting more moderate but still positive household demand to start the year. Current-dollar PCE increased by approximately $53.0 billion, driven by a continued rise in services outlays that more than offset a modest decline in goods spending. Real (inflation-adjusted) PCE was flat (0.0%) in January.
The personal saving rate increased to approximately 3.8 percent in January, ticking up from December levels as income growth slightly outpaced spending early in the year.
On inflation, the PCE price index — the Federal Reserve’s preferred inflation gauge — rose 0.3 percent month-over-month in January and 2.6 percent year-over-year, showing some easing from late-2025 readings. Excluding food and energy, the core PCE price index rose 0.3 percent month-over-month and 2.8 percent year-over-year, indicating underlying inflation remains above the Fed’s long-run 2% target, but is gradually moderating.
Lease Bids
- 100, 21.9K 117J Tanks located off of All Class 1s in Midwest. For use in CO2 service. Period: 6 months.
- 30-50, 30K 117J Tanks located off of NS or CSX in Northeast. For use in C5 service. Period: 1 year.
- 20-50, 4000-5000 Covered Hoppers located off of UP or BN in Houston. For use in Urea, Potash, Ammonium Sulfate service. Period: 6-12 Months.
- 200, 33K Pressure Tanks located off of CSX or NS in Ohio. For use in Propylene service. Period: 18 Months.
- 30-50, 25.5K DOT 111 Tanks located off of All Class 1s in Anywhere. For use in Asphalt service. Period: 1-3 Years.
- 40, 33K Pressure Tanks located off of UP in Eunice, LA. For use in Propane service. Period: 1 Year.
- 40, 29K DOT 111 Tanks located off of UP or BN in Midwest. For use in Veg Oil service. Period: 5 Year.
Sales Bids
- 28, 3400CF Covered Hoppers located off of UP BN in Texas. For use in Cement service. Cement Gates needed.
- 20, 17K DOT111 Tanks located off of various class 1s in various locations. For use in corn syrup service.
- 120, Various Open-Top Aluminum Rotary Gondolas located off of various class 1s in various locations. For use in Sulphur service. Built 2004 or later.
- 30, 29K DOT111 Tanks located off of various class 1s in Chicago. For use in Veg Oil service.
Lease Offers
- 106, 31.8K CPC1232 Tanks located off of UP or BN in Texas. Last used in Diesel.
- 20, 31.8K DOT117R Tanks located off of UP or BN in Texas. Last used in Diesel.
- 86, 29K DOT117R Tanks located off of UP or BN in Texas. Last used in Gasoline. Coiled and Insulated.
- 21, 6351 Covered Hoppers located off of CN in Wisconsin. Last used in DDG. Available until February 2027.
- 29, 6500 Covered Hoppers located off of CN in Wisconsin. Last used in DDG. Available until February 2027.
- 50, 20K DOT117J Tanks located off of All Class 1s in Moving. Last used in Styrene.
- 29, 25.5K DOT117J Tanks located off of UP or BN in Texas. Cars are currently clean. Cars are currently clean.
- 90, 30K DOT117J Tanks located off of UP or BN in Corpus Christie. Last used in Diesel.
- 200, 340W DOT 112J Tanks located off of All Class 1s in Multiple Locations. Last used in Propane and Butane. Cars are currently clean.
- 15, 6200CF Covered Hoppers located off of All Class 1s in Wisconsin. Last used in Plastic. Cars are currently clean.
- 30, 6500CF Covered Hoppers located off of All Class 1s in Wisconsin. Last used in Plastic. Cars are currently clean.
- 50, 30K DOT117J Tanks located off of UP or BN in Corpus Christie. Last used in Gasoline.
- 24, 21K Stainless Steel Tanks located off of UP in Texas / Mexico Border. Last used in SULFACTANT. Cars are currently clean.
- 34, 30K DOT 111 Tanks located off of UP in Texas / Mexico Border. Last used in Veg Oil. Cars are currently clean.
- 117, 30K DOT117R Tanks located off of UP or BN in Texas. Last used in Gasoline.
- 100, 28.4K DOT 117J Tanks located off of UP or BN in Beaumont, TX. Cars are currently clean.
Sales Offers
- 50, 31.8K CPC1232 Tanks located off of UP or BN in TX. Last used in Multiple. Requal Due in 2025.
- 35, 3400CF Covered Hoppers located off of UP or BN in Midwest. Last used in Sand.
- 25, 30K 117J Tanks located off of CSX in Jackson, TN. Last used in Fuels. Newly Requalified.
Call PFL today to discuss your needs and our availability and market reach. Whether you are looking to lease cars, lease out cars, buy cars, or sell cars call PFL today at 239-390-2885
Live Railcar Markets
| CAT | Type | Capacity | GRL | QTY | LOC | Class | Prev. Use | Offer | Note |
|---|
PFL will be at the Following Conferences

- Where: Loews Arlington Hotel
- Attending: Brian Baker (239.297.4519), David Cohen (954-729-4774), and Curtis Chandler (239-405-3365)
- Conference Website

- Where: The Westin Galleria Dallas
- Attending: David Cohen (954-729-4774), and Curtis Chandler (239-405-3365)
- Conference Website

- Where: The Westin Galleria Dallas
- Attending: Brian Baker (239.297.4519)
- Conference Website