
“Do not let the memories of your past limit the potential of your future. There are no limits to what you can achieve on your journey through life, except in your mind.” – Roy T. Bennett
Jobs Update
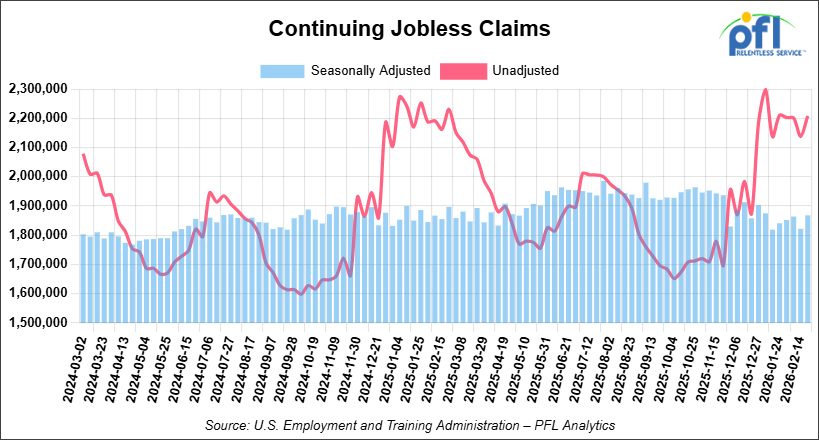
- Initial jobless claims seasonally adjusted for the week ending February 28, 2026 came in at 213,000, versus the adjusted number of 213,000 people from the week prior, flat week over week.

- Continuing jobless claims came in at 1,868,000, versus the adjusted number of 1,822,000 people from the week prior, up 46,000 week-over-week.
Stocks closed lower on Friday of last week and lower week-over-week
The DOW closed lower on Friday of last week, down -453.19 points (-0.95%), closing out the week at 47,501.55, down -1,496.37 points week-over-week. The S&P 500 closed lower on Friday of last week, down -90.69 points (-1.33%), and closed out the week at 6,740.02, down -138.86 points week-over-week. The NASDAQ closed lower on Friday of last week, down -361.31 points (-1.59%), and closed out the week at 22,387.68, down -280.53 points week-over-week.
In overnight trading, DOW futures traded higher and are expected to open at 47,065 this morning, down 452 points from Friday’s close.
Crude oil closed higher on Friday of last week and higher week-over-week
West Texas Intermediate (WTI) crude closed up $9.89 per barrel (12.21%), to close at $90.90 on Friday of last week, and up $23.88 week-over-week. Brent crude closed up $7.28 per barrel (8.52%), to close at $92.69, and up $20.21 week-over-week.
One Exchange WCS (Western Canadian Select) for April delivery settled on Friday of last week at US$12.00 below the WTI-CMA (West Texas Intermediate – Calendar Month Average). The implied value was US$78.90 per barrel.
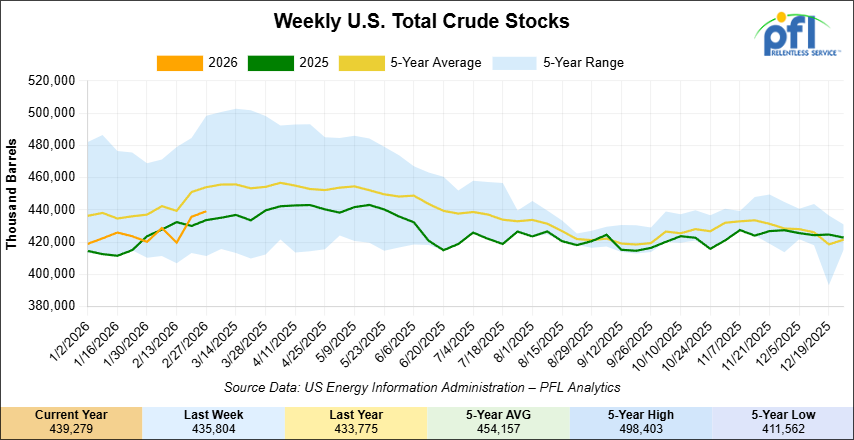
U.S. commercial crude oil inventories (excluding those in the Strategic Petroleum Reserve) increased by 3.5 million barrels week-over-week. At 439.3 million barrels, U.S. crude oil inventories are 3% below the five-year average for this time of year.
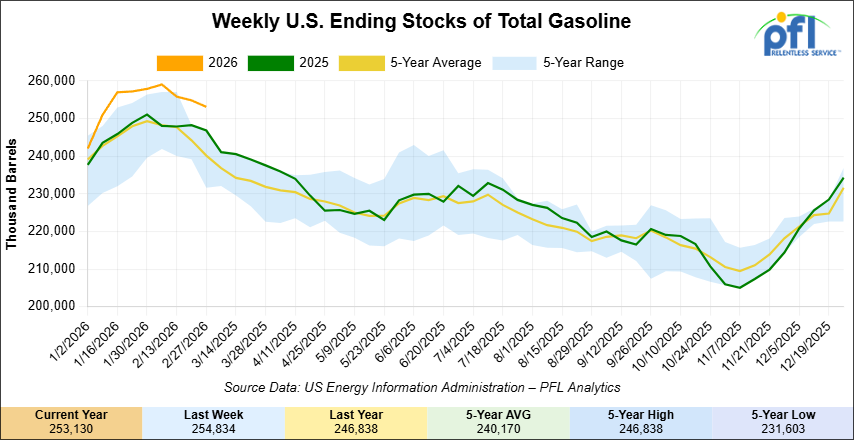
Total motor gasoline inventories decreased by 1.7 million barrels week-over-week and are 4% above the five-year average for this time of year.
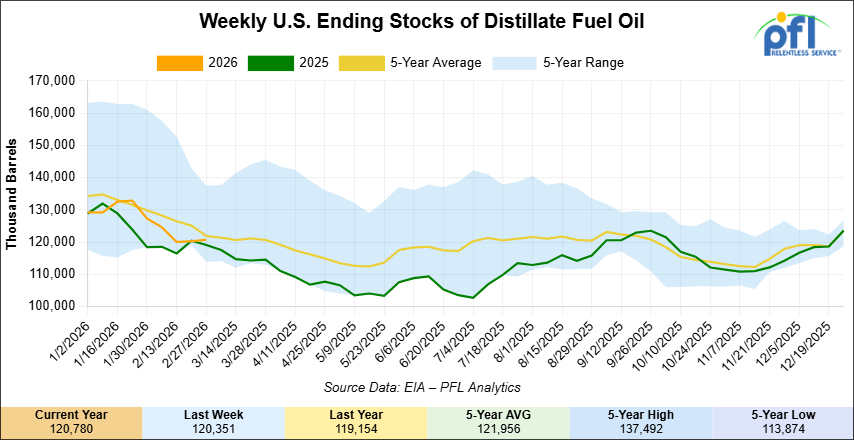
Distillate fuel inventories increased by 400,000 barrels week-over-week and are 3% below the five-year average for this time of year.
Propane/propylene inventories increased by 800,000 barrels week-over-week and are 54% above the five-year average for this time of year.
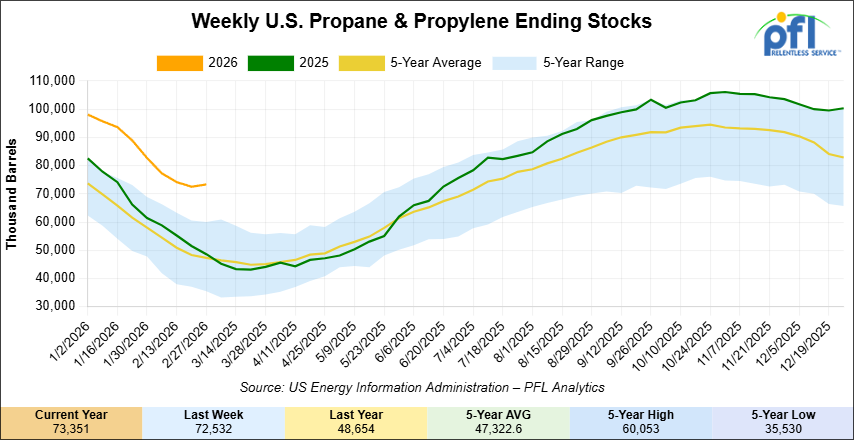
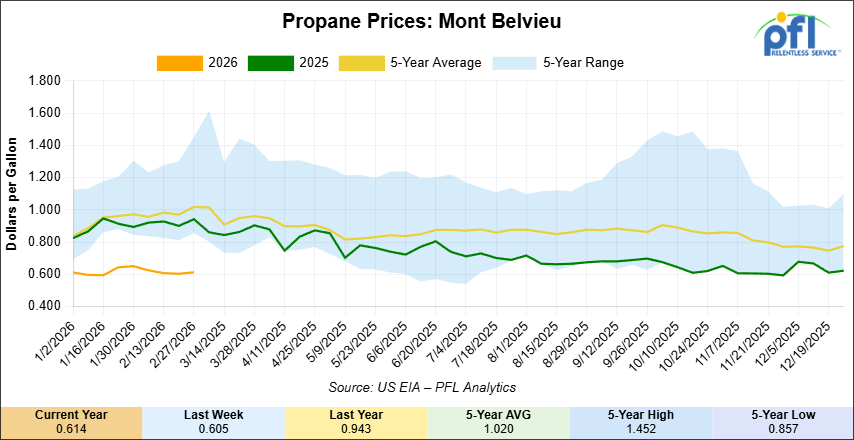
Propane prices closed at 61.4 cents per gallon on Friday of last week, up 0.9 cents per gallon week-over-week, but down 32.9 cents year-over-year.
Overall, total commercial petroleum inventories increased by 2.9 million barrels last week week-over-week, during the week ending February 27, 2026.
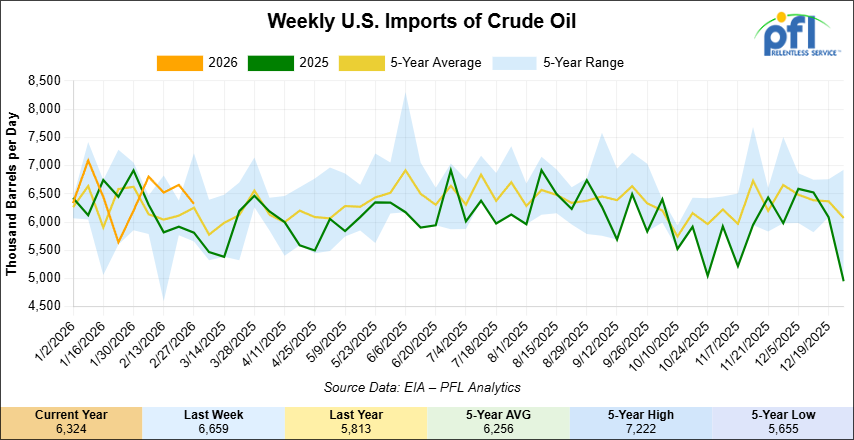
U.S. crude oil imports averaged 6.3 million barrels per day during the week ending February 27, 2026, a decrease of 335,000 barrels per day week-over-week. Over the past four weeks, crude oil imports averaged 6.6 million barrels per day, 10.3% more than the same four-week period last year. Total motor gasoline imports (including both finished gasoline and gasoline blending components) averaged 438,000 barrels per day, and distillate fuel imports averaged 174,000 barrels per day during the week ending February 27, 2026.
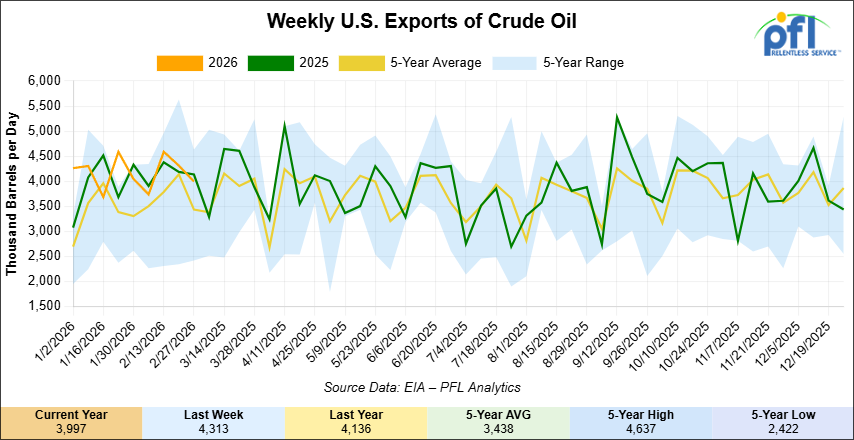
U.S. crude oil exports averaged 3.997 million barrels per day during the week ending February 27, 2026, a decrease of 316,000 barrels per day week-over-week. Over the past four weeks, crude oil exports averaged 4.16 million barrels per day.
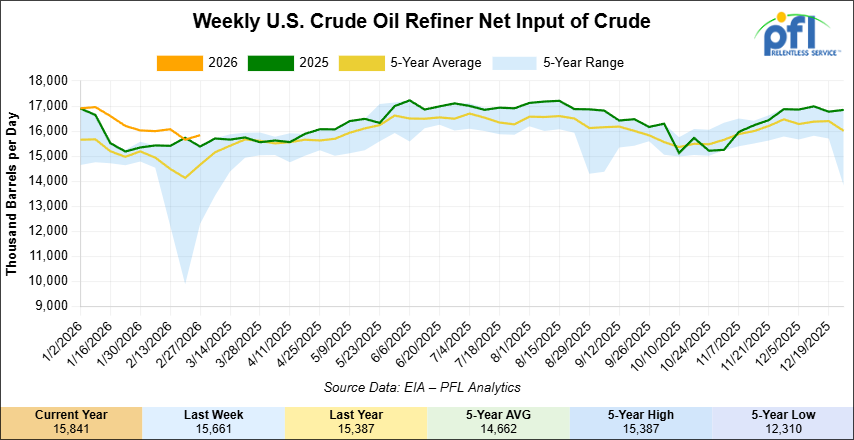
U.S. crude oil refinery inputs averaged 15.8 million barrels per day during the week ending February 27, 2026, which was up 180,000 barrels per day week-over-week.
WTI is poised to open at $100, up $10.06 per barrel from Friday’s close.
North American Rail Traffic
Week Ending March 4, 2026:
Total North American weekly rail volumes were up (+9.48%) in week 10, compared with the same week last year. Total Carloads for the week ending March 4, 2026 were 343,593, up (+18.02%) compared with the same week in 2025, while weekly Intermodal volume was 335,383, up (+1.92%) year over year. 1 of the AAR’s 11 major traffic categories posted year-over-year decreases. The largest decrease came from Forest Products (-16.37%). The largest increase was Grain (+53.30%).
In the East, CSX’s total volumes were up (+10.70%), with the largest decrease coming from Forest Products (-4.75%), while the largest increase came from Coal (+34.69%). NS’s total volumes were up (+5.54%), with the largest increase coming from Coal (+64.08%), while the largest decrease came from Other (-9.83%).
In the West, BNSF’s total volumes were up (+15.72%), with the largest increase coming from Grain (+84.36%), while the largest decrease came from Chemicals (-1.54%). UP’s total volumes were up (+9.40%), with the largest increase coming from Coal (+32.14%), while the largest decrease came from Forest Products (-1.24%).
In Canada, CN’s total volumes were up (+19.36%), with the largest increase coming from Grain (+148.26%), while the largest decrease came from Forest Products (-5.35%). CPKCS’s total volumes were down (-17.26%), with the largest increase coming from Grain (+38.55%), while the largest decrease came from Forest Products (-72.19%).
Source Data: AAR – PFL Analytics
North American Rig Count Summary
Rig Count
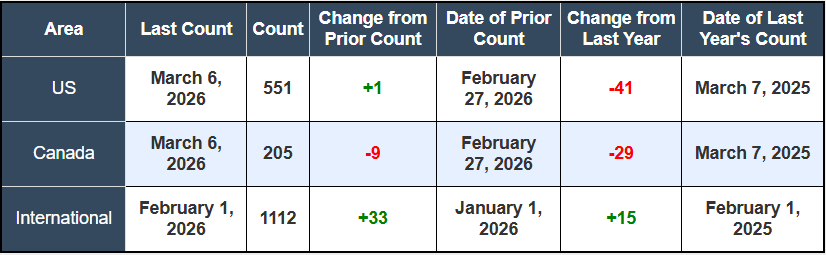
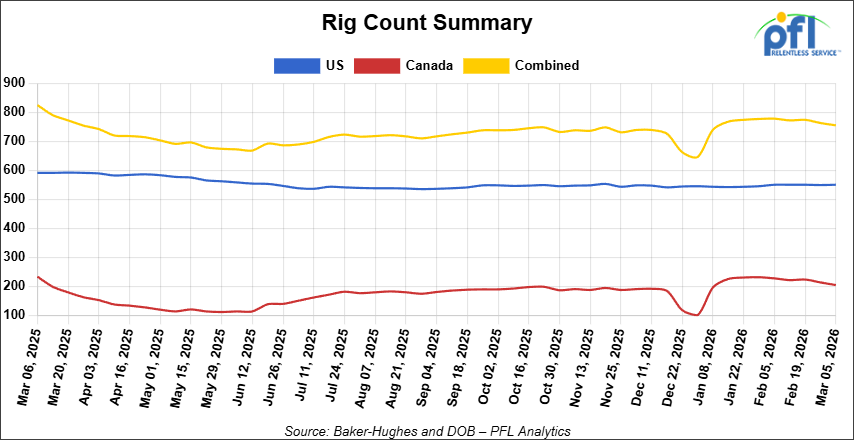
North American rig count was down by -8 rigs week-over-week. The U.S. rig count was up by +1 rig week-over-week, but down by -41 rigs year-over-year. The U.S. currently has 551 active rigs. Canada’s rig count was down by -9 rigs week-over-week and down by -29 rigs year-over-year. Canada currently has 205 active rigs. Overall, year-over-year we are down by -70 rigs collectively.
International rig count which is reported monthly was up by +33 rigs month-over-month and up by +15 rigs year-over-year. Internationally there are 1,112 active rigs.
We are watching a few things out there for you:
PFL has been on the conference circuit
The 16th Annual OPIS NGL Summit in Las Vegas was another outstanding event and a great opportunity to reconnect with colleagues and partners across the industry. With hundreds of attendees representing producers, traders, midstream companies, railroads, and service providers, there was no shortage of productive conversations and meetings throughout the week. PFL Petroleum Services was represented by Brian Baker and David Cohen, who spent the week meeting with industry partners and discussing opportunities across railcar services. The consistent theme throughout the event was the positive outlook for the NGL and LPG markets, with many attendees expressing optimism about continued demand growth, strong export markets, and expanding infrastructure supporting the industry. The receptions and networking events were excellent, and as always the relationships built and strengthened at this event are what make this summit such a valuable gathering for the NGL market.
Beyond the meetings, the week also included some memorable moments outside the conference sessions. The Targa party was one for the books and a highlight of the event, and the golf outing at Bali Hai was a great way to enjoy the beautiful Las Vegas weather while continuing conversations with industry peers. The OPIS team did a fantastic job organizing the summit and creating an environment where meaningful business connections can happen. A special thanks goes to the organizers, particularly David Coates and Nicole Morris, for putting together another excellent conference.
David Cohen was in attendance at the Rail Equipment Finance Conference in beautiful Palm Springs. The conference as usual was a big success. All of the industry’s top players were there – talking shop about rail equipment, leasing, and overall economics. It is always an informative conference and a good way to get your finger on the pulse of where things will be headed in the year to come. While the overall outlook is optimistic, certain car types and commodity groups are likely to perform much better than others. While not much growth is expected in overall carloads, an aging fleet and cars being removed from service will create a lot of opportunity. Car owners and equipment financiers are very actively looking for deals. If you are interested in learning more about what was discussed please do not hesitate to reach out to us at the desk, 239-390-2885.
We are Watching Petroleum Carloads
The four-week rolling average of petroleum carloads carried on the six largest North American railroads rose to 30,360 from 29,874 which was an increase of +486 rail cars week-over-week. Canadian volumes were higher. CN’s shipments were higher by +1.0% week-over-week, CPKC’s volumes were higher by +3.0% week-over-week. U.S. shipments were up across the board. The NS had the largest percentage increase and was up by +13.0%.
We are Watching the World’s Biggest Energy Choke Point
The Strait of Hormuz is effectively closed, and the shockwaves hit every corner of the energy market last week. After U.S. and Israeli forces struck Iran on February 28th, the IRGC declared the strait shut and threatened any vessel attempting transit. P&I insurance coverage was pulled as of March 5th, making it economically impossible for most operators to run the route. Brent crossed $90 for the first time since April 2024, and VLCC rates from the U.S. Gulf Coast to China nearly doubled week over week, hitting roughly $14 per barrel on a WTI basis, the highest level recorded since that route began being assessed in 2012.
Strait of Hormuz Traffic Drop in Marine Traffic
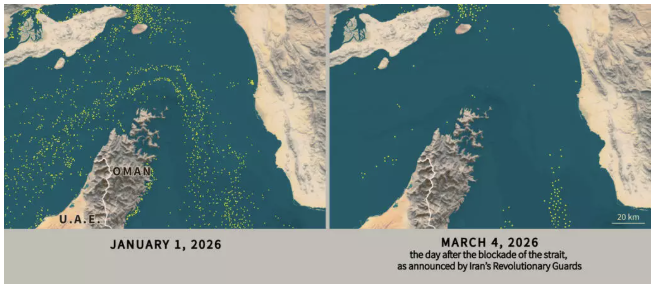
Source: Associated French Press – PFL Analytics
For North American crude, this is a profound market realignment. Asian refiners scrambling to replace Middle Eastern supply are looking hard at U.S. and Canadian grades. Japanese refiners have already started lobbying their government for strategic petroleum reserve releases. U.S. light sweet WTI has emerged as a direct substitute for Abu Dhabi’s Murban at several Asia-Pacific refineries, with at least one Japanese refiner locking in 2 million barrels of WTI for June delivery. The medium sour grades that Gulf Coast refiners relied on from Saudi Arabia and Iraq totaled around 587,000 b/d in the November-February window per Vortexa, and they are essentially off the table for now.
Crude-by-rail is not a relief valve that turns on with a week’s notice. The roughly 28,000 crude-specific tank cars in North America are overwhelmingly committed under multi-year leases, and major lessor utilization was running above 99 percent in 2024. New cars cost $150,000 to $180,000 and take 12 to 18 months to build. The shippers positioned to benefit from this environment are the ones who never let their CBR programs lapse, not those scrambling to stand one up now. With Enbridge Mainline running 13 percent apportionment in March and Alberta-to-U.S. Gulf Coast unit train rates sitting at $15.19/bl, the economics are moving decisively in favor of operators who already have infrastructure in place. Call PFL for further details. We do have some cars available for crude service, but not very many!
We are Watching Left Wing Canadian Prime Minister Carney
Canada’s largest oil producer just blinked, and it pointed the finger directly at Carney and Ottawa. Last week CNRL announced it is deferring all front-end engineering and design work on its $8.25-billion Jackpine mine expansion, cutting $310 million from its 2026 capital budget. The reason, stated plainly by president Scott Stauth: “lack of finalization of government regulatory policies around carbon pricing and methane, which creates uncertainty and economic burden for long-term growth investments.” The Jackpine expansion would have added 150,000 barrels per day of bitumen production, roughly the same volume the Trans Mountain Expansion added to Canadian export capacity when it came online in 2024, and it is now on ice indefinitely.
Carney’s November MOU with Alberta commits to ramping the industrial carbon price to a minimum effective credit price of $130 per tonne, which Carney himself described as more than a six times increase. Oil sands operators with carbon capture in place, like CNRL with its Scotford Quest project, are furious that they still face compliance costs despite actively sequestering CO2. Stauth’s position is blunt: if you are burying the carbon, you should not be paying the carbon tax. Ottawa has an April 1st deadline to finalize the carbon pricing framework under the Alberta MOU, and the entire oil sands sector is watching to see whether Carney delivers or punts again.
Every barrel of production that does not get sanctioned is a barrel that never needs to be transported. A 150,000 b/d project coming online in 2030 or 2031 would have represented meaningful incremental demand for both pipeline and rail egress. The Canadian Taxpayers Federation called on both Carney and Premier Danielle Smith to scrap industrial carbon taxes entirely, saying “even a pause on a multi-billion-dollar project costs Canadians jobs and costs governments royalties.” Carney is doing precisely what the industry warned he would do, and CNRL’s Jackpine deferral is only the most visible evidence of it so far.
We are Watching Alberta’s Pipeline Scramble
At least 2.25 million b/d of new long-haul capacity proposals have emerged on top of Alberta’s existing 5.4 million b/d export system, and they are not idle talk. South Bow launched an open season last week for its “Prairie Connector” project, soliciting binding long-term commitments for up to 450,000 b/d of new capacity from Hardisty to the U.S. border, connecting to Bridger Pipeline’s proposed 550,000 b/d system into Wyoming. The open season runs through March 30th, and South Bow CEO Bevin Wirzba said the policy environment is “far more constructive” than during previous attempts.
Alberta hit a record 4.41 million b/d in December 2025, up from 4.26 million b/d a year earlier, and South Bow expects Western Canadian Sedimentary Basin output to exceed takeaway capacity by mid-2027. Enbridge is already apportioning 13 percent of heavy crude nominations on the Mainline in March, up from essentially zero for most of last year, and the near-term fixes, Trans Mountain adding 90,000 b/d and Enbridge’s Mainline Optimization adding 150,000 b/d, are 2027 stories at the earliest.
None of these pipeline proposals solve the 2027 problem. The gap between production growth and takeaway capacity will open before any of them can close it, which is precisely where crude-by-rail lives. The Hormuz disruption is adding urgency, with Trump and Carney discussing Keystone XL revival as Canada repositions itself as a reliable non-Middle-Eastern supplier. Canada’s energy minister Tim Hodgson said this week that Canada is “even more important today than we were before the weekend.” He is not wrong. But infrastructure cannot be conjured on short notice, in pipelines or in rail cars.
We Continue to watch Enbridge Line 5
A U.S. federal judge in Wisconsin handed Enbridge a critical reprieve last week, staying a June 16, 2026 shutdown order on the 540,000 b/d Line 5 pipeline. The order had required Enbridge to relocate a 41-mile section crossing Bad River Band land in Wisconsin or shut the line by that date. The problem was timing: construction of the reroute only received clearance to begin last week after years of litigation delays, and the project will take 12 to 14 months to complete. Judge William Conley cited the “potentially devastating impact a sudden shutdown of Line 5 would have on energy prices and local economies, as well as foreign relations with Canada” in granting the stay.
Mainline Optimization Projects
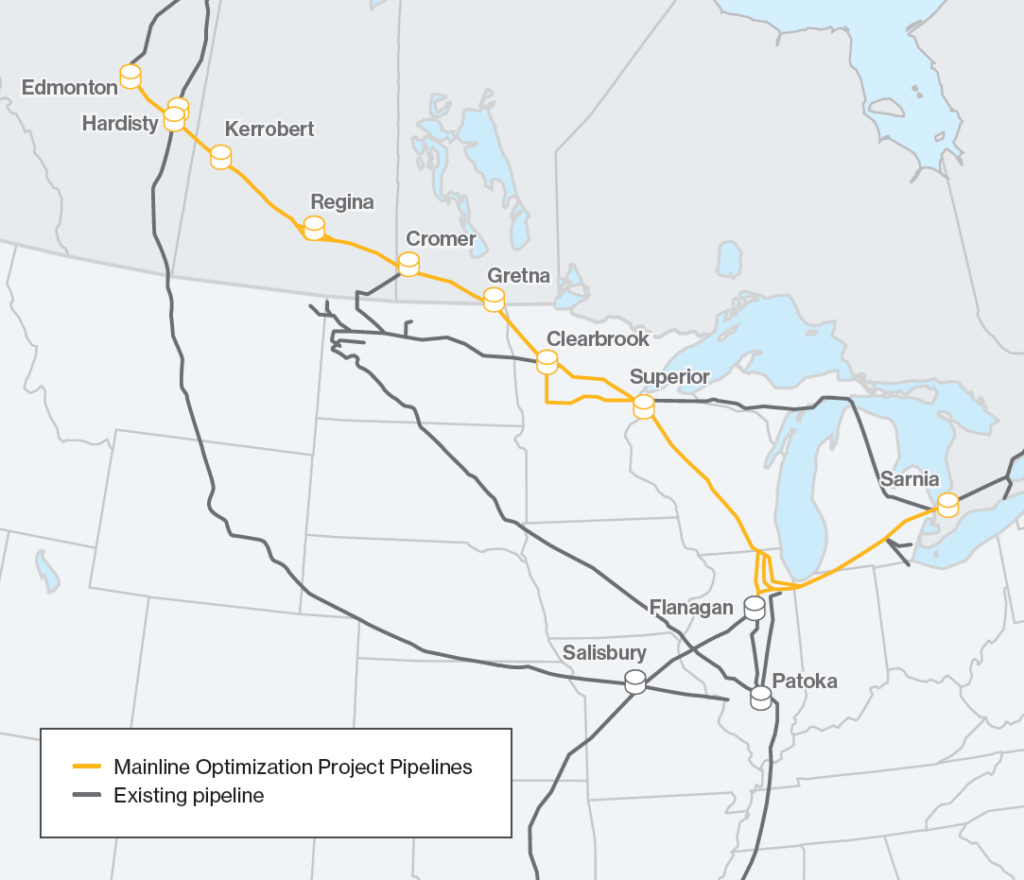
Source: Enbridge – PFL Analytics
Line 5 is not a minor piece of pipe in the ground. It stretches from Superior, Wisconsin through Michigan to Sarnia, Ontario, and most of its volume originates in western Canada via Enbridge’s 3.1 million b/d Mainline system. A sudden shutdown would have pulled significant volumes of Canadian crude and NGLs off a critical corridor into Ontario refining markets, creating immediate pressure to find alternative rail and truck transportation for affected volumes. The stay removes that worst-case scenario for now, though both parties have appeals pending at the Seventh Circuit. This story has been going on for a long time, but is not over. Common sense says it should be over and Enbridge should be able to complete it’s work around. Stay tuned to PFL. We are always watching this one.
We are Watching California
California’s fuel supply story went from bad to worse last week. The Valero Benicia refinery fully idled its crude unit in early February, and DOE data confirmed West Coast oil processing dropped by 144,000 b/d in the week ended February 20th, matching the shutdown barrel for barrel. This follows Phillips 66 shutting its 139,000 b/d Los Angeles refinery last year. California has now lost over 20 percent of its refining capacity in less than 18 months, with no pipeline connections to Gulf Coast or Midwest refinery hubs to compensate, leaving the state genuinely isolated every time supply tightens.
Alaska North Slope crude hit record delivered prices in the Pacific Basin this week as Asia-Pacific buyers competed for the same medium sour barrels that West Coast refiners depend on. The fleet of Jones Act tankers that normally moves ANS to California and Washington may be getting pulled into trans-Pacific voyages given VLCC shortages, tightening local tanker supply further. Los Angeles CARBOB gasoline prices hit a 22-month high of $3.08 per gallon on Thursday as tight regional inventories collided with Hormuz-driven crude market turbulence.
The Bakken-to-Seattle unit train rate sits at $7.88/bl and the Alberta-to-Stockton rate for Canadian heavy is $9.56/bl. With refinery capacity shrinking, marine supply chains disrupted, and ANS hitting record prices, the economics of delivering Bakken and Canadian heavy crude by rail to West Coast refiners are more compelling today than they have been in years, and PFL has the tank car capacity to support these lanes.
We are Watching LPG’s
The Hormuz closure did not just hit crude markets. The Mideast Gulf region accounted for 30.5 percent of global LPG exports in 2025 at 1.48 million b/d, and with that supply locked in the Gulf, Asia-Pacific buyers turned to the U.S. immediately. Mont Belvieu propane prices jumped more than 9.6 percent in a single session on March 2nd, EPC propane gained 12.2 percent the same day, and U.S. Gulf Coast propane terminal fees hit a record 33 cents per gallon, roughly six times where they stood on February 4th, with the Far East delivered propane index spiking nearly $140 per tonne week on week to close to $780 per tonne on March 4th, a three-year high.
Fog-related delays at Gulf terminals in January and February left exporters still working to clear term cargo backlogs before the Hormuz shock hit. The Nederland terminal saw at least seven days of delays in January; Enterprise’s Houston outlet had five. U.S. propane exports actually fell to 1.6 million b/d in the week ended February 27th, the lowest since July 2025, underscoring that the U.S. cannot simply open the taps to replace Mideast shortfalls even with prices screaming higher. AltaGas reported its LPG exports to Asia rose 2 percent in Q4 2025, with its Prince Rupert Ripet terminal setting a quarterly export record above 85,000 b/d. Its Ridley Energy Export Facility is over 70 percent complete and on track for Q4 2026 startup at 56,000 b/d.
We are Watching Renewables
The Hormuz shock and California’s refinery implosion did not just move petroleum prices this week. They pulled the entire liquid fuels complex higher, and the renewable fuels market is feeling it in ways that matter for rail. Los Angeles renewable diesel prices surged from $2.48 per gallon on February 27th to $3.46 per gallon by Thursday, a 39.5 percent gain in a single week. West Coast refiners who lost access to California’s conventional refining capacity are competing for every drop of liquid fuel, renewable or conventional, that can be delivered into the state. With the Valero Benicia and Phillips 66, LA refineries both offline and no pipeline access from outside the region, the West Coast will pay almost anything to keep fuel moving.
Supply on the renewable diesel side is razor thin on the West Coast. In December 2025, GreenAmerica Biofuels out of Canada was the only renewable diesel supplier to the entire U.S. West Coast, with Neste absent for a second consecutive month. That is a stunning concentration of supply in a single source, and it underscores just how dependent California has become on a handful of producers for a fuel that its own regulatory regime mandates. Full-year 2025 RD imports into the West Coast totaled 142.5 million gallons, with 62 percent coming from Canada. The tank cars moving Canadian renewable diesel south are doing critical work, and any disruption to that supply chain shows up immediately in rack prices across the state.
On the ethanol side, blending economics are the best they have looked in a long time. Chicago ethanol spot hit $1.90 per gallon on Friday of last week, a three-month high, while RBOB traded at a 72.2-cent premium over ethanol, making E10 and E15 blending sharply profitable for any terminal operator with access to both products. Ethanol exports surged to 217,000 b/d in the week ended February 27th, up 53.9 percent week on week, as international buyers chased a petroleum substitute that is actually available. Nebraska FOB railcar ethanol is trading at $1.63 to $1.65 per gallon, Dallas rail at $1.89, and UP westbound lanes to the Southwest at roughly $1.95. Stacked against high blending margins, surging export demand, and petroleum supply disruption, ethanol rail volumes look firm through the spring. E15 momentum is also building politically, with Iowa corn groups pressing Energy Secretary Wright for year-round nationwide access, and FAPRI modeling showing an additional 264 million gallons of ethanol demand in 2026 alone, if E15 expands broadly.
We are Watching the UP-NS Merger
Last week, seven Republican state attorneys general wrote to the STB calling the deal anti-competitive, adding some unexpected political heat to an already crowded opposition file. UP is pushing ahead regardless, with a refiled application due April 30th and a hard STB deadline of June 22nd. UP CEO Jim Vena has called the opposition “a panicked reaction” from competitors protecting their turf. He may be right, but the AG letter gives the STB political cover to ask harder questions.
The original application got kicked back in January for being incomplete: missing the full merger agreement, inadequate market share analysis, and unresolved questions around shared terminal access. The refile has to explain how a single railroad handling 43 percent of U.S. freight will not squeeze shippers, while Congress sits on the sidelines with 47 House members already calling for a rigorous STB review.
For energy and petroleum shippers specifically, the terminal access question is the one to watch. Houston’s Port Terminal Railroad currently gives UP, BNSF, and CPKC shared access to Gulf Coast petrochemical plants and port facilities. A UP-NS combination reshuffles that dynamic significantly, and how the STB handles terminal access in the revised application will matter to anyone moving crude, LPG, or refined products through Gulf Coast rail corridors. The Railway Age Next-Gen Freight Rail conference in Chicago on March 10th is the next live moment, both CEOs speaking publicly alongside the STB chair. Worth paying attention to the tone coming out of that room.
We Are Watching Key Economic Indicators
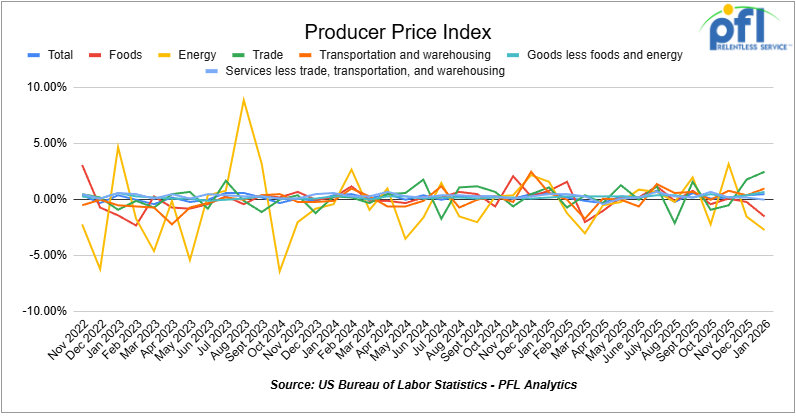
Producer Price Index
In January 2026, the Producer Price Index (PPI) for final demand rose 0.5% month over month, accelerating from the 0.4% increase in December and signaling renewed upstream price pressures to begin the year. Core PPI (final demand less foods, energy, and trade services) increased 0.3% month over month, in line with December’s pace.The monthly increase was driven entirely by services, which rose 0.8%, while goods declined 0.3%. Within goods, food prices fell 1.5% and energy prices declined 2.7%, while goods less foods and energy increased 0.7%, reflecting firming core goods pricing. Within services, trade margins rose 2.5%, transportation and warehousing increased 1.0%, and services less trade, transportation, and warehousing were unchanged (0.0%), indicating that the bulk of the services strength came from margin and logistics categories.
In January 2026, the Consumer Price Index (CPI) increased 0.3% month over month, matching December’s gain, and was up 2.7% year over year. Core CPI (all items less food and energy) rose 0.2% month over month and was up 2.6% year-over-year. Shelter remained the largest contributor to the monthly increase. Food prices edged higher, while energy prices were mixed, with gasoline prices continuing to influence the headline figure.
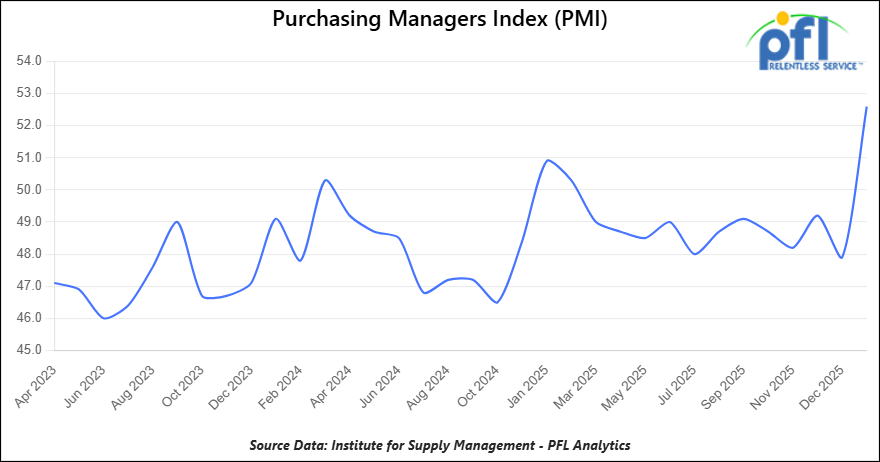
Purchasing Managers Index (PMI)
The Institute for Supply Management releases two PMI reports – one covering manufacturing and the other covering services. These reports are based on surveys of supply managers across the country and track changes in business activity. A reading above 50% on the index indicates expansion, while a reading below 50% signifies contraction, with a faster pace of change the farther the reading is from 50.
The Manufacturing PMI in February 2026 was 52.4%, slightly below January’s 52.6% but still firmly in expansion territory and marking the second consecutive month above the 50 threshold after an extended period of contraction.
On the Services PMI side, the most recent reading is 56.1% (February 2026), up from 53.8% in January and signaling strong expansion in the services sector at its fastest pace in well over a year.
Lease Bids
- 100, 21.9K 117J Tanks located off of All Class 1s in Midwest. For use in CO2 service. Period: 6 months.
- 30-50, 30K 117J Tanks located off of NS or CSX in Northeast. For use in C5 service. Period: 1 year.
- 20-50, 4000-5000 Covered Hoppers located off of UP or BN in Houston. For use in Urea, Potash, Ammonium Sulfate service. Period: 6-12 Months.
- 200, 33K Pressure Tanks located off of CSX or NS in Ohio. For use in Propylene service. Period: 18 Months.
- 30-50, 25.5K Dot 111 Tanks located off of All Class 1s in Anywhere. For use in Asphalt service. Period: 1-3 Years.
Sales Bids
- 28, 3400CF Covered Hoppers located off of UP BN in Texas. For use in Cement service. Cement Gates needed.
- 20, 17K DOT111 Tanks located off of various class 1s in various locations. For use in corn syrup service.
- 120, Various Open-Top Aluminum Rotary Gondolas located off of various class 1s in various locations. For use in Sulphur service. Built 2004 or later.
- 30, 29K DOT111 Tanks located off of various class 1s in Chicago. For use in Veg Oil service.
Lease Offers
- 100, 30K CPC1232 Tanks located off of UP or BN in Texas. Last used in Diesel.
- 100, 30K DOT117R Tanks located off of UP or BN in Texas. Last used in Gasoline.
- 100, 29K DOT117R Tanks located off of UP or BN in Texas. Last used in Gasoline. Coiled and Insulated.
- 21, 6351 Covered Hoppers located off of CN in Wisconsin. Last used in DDG. Available until February 2027.
- 29, 6500 Covered Hoppers located off of CN in Wisconsin. Last used in DDG. Available until February 2027.
- 50, 20K DOT117J Tanks located off of All Class 1s in Moving. Last used in Styrene.
- 29, 25.5K DOT117J Tanks located off of UP or BN in Texas. Cars are currently clean. Cars are currently clean.
- 90, 30K DOT117J Tanks located off of UP or BN in Corpus Christie. Last used in Diesel.
- 200, 340W DOT 112J Tanks located off of All Class 1s in Multiple Locations. Last used in Propane and Butane. Cars are currently clean.
- 15, 6200CF Covered Hoppers located off of All Class 1s in Wisconsin. Last used in Plastic. Cars are currently clean.
- 30, 6500CF Covered Hoppers located off of All Class 1s in Wisconsin. Last used in Plastic. Cars are currently clean.
- 50, 30K DOT117J Tanks located off of UP or BN in Corpus Christie. Last used in Gasoline.
- 24, 21K Stainless Steel Tanks located off of UP in Texas / Mexico Border. Last used in SULFACTANT. Cars are currently clean.
- 34, 30K DOT 111 Tanks located off of UP in Texas / Mexico Border. Last used in Veg Oil. Cars are currently clean.
Sales Offers
- 50, 31.8K CPC1232 Tanks located off of UP or BN in TX. Last used in Multiple. Requal Due in 2025.
- 35, 3400CF Covered Hoppers located off of UP or BN in Midwest. Last used in Sand.
- 25, 30K 117J Tanks located off of CSX in Jackson, TN. Last used in Fuels. Newly Requalified.
Call PFL today to discuss your needs and our availability and market reach. Whether you are looking to lease cars, lease out cars, buy cars, or sell cars call PFL today at 239-390-2885
Live Railcar Markets
| CAT | Type | Capacity | GRL | QTY | LOC | Class | Prev. Use | Offer | Note |
|---|
PFL will be at the Following Conferences

- Where: Loews Arlington Hotel
- Attending: Brian Baker (239.297.4519), David Cohen (954-729-4774), and Curtis Chandler (239-405-3365)
- Conference Website

- Where: The Westin Galleria Dallas
- Attending: David Cohen (954-729-4774), and Curtis Chandler (239-405-3365)
- Conference Website

- Where: The Westin Galleria Dallas
- Attending: Brian Baker (239.297.4519)
- Conference Website