
“You cannot escape the responsibility of tomorrow by evading it today.”
Abraham Lincoln
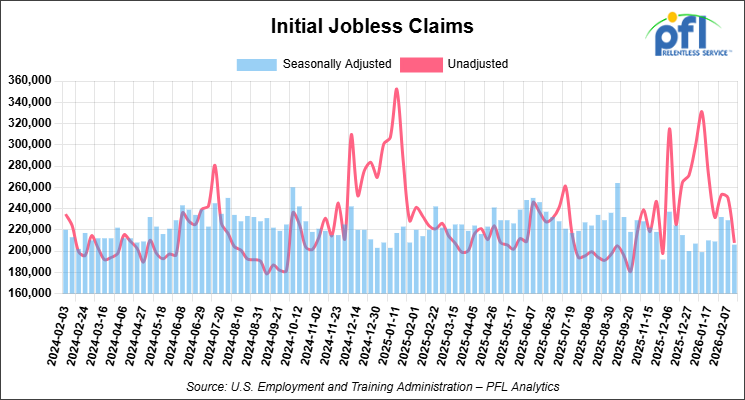
Jobs Update
- Initial jobless claims seasonally adjusted for the week ending February 14, 2026 came in at 206,000, versus the adjusted number of 229,000 people from the week prior, down 23,000 people week over week.
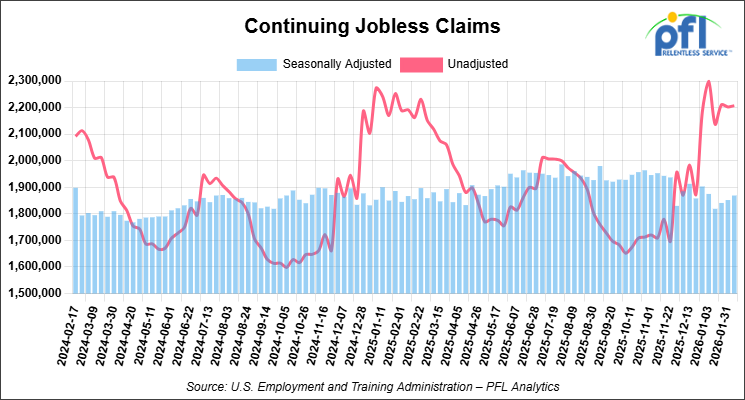
- Continuing jobless claims came in at 1,869,000, versus the adjusted number of 1,852,000 people from the week prior, up 17,000 week-over-week.
Stocks closed higher on Friday of last week and higher week-over-week
The DOW closed higher on Friday of last week, up 230.81 points (0.47%), closing out the week at 49,625.97, up 125.04 points week-over-week. The S&P 500 closed higher on Friday of last week, up 47.62 points (0.69%), and closed out the week at 6,909.51, up 73.34 points week-over-week. The NASDAQ closed higher on Friday of last week, up 203.34 points (0.90%), and closed out the week at 22,886.07, up 339.40 points week-over-week.
In overnight trading, DOW futures traded lower and are expected to open at 49,550 this morning, down -124 points from Friday’s close.
Crude oil closed mixed on Friday of last week and higher week-over-week
West Texas Intermediate (WTI) crude closed down -0.04 per barrel (-0.06%), to close at $66.39 on Friday of last week, but up $3.50 week-over-week. Brent crude closed up 0.10 per barrel (0.14%), to close at $71.76, and up $4.01 week-over-week.
One Exchange WCS (Western Canadian Select) for April delivery settled on Friday of last week at US$15.00 below the WTI-CMA (West Texas Intermediate – Calendar Month Average). The implied value was US$51 per barrel.
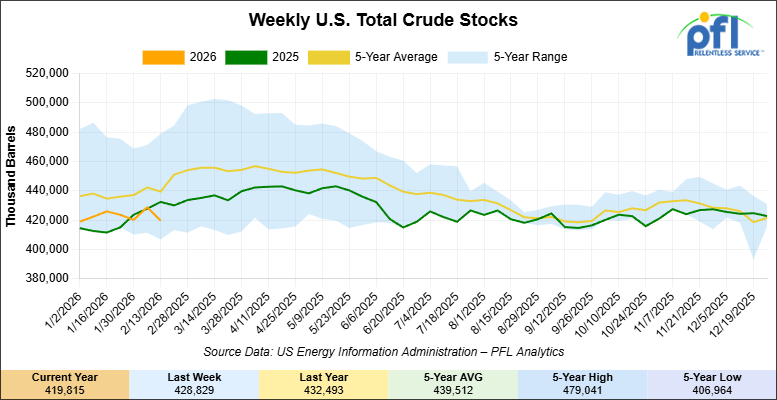
U.S. commercial crude oil inventories (excluding those in the Strategic Petroleum Reserve) decreased by 9 million barrels week-over-week. At 419.8 million barrels, U.S. crude oil inventories are 5% below the five-year average for this time of year.
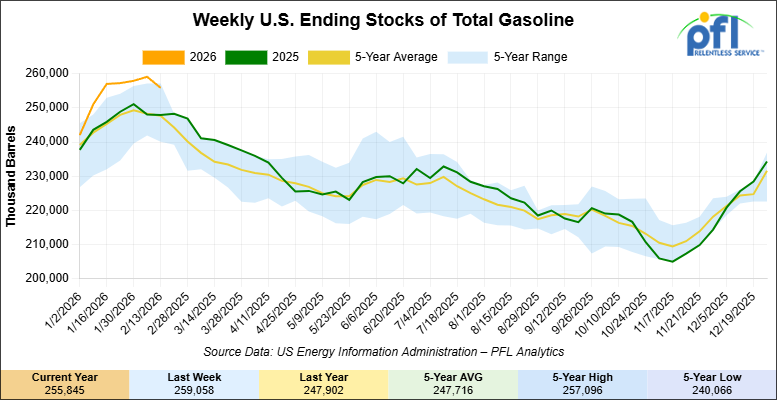
Total motor gasoline inventories decreased by 3.2 million barrels week-over-week and are 3% above the five-year average for this time of year.
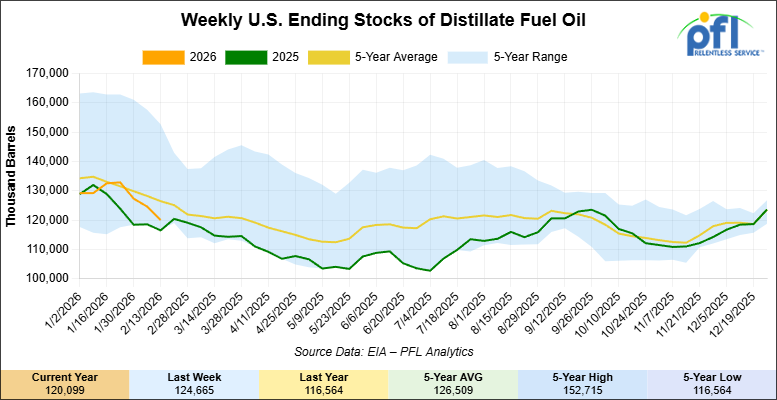
Distillate fuel inventories decreased by 4.6 million barrels week-over-week and are 5% below the five-year average for this time of year.
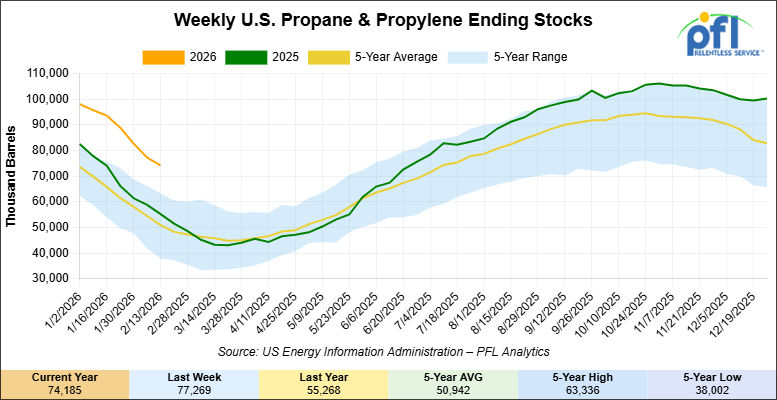
Propane/propylene inventories decreased 3.1 million barrels week-over-week and are 39% above the five-year average for this time of year.
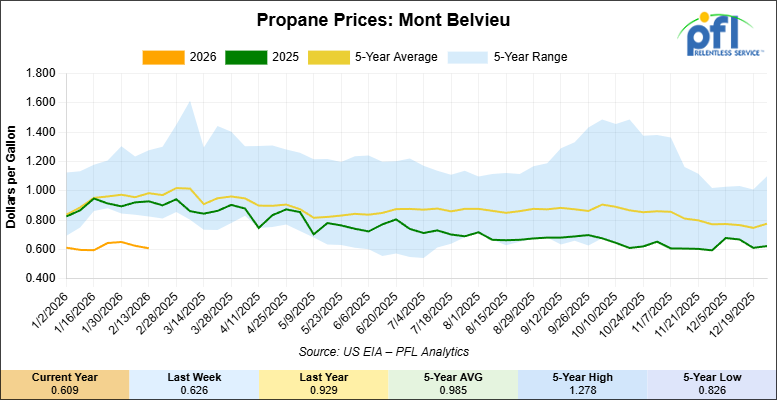
Propane prices closed at 60.9 cents per gallon on Friday of last week, down 1.7 cents per gallon week-over-week, and down 32 cents year-over-year.
Overall, total commercial petroleum inventories decreased by 19.1 million barrels week-over-week, during the week ending February 13, 2026.
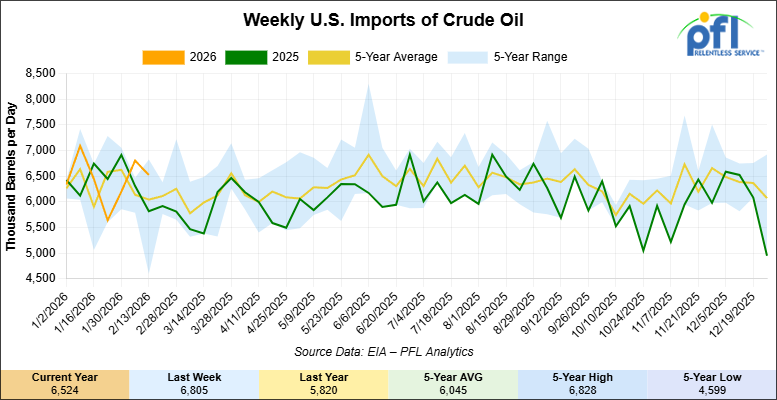
U.S. crude oil imports averaged 6.5 million barrels per day last week, a decrease of 281,000 barrels per day week-over-week. Over the past four weeks, crude oil imports averaged 6.3 million barrels per day, 1.3% less than the same four-week period last year. Total motor gasoline imports (including both finished gasoline and gasoline blending components) averaged 353,000 barrels per day, and distillate fuel imports averaged 199,000 barrels per day during the week ending February 13, 2026.
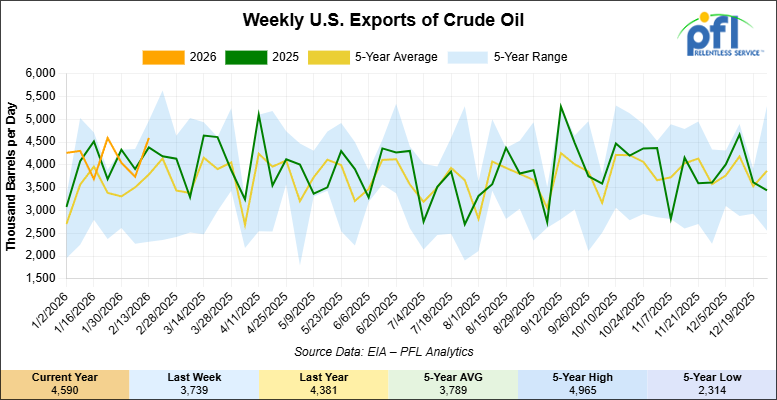
U.S. crude oil exports averaged 4.59 million barrels per day during the week ending February 13, 2026, an increase of 851,000 barrels per day week-over-week. Over the past four weeks, crude oil exports averaged 4.241 million barrels per day.
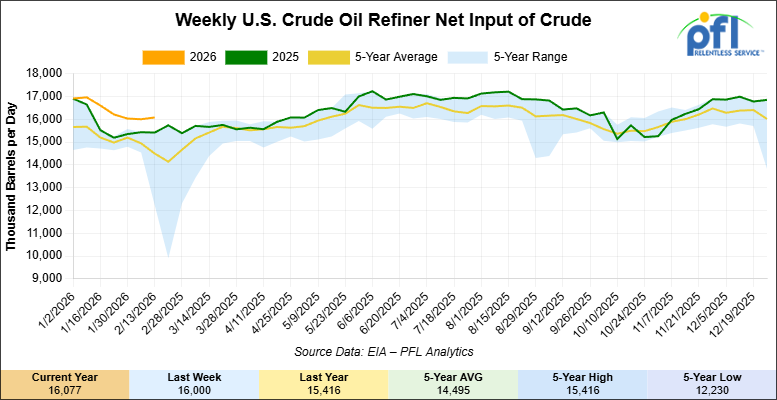
U.S. crude oil refinery inputs averaged 16.1 million barrels per day during the week ending February 13, 2026, which was 77,000 barrels per day more week-over-week.
WTI is poised to open at $66.07, down 41 cents per barrel from Friday’s close.
North American Rail Traffic
Week Ending February 18, 2026:
Total North American weekly rail volumes were up (+3.77%) in week 8, compared with the same week last year. Total Carloads for the week ending February 18, 2026 were 330,593, up (+5.51%) compared with the same week in 2025, while weekly Intermodal volume was 343,782, up (+2.16%) year over year. 10 of the AAR’s 11 major traffic categories posted year-over-year increases. The largest decrease came from Forest Products (-17.37%). The largest increase was Grain (+39.72%).
In the East, CSX’s total volumes were up (+0.23%), with the largest decrease coming from Coal (-18.61%), while the largest increase came from Intermodal Units (+9.42%). NS’s total volumes were up (+1.43%), with the largest increase coming from Petroleum & Petroleum Products (+16.93%), while the largest decrease came from Forest Products (-8.65%).
In the West, BNSF’s total volumes were up (+9.24%), with the largest increase coming from Grain (+56.48%), while the largest decrease came from Chemicals (-3.62%). UP’s total volumes were up (+7.61%), with the largest increase coming from Grain (+57.03%), while the largest decrease came from Forest Products (-3.25%).
In Canada, CN’s total volumes were up (+9.26%), with the largest increase coming from Grain (+37.89%), while the largest decrease came from Other (-37.95%). CPKCS’s total volumes were down (-21.63%), with the largest increase coming from Grain (+35.70%), while the largest decrease came from Forest Products (-69.79%).
Source Data: AAR – PFL Analytics
North American Rig Count Summary
Rig Count
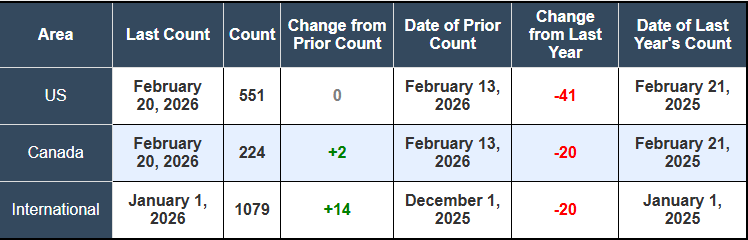
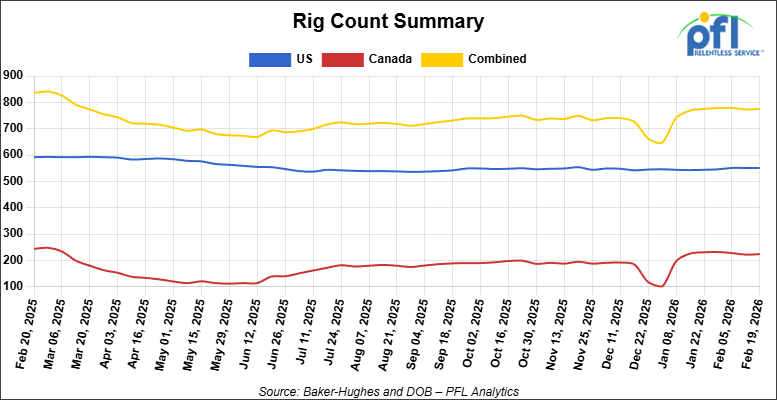
North American rig count was up by +2 rigs week-over-week. The US rig count was unchanged week-over-week, but down by -41 rigs year-over-year. The US currently has 551 active rigs. Canada’s rig count was up by +2 rigs week-over-week, but down by -20 rigs year-over-year. Canada currently has 224 active rigs. Overall, year-over-year we are down by -61 rigs collectively.
We are watching a few things out there for you:
We are Watching Petroleum Carloads
The four-week rolling average of petroleum carloads carried on the six largest North American railroads rose to 29,673 from 29,173 which was an increase of +500 rail cars week-over-week. Canadian volumes rose. CN’s shipments were higher by +4.0% week-over-week, CPKC’s volumes were higher by +18.0% week-over-week. U.S. shipments were mixed. The BN had the largest percentage increase and was up by +10.0%. The CSX had the largest percentage decrease and was down by -3.0%.
We are Watching Canada
When Enbridge CEO Greg Ebel was asked last week about building a new West Coast oil pipeline, he did not mince words. The company spent C$600 million (roughly $440 million US) on the Northern Gateway project (never was built), watched the government pull the rug out when approval was overturned in 2016, and has no appetite to repeat the exercise. “That’s not the type of risk we are prepared to take on at this time,” Ebel said. That is as close to a flat no as you will hear from a CEO who still has to be diplomatic about these things.
The irony is that while Enbridge is declining to build new West Coast capacity, its existing Mainline system is under considerable pressure. The system averaged 3.1 million barrels per day in 2025 and was apportioned for nine of those twelve months, and already for both January and February of this year. Enbridge has sanctioned Mainline Line Optimization Phase 1 (MLO1), which will add 150,000 bpd of new capacity by October 2027, with MLO2 adding another 250,000 bpd in 2028. Those are welcome additions, but they are incremental fixes to a system that is already straining. The apportionment data last week confirms the situation has not improved: Enbridge rejected 13% of January heavy crude nominations at Kerrobert, Saskatchewan.
Meanwhile, Trans Mountain waterborne exports fell in January to an 11-month low of 390,000 b/d, the lowest since February 2025, as Chinese SPR buying that had supported prices through late 2025 eased. Chinese state-controlled firms may have added as much as 1.1 million b/d to China’s strategic petroleum reserve in December alone, and that demand has since faded. Heavy Canadian loadings from TMX to Asia-Pacific fell almost 22% from December. The result is that more Alberta barrels are being pushed back onto the Mainline and into US-bound flows rather than heading west. On a brighter note, Enbridge’s Line 5 reroute permit in Wisconsin was upheld by an administrative law judge on February 13, moving construction of the 41-mile reroute around the Bad River Band reservation closer to reality.
The April 1st carbon pricing deadline highlighted by Ebel remains a key near-term watch point. Producers need to understand Canada’s industrial carbon policy before committing to the kind of production growth that would stress the Mainline further. The Alberta government’s West Coast pipeline proposal targets federal submission by July 1st, but is structurally a decade away from moving molecules even in the best case. PFL will be watching how quickly MLO1 and MLO2 are absorbed and whether apportionment tightens further as new oilsands production hits the system.
We are Watching Cenovus
Three months after closing its $6.1 billion acquisition of MEG Energy, Cenovus has already captured the corporate synergies and is now focused on growing production in the field. The company produced a record 918,000 barrels of oil equivalent per day in Q4 2025, up 12% from Q4 2024, and exited the year with a monthly record of over 970,000 boe/d in December. The Q4 profit came in at C$934 million, up from C$146 million a year earlier. This is not a company that is slowing down.
The growth is coming from across the portfolio. Foster Creek hit a new record of 220,000 b/d in Q4, up from 195,000 b/d a year earlier, following completion of a 30,000 b/d optimization project ahead of schedule. Sunrise rose to 58,000 b/d, with three new well pads expected online this year. New to the Cenovus portfolio is Christina Lake North, formerly MEG’s Christina Lake asset, which averaged 110,000 b/d in Q4 for a record at that asset. CFO Kam Sandhar said on last Thursday’s earnings call that Cenovus plans to add approximately 40,000 b/d at Christina Lake North by 2028, growing total Christina Lake production to approximately 400,000 b/d, one of the largest single-asset production footprints in the oilsands.
What this means for pipeline and rail markets is more volume pressing against a system that, as noted above, is already apportioned. The question that matters for freight is whether MLO1 and MLO2 absorb the new barrels, or whether the system tips back toward differential widening that forces incremental production onto rail. The WCS-WTI differential has widened to 23-month highs, and the breakeven economics for crude-by-rail are essentially here right now. Cenovus’s production growth into a tightening Mainline is the single most important underlying driver of crude-by-rail economics in Western Canada over the next two years. PFL will be watching this one closely.
We are Watching the Supreme Court
On Friday of last week, the U.S. Supreme Court threw out most of the tariffs President Trump has imposed on nearly all U.S. trading partners, finding his ability to unilaterally impose tariffs exceeded his powers under the International Emergency Economic Powers Act (IEEPA). The ruling could have potentially sweeping implications for cross-border trade flows and, by extension, for the rail industry that moves goods across the Canada-US and Mexico-US borders.
The timing is almost darkly comic. Last Wednesday, the US House voted 219-211 to revoke Canada’s 25% tariffs through a congressional resolution, a largely symbolic gesture that Trump was expected to veto anyway. Six Republicans crossed the aisle. The White House called it “a fruitless exercise.” Within days, the Supreme Court effectively rendered the entire debate moot. If the ruling holds, the IEEPA-based tariff architecture, which is the legal foundation for the Canada, Mexico, and global tariffs, collapses.
For the rail industry, the immediate question is whether this translates to a recovery in cross-border freight volumes. CN Rail disclosed last week that tariff impacts cost the company more than $350 million in revenue in 2025, with forest products and metals hardest hit. Critically, CN CFO Ghislain Houle made those comments at a Citi conference on February 18th, before the Supreme Court ruling, describing the environment as “still very murky.” A removal of tariffs would directly address the uncertainty that has been causing shippers to defer cross-border commitments. CPKC CEO Keith Creel noted last week that “tariff tribulations” had pushed Canadian and Mexican companies to diversify away from US suppliers, creating demand for CPKC as a Canada-Mexico land bridge. That trade pattern could now partially reverse.
Important caveats apply. The Trump administration will almost certainly appeal, and whether the ruling applies retroactively or only prospectively matters enormously for pricing and contract decisions. The USMCA review scheduled for July is a separate process that proceeds regardless. Readers should watch for the administration’s formal response in the coming days, as that will clarify whether the Canada-specific tariffs are immediately suspended or remain in legal limbo. Over the weekend, Trump struck back, imposing a 15% across-the-board tariff on all countries under separate legal authority. The tariff story is not over. Stay tuned to PFL, we are watching this one closely!
We are Watching Canola
Readers will recall that last month, left-wing Prime Minister Carney returned from Beijing with a trade deal that included significant tariff relief on Canadian canola. The March 1 implementation date is now days away. As of that date, China’s tariffs on Canadian canola seed drop from approximately 84% to 15%, and the 100% tariffs on canola meal are removed entirely through at least year-end. Together, these changes are expected to restore access to nearly $7 billion in annual export markets for Canadian agriculture.
To understand the magnitude of what has been blocked, consider that Canadian canola exports to China were essentially zero from August 2025 onward, after China’s preliminary anti-dumping duties on canola seed hit 75.8%. An industry that had been shipping meaningful volumes to China annually effectively lost that market overnight. With the 2025 crop sitting in storage and spring planting decisions weeks away, the timing of this tariff relief is critical for producer confidence. The Supreme Court ruling discussed above introduces one wrinkle: if US tariffs on Canada are struck down, some of the political calculus that drove Carney to the China deal changes. The canola deal itself is separate and proceeds regardless, but the broader trade picture is shifting quickly.
The rail implication is real and near-term. Covered hopper demand from the prairies into the Pacific export terminals has been depressed since the tariffs hit. A resumption of meaningful canola flow to China, routed through Vancouver export terminals via CN and CPKC, would put cars back to work on a lane that has been underutilized for months. Analysts are rightly cautious, as the tariff relief on canola meal is only guaranteed through year-end, and canola oil remains excluded from the deal entirely. But even a partial restoration of China volumes would be a meaningful shot in the arm for covered hopper utilization. PFL has covered hopper exposure in Western Canada, and we will be monitoring closely as the first post-tariff shipments begin moving.
We are Watching the UP and the NS
On Monday of last week, the Union Pacific and the Norfolk Southern jointly notified the Surface Transportation Board that they intend to refile their $85 billion merger application by April 30, 2026. The original December filing was rejected in January as incomplete, with the STB saying it was missing forward-looking market share data and key terms of the merger agreement. UP CEO Jim Vena, speaking at a Wednesday investor conference, said the delay will not derail the timeline and the railroads still expect to close the transaction in early or mid-2027.
What is new is that CN and CPKC have publicly said they will fight hard for concessions as the price of the merger going through. CN CFO Ghislain Houle told a Citi conference on Tuesday of last week: “We’ll be as aggressive as we can be on asking for remedies and concessions.” CPKC CEO Keith Creel described having a “robust” list of demands, including more access to UP’s network in St. Louis and Kansas City, and specifically access to Houston’s chemical alley, the massive refinery and petrochemical complex along the Houston Ship Channel, currently operated by a UP-BNSF joint venture with no direct CPKC connection. Creel made clear he wants one.
For its part, UP had initially budgeted $750 million for potential concessions, but CFO Jennifer Hamann said last week that the deal’s inherent benefits make such concessions unnecessary. “We don’t think they’re necessary to make our point and to drive better enhanced competition,” Hamann said. That position is going to be tested hard. The merger would cover about 55,000 miles of track and roughly half of US freight traffic, and the 2001 STB rules require the merging carriers to demonstrate that competition is enhanced, not merely preserved. That higher bar is exactly what CN and CPKC intend to exploit. For shippers of refined products and petrochemicals, the Houston access question is the one to watch. PFL clients with USGC petrochemical exposure should be paying close attention to what the STB ultimately requires here.
We are Watching Trucking
The truckload market is sending signals that should matter to everyone in intermodal. On Wednesday of last week, the Federal Motor Carrier Safety Administration announced it had issued notices of proposed removal to over 550 CDL training schools following a five-day sting operation involving more than 300 investigators across all 50 states. The sweep included 1,426 on-site inspections and found schools operating with fake addresses, unqualified instructors, vehicles that did not match the training offered, and failures to properly train drivers on hazardous materials transport. Another 109 providers voluntarily withdrew from the national Training Provider Registry the moment investigators arrived. Transportation Secretary Sean Duffy put it bluntly: “For too long, the trucking industry has operated like the Wild, Wild West.”
This follows a December purge that removed nearly 3,000 providers. The cumulative effect on the available driver pool is becoming measurable. J.B. Hunt management said at a Barclays investor conference Tuesday of last week that truck capacity has “notably tightened” and that the market remains firm even in what is seasonally the weakest demand period of the year, a combination you simply do not see at the bottom of a freight cycle. CFO Brad Delco described demand as trending “a little bit more positive” than the company had expected heading into the year, even without the demand-side help that would typically drive this kind of tightening.
For intermodal, this is the setup that practitioners have been waiting for after three years of freight recession. J.B. Hunt reported two-year stacked intermodal growth rates in the high single digits throughout 2025, with Q4 up 11%, and that growth happened during a period of excess truck capacity and low fuel prices. As those tailwinds reverse, the intermodal value proposition only gets stronger. NS’s new CMA CGM partnership, announced mid-week last week, offers a door-to-door “truck-like” intermodal product on West Coast-Midwest lanes under the Triple Crown brand, smart positioning for exactly this environment. PFL’s intermodal exposure stands to benefit if capacity tightening accelerates into spring bid season, as many in the market now expect.
We are Watching Key Economic Indicators
Gross Domestic Product (“GDP”)
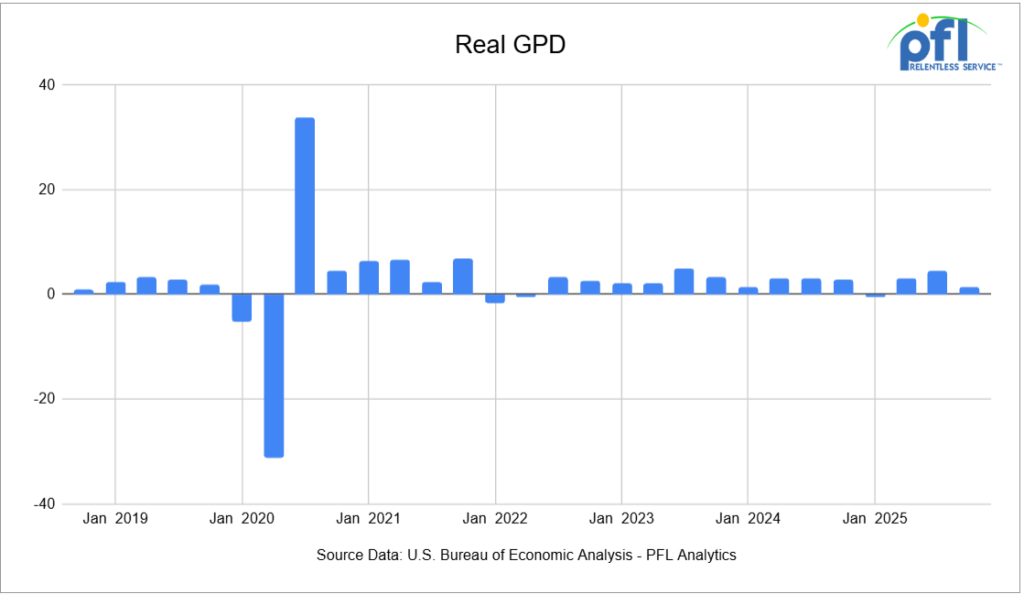
Real GDP in the United States grew at an annualized rate of 1.4% in the fourth quarter of 2025 (covering October through December), according to the advance estimate from the U.S. Bureau of Economic Analysis. This marks a notable slowdown from the 4.4% growth seen in Q3 2025, reflecting weaker government spending and export activity alongside still-positive consumer demand.
Consumer spending (measured by personal consumption expenditures) rose 2.4% in Q4 2025, down from a 3.5% pace in the previous quarter, and contributed approximately +1.6 percentage points to overall GDP growth. Investment also made a positive contribution, while government spending and exports declined, acting as a drag on overall growth. Imports fell, which provided a small positive effect on the GDP calculation because imports are subtracted in the GDP formula.
Consumer spending rose during the quarter, supported by gains in services such as healthcare and other non-durable sectors, though the pace of increase was lower compared with earlier in 2025. Other components of domestic demand—including fixed investment—added modestly to growth, but the overall slower pace of activity indicates weakening momentum at the end of the year.
Real final sales to private domestic purchasers (the sum of household consumption and fixed investment) increased 2.4% in Q4 2025, compared with a stronger 2.9% pace in Q3 2025, indicating that underlying private demand expanded at a more moderate rate late in the year but remained a notable contributor to economic activity.
On the price front, the price index for gross domestic purchases rose 3.7%, while the PCE price index increased 2.9% and core PCE (excluding food and energy) rose 2.7% in Q4. These inflation figures suggest persistent price pressures even as growth slowed.
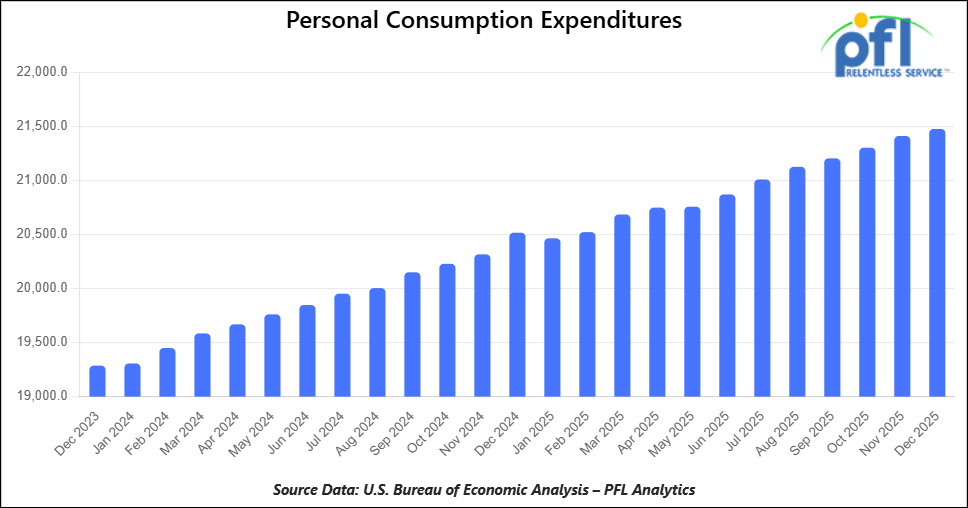
Consumer Spending
In December 2025, total consumer spending continued to expand, with personal consumption expenditures (PCE) rising 0.4 percent from November 2025, reflecting steady household demand late in the year. Current-dollar PCE increased by $91.0 billion, driven by a $98.5 billion rise in services outlays that more than offset a $7.5 billion decline in goods spending. Real (inflation-adjusted) PCE rose 0.1%in December.
The personal saving rate declined to 3.6 percent in December, down from September and early-fall levels, as consumer outlays continued to outpace growth in disposable income.
On inflation, the PCE price index — the Federal Reserve’s preferred inflation gauge — rose 0.4 percent month-over-month in December and 2.9 percent year-over-year, accelerating from earlier in the autumn. Excluding food and energy, the core PCE price index also rose 0.4 percent month-over-month and 3.0 percent year-over-year, indicating persistent underlying price pressures above the Fed’s long-run 2%target.
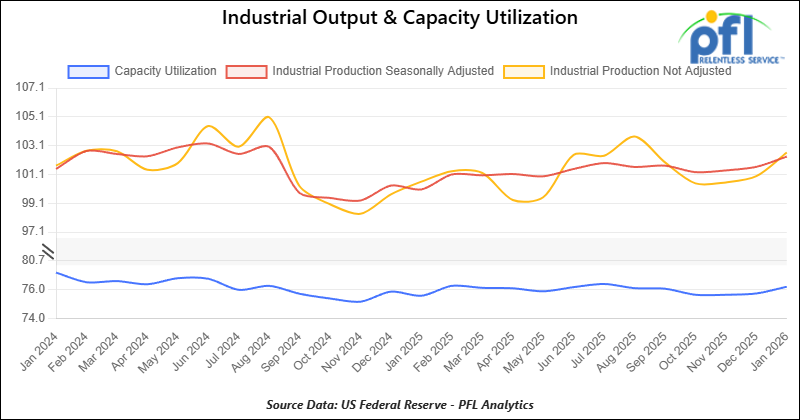
Industrial Output and Capacity Utilization
Manufacturing accounts for approximately 75% of total output. Manufacturing output in January 2026 was up 0.6% from December 2025. Overall industrial production rose 0.7% month-over-month in January 2026 after a 0.2% rise in December.
Capacity utilization is a measure of how fully firms are using machinery and equipment. Capacity utilization increased from December to January 2026 — total industry moved up to about 76.2% in January, and manufacturing utilization edged up to about 75.6%.
Lease Bids
- 100, 21.9K 117J Tanks located off of All Class 1s in Midwest. For use in CO2 service. Period: 6 months.
- 30-50, 30K 117J Tanks located off of NS or CSX in Northeast. For use in C5 service. Period: 1 year.
- 20-50, 4000-5000 Covered Hoppers located off of UP or BN in Houston. For use in Urea, Potash, Ammonium Sulfate service. Period: 6-12 Months.
- 200, 33K Pressure Tanks located off of CSX or NS in Ohio. For use in Propylene service. Period: 18 Months.
- 30-50, 25.5K Dot 111 Tanks located off of All Class 1s in Anywhere. For use in Asphalt service. Period: 1-3 Years.
Sales Bids
- 28, 3400CF Covered Hoppers located off of UP BN in Texas. For use in Cement service. Cement Gates needed.
- 20, 17K DOT111 Tanks located off of various class 1s in various locations. For use in corn syrup service.
- 120, Various Open-Top Aluminum Rotary Gondolas located off of various class 1s in various locations. For use in Sulphur service. Built 2004 or later.
- 30, 29K DOT111 Tanks located off of various class 1s in Chicago. For use in Veg Oil service.
Lease Offers
- 100, 30K CPC1232 Tanks located off of UP or BN in Texas. Last used in Diesel.
- 100, 30K DOT117R Tanks located off of UP or BN in Texas. Last used in Gasoline.
- 100, 29K DOT117R Tanks located off of UP or BN in Texas. Last used in Gasoline. Coiled and Insulated.
- 21, 6351 Covered Hoppers located off of CN in Wisconsin. Last used in DDG. Available until February 2027.
- 29, 6500 Covered Hoppers located off of CN in Wisconsin. Last used in DDG. Available until February 2027.
- 50, 20K DOT117J Tanks located off of All Class 1s in Moving. Last used in Styrene.
- 29, 25.5K DOT117J Tanks located off of UP or BN in Texas. Cars are currently clean. Cars are currently clean.
- 90, 30K DOT117J Tanks located off of UP or BN in Corpus Christie. Last used in Diesel.
- 200, 340W DOT 112J Tanks located off of All Class 1s in Multiple Locations. Last used in Propane and Butane. Cars are currently clean.
- 15, 6200CF Covered Hoppers located off of All Class 1s in Wisconsin. Last used in Plastic. Cars are currently clean.
- 30, 6500CF Covered Hoppers located off of All Class 1s in Wisconsin. Last used in Plastic. Cars are currently clean.
- 50, 30K DOT117J Tanks located off of UP or BN in Corpus Christie. Last used in Gasoline.
- 24, 21K Stainless Steel Tanks located off of UP in Texas / Mexico Border. Last used in SULFACTANT. Cars are currently clean.
- 34, 30K DOT 111 Tanks located off of UP in Texas / Mexico Border. Last used in Veg Oil. Cars are currently clean.
Sales Offers
- 50, 31.8K CPC1232 Tanks located off of UP or BN in TX. Last used in Multiple. Requal Due in 2025.
- 35, 3400CF Covered Hoppers located off of UP or BN in Midwest. Last used in Sand.
- 25, 30K 117J Tanks located off of CSX in Jackson, TN. Last used in Fuels. Newly Requalified.
Call PFL today to discuss your needs and our availability and market reach. Whether you are looking to lease cars, lease out cars, buy cars, or sell cars call PFL today at 239-390-2885
Live Railcar Markets
| CAT | Type | Capacity | GRL | QTY | LOC | Class | Prev. Use | Offer | Note |
|---|
PFL will be at the Following Conferences

- Where: Loews Arlington Hotel
- Attending: Brian Baker (239.297.4519), David Cohen (954-729-4774), and Curtis Chandler (239-405-3365)
- Conference Website

- Where: The Westin Galleria Dallas
- Attending: David Cohen (954-729-4774), and Curtis Chandler (239-405-3365)
- Conference Website

- Where: The Westin Galleria Dallas
- Attending: Brian Baker (239.297.4519)
- Conference Website