
“All of us, at certain moments of our lives, need to take advice and to receive help from other people.” – Alexis Carrel
Jobs Update
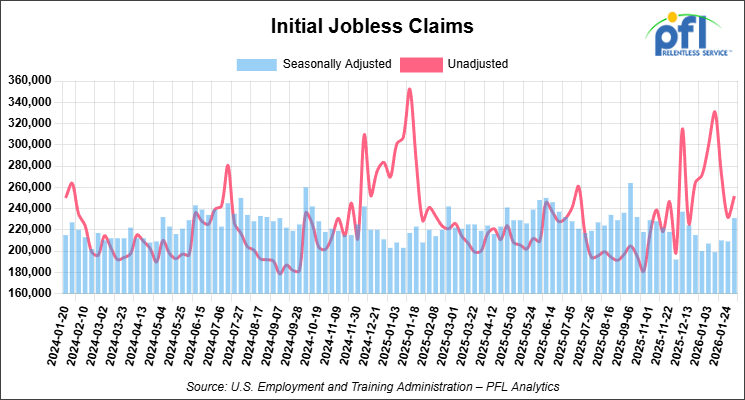
- Initial jobless claims seasonally adjusted for the week ending January 31, 2026 came in at 231,000, versus the adjusted number of 209,000 people from the week prior, up 22,000 people week over week.
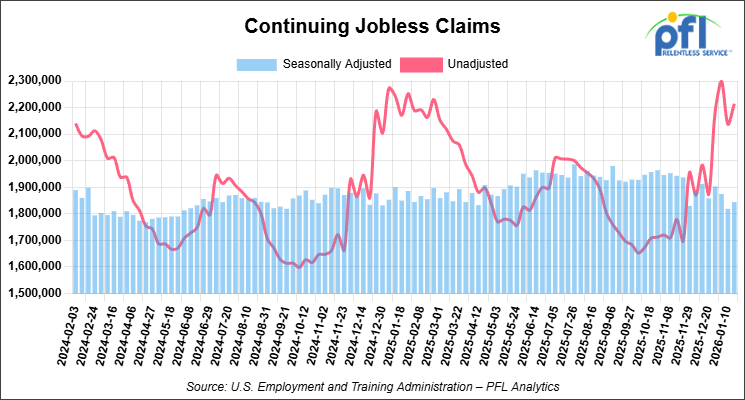
- Continuing jobless claims came in at 1,844,000, versus the adjusted number of 1,819,000 people from the week prior, up 25,000 week-over-week.
Stocks closed higher on Friday of last week and mixed week-over-week
The DOW closed higher on Friday of last week, up 1,206.95 points (2.47%), closing out the week at 50,115.67, up 1,223.20 points week-over-week. The S&P 500 closed higher on Friday of last week, up 133.90 points (1.97%), and closed out the week at 6,932.30, down -6.73 points week-over-week. The NASDAQ closed higher on Friday of last week, up 490.63 points (2.18%), and closed out the week at 23,031.21, down -430.61 points week-over-week.
In overnight trading, DOW futures traded higher and are expected to open at 50,156 this morning, down 49 points from Friday’s close.
Crude oil closed higher on Friday of last week and lower week-over-week
West Texas Intermediate (WTI) crude closed up 26 cents per barrel (0.4%), to close at $63.55 on Friday of last week, but down $1.66 week-over-week. Brent crude closed up 50 cents per barrel (0.7%), to close at $68.05, but down $2.64 week-over-week.
One Exchange WCS (Western Canadian Select) for March delivery settled on Friday of last week at US$15.30 below the WTI-CMA (West Texas Intermediate – Calendar Month Average). The implied value was US$47.62 per barrel.
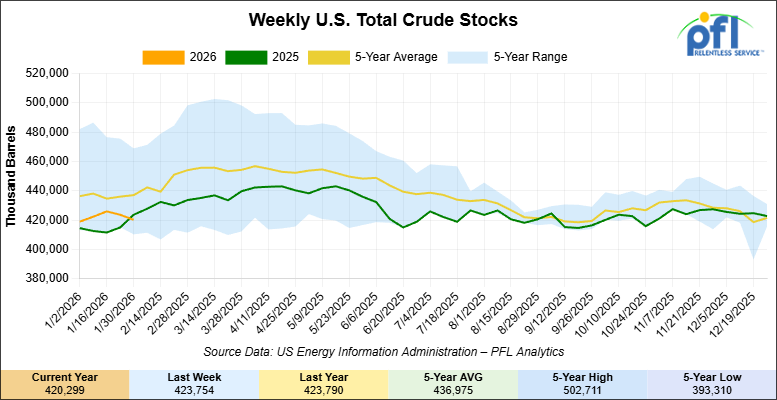
U.S. commercial crude oil inventories (excluding those in the Strategic Petroleum Reserve) decreased by 3.5 million barrels week-over-week. At 420.3 million barrels, U.S. crude oil inventories are 4% below the five-year average for this time of year.
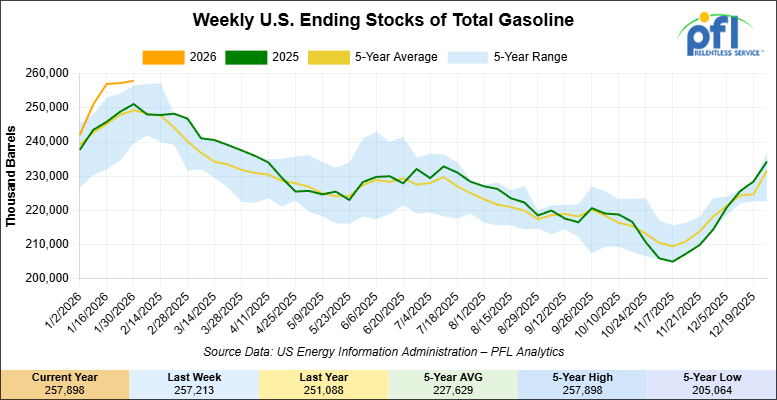
Total motor gasoline inventories increased by 700,000 barrels week-over-week and are 4% above the five-year average for this time of year.
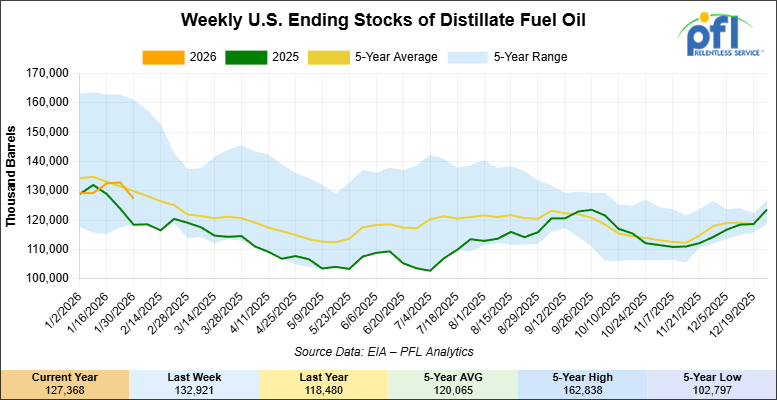
Distillate fuel inventories decreased by 5.6 million barrels week-over-week and are 2% below the five-year average for this time of year.
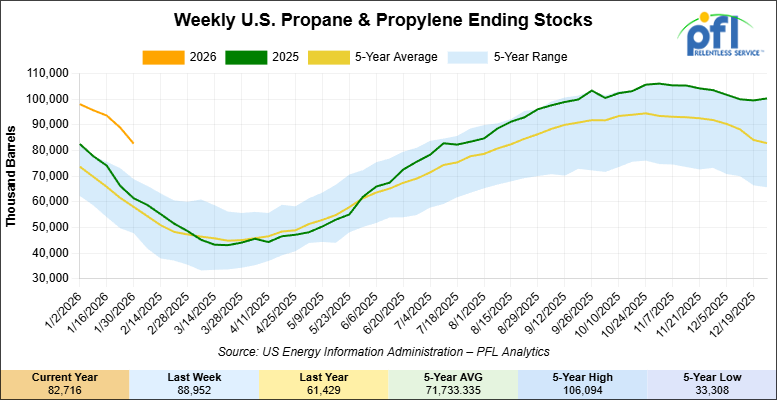
Propane/propylene inventories decreased 6.2 million barrels week-over-week and are 37% above the five-year average for this time of year.
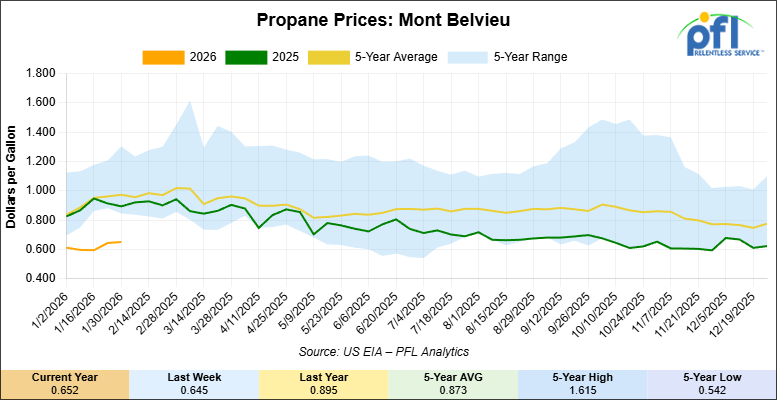
Propane prices closed at 65.2 cents per gallon on Friday of last week, up 0.7 cents per gallon week-over-week, but down 24.3 cents year-over-year.
Overall, total commercial petroleum inventories decreased by 25.3 million barrels week-over-week, during the week ending January 30, 2026.
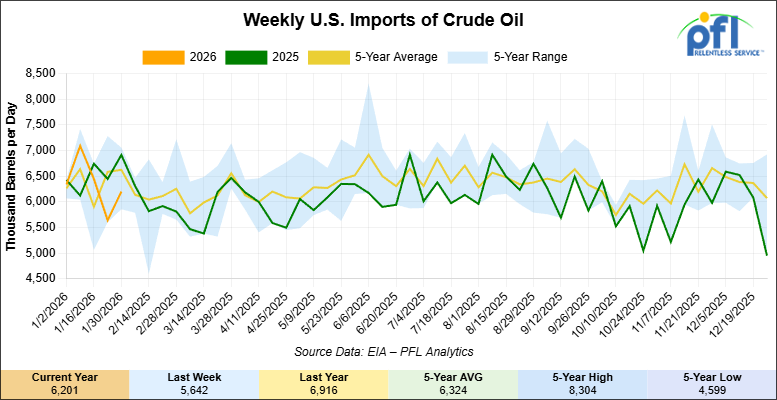
U.S. crude oil imports averaged 6.2 million barrels per day last week, an increase of 558,000 barrels per day week-over-week. Over the past four weeks, crude oil imports averaged 6.3 million barrels per day, 3.2% less than the same four-week period last year. Total motor gasoline imports (including both finished gasoline and gasoline blending components) averaged 394,000 barrels per day, and distillate fuel imports averaged 197,000 barrels per day during the week ending January 30, 2026.
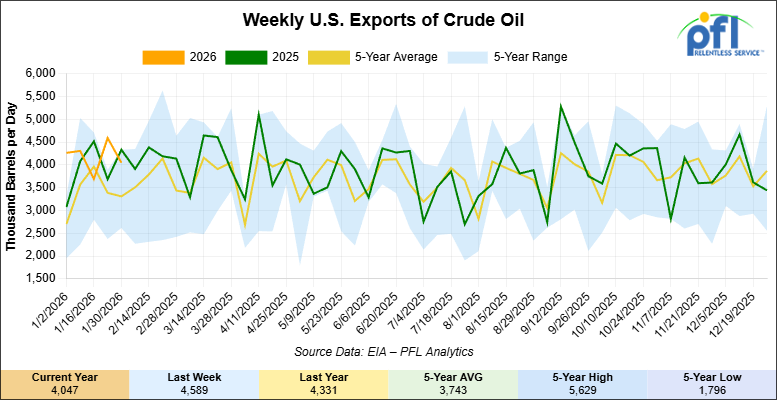
U.S. crude oil exports averaged 4.047 million barrels per day during the week ending January 30, 2026, a decrease of 542,000 barrels per day week-over-week. Over the past four weeks, crude oil exports averaged 4.158 million barrels per day.
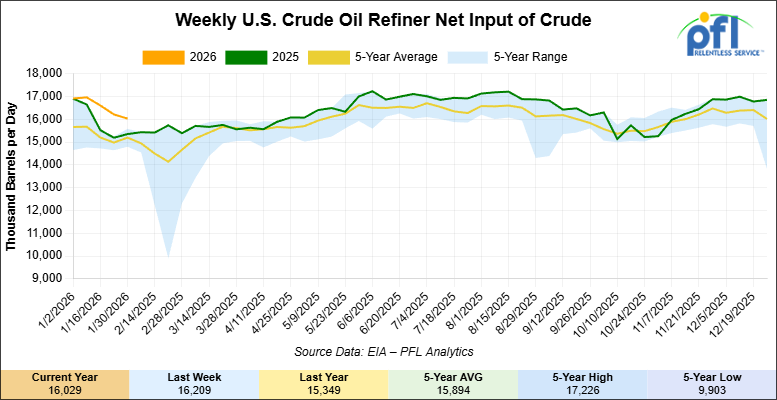
U.S. crude oil refinery inputs averaged 16 million barrels per day during the week ending January 30, 2026, which was 180,000 barrels per day less week-over-week.
WTI is poised to open at $63.37, up 22 cents per barrel from Friday’s close.
North American Rail Traffic
Week Ending February 4, 2026:
Total North American weekly rail volumes were down (-16.10%) in week 6, compared with the same week last year. Total Carloads for the week ending February 4, 2026 were 278,308, down (-14.95%) compared with the same week in 2025, while weekly Intermodal volume was 293,079, down (-17.17%) year over year. 11 of the AAR’s 11 major traffic categories posted year-over-year decreases. The largest decrease came from Nonmetallic Minerals (-28.68%).
In the East, CSX’s total volumes were down (-9.99%), with the largest decrease coming from Motor Vehicles and Parts (-31.46%), while the largest increase came from Petroleum & Petroleum Products (+15.36%). NS’s total volumes were down (-21.64%), with the largest decrease coming from Motor Vehicles and Parts (-33.03%).
In the West, BNSF’s total volumes were down (-11.64%), with the largest increase coming from Grain (+11.81%), while the largest decrease came from Nonmetallic Minerals (-44.86%). UP’s total volumes were down (-14.86%), with the largest increase coming from Other (+11.46%), while the largest decrease came from Nonmetallic Minerals (-24.70%).
In Canada, CN’s total volumes were down (-18.93%), with the largest increase coming from Farm Products (+17.01%), while the largest decrease came from Intermodal Units (-35.93%). CPKCS’s total volumes were down (-35.14%), with the largest decrease coming from Forest Products (-75.24%).
Source Data: AAR – PFL Analytics
North American Rig Count Summary
Rig Count
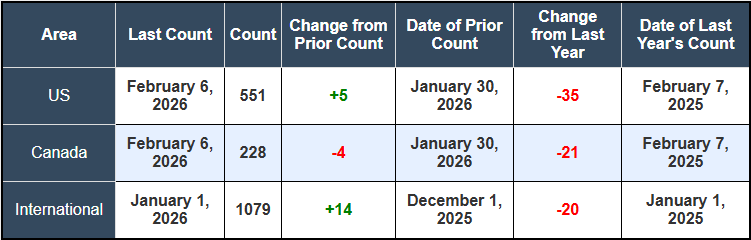
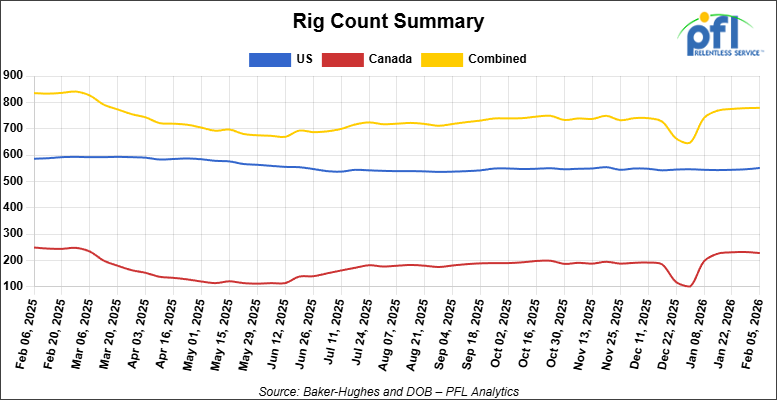
North American rig count was up by +1 rig week-over-week. The US rig count was up by +5 rigs week-over-week, and down by -35 rigs year-over-year. The US currently has 551 active rigs. Canada’s rig count was down by -4 rigs week-over-week and down by -21 rigs year-over-year. Canada currently has 228 active rigs. Overall, year-over-year we are down by -56 rigs collectively.
International rig count was up by +14 rigs month-over-month and down by -20 rigs year-over-year. Internationally there are 1079 active rigs
We are watching a few things out there for you:
We are Watching Petroleum Carloads
The four-week rolling average of petroleum carloads carried on the six largest North American railroads rose to 29,625 from 29,429 which was a increase of +196 rail cars week-over-week. Canadian volumes were mixed. CN’s shipments were higher by +4.0% week-over-week, CPKC’s volumes were lower by -12.0% week-over-week. U.S. shipments were mostly higher. The CSX had the largest percentage increase and was up by +8.0%. The NS was the sole decliner and was down by -4.0%.
We are Watching BP
United Steelworkers members at BP’s 440,000 barrels-per-day Whiting, Indiana refinery voted last week to reject the company’s proposed 28-day extension of their existing labor contract. The contract expired on February 1st. Union leaders have activated strike and lockout plans as a precaution but emphasized that no immediate work stoppage is planned. Both sides are continuing to negotiate.
Key points of contention reportedly include proposed job reductions, seniority provisions, layoff procedures, and wage terms. BP reemphasized its commitment to negotiating in good faith “to strengthen business competitiveness and create long-term sustainability.” Neither BP nor USW Local 7-1 has provided further public comment as negotiations continue.
Whiting is one of the largest refineries in the Midwest and a critical supplier to the region. Any prolonged disruption would tighten refined product supply across the Great Lakes and Upper Midwest, potentially boosting margins for competing refineries but straining logistics networks. For rail operators, a work stoppage could reduce crude inbound volumes but increase refined product movements as distributors scramble for supply from alternative sources.
Labor disputes at major refineries rarely escalate to full strikes, both sides understand the economic stakes, but the threat alone can create spot market volatility. PFL is keeping an eye on this one.
We are Watching Trans Mountain Pipeline
Trans Mountain applied to the Canada Energy Regulator last week to install drag reducing agent (DRA) equipment at 12 existing pump stations along its Line 1 and Line 2 pipelines. The $9 million project would add up to 90,000 barrels per day of throughput capacity – roughly 10 per cent above the system’s current 890,000 bpd—without building a single inch of new pipe. Construction is slated to begin in August with operations starting by January 2027.
DRA is a chemical additive that reduces friction inside the pipeline, a proven technology used globally in the industry. Each installation involves dropping in a pre-fabricated building roughly 3 meters by 12 meters inside the existing fence line at pump stations like Hinton, Rearguard, Blue River, and Black Pines. Work at each site takes about two weeks; the entire project wraps in eight months. No new land acquisition, no environmental disturbance beyond the fence line.
This is the first of three expansion projects Trans Mountain is pursuing. The second involves constructing additional pump stations to unlock another 360,000 bpd within the next five years. The third is dredging Vancouver’s Second Narrows to allow Aframax tankers to load to full capacity at Westridge, currently limited to 70%due to shallow navigation channels.
Folks, Alberta is going to hit a wall on pipeline capacity sooner than most think. Provincial crude production climbed 166,000 bpd last year to 4.1 million bpd and the oil sands aren’t done growing. Trans Mountain’s incremental expansions are the cheapest, fastest way to keep barrels flowing to tidewater before differentials blow out again.
Rail will stay relevant for stranded barrels and raw bitumen.
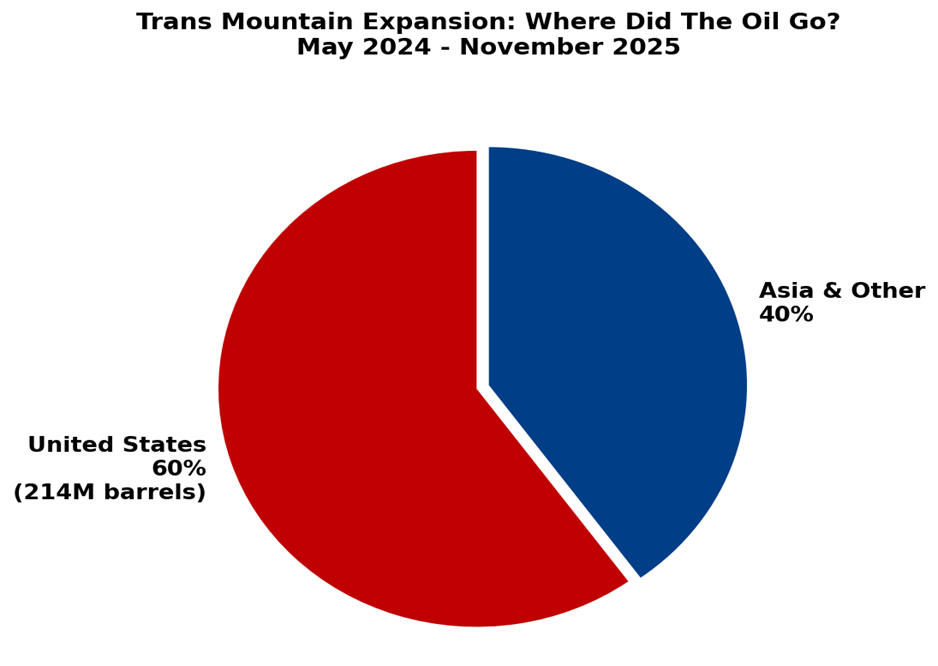
For some background, in the first 19 months of operations following the May 2024 completion of the Trans Mountain Expansion, an average of 60 per cent of the new oil export capacity served U.S. consumers, according to government documents obtained by Canada’s New Democratic Party. (a far left wing leading federal party). At least 214 million barrels of oil passed through the TMX expansion destined for the United States between May 2024 and November 2025.
For the rail sector, the numbers confirm what we’ve known all along: the U.S. Gulf Coast remains the primary destination for Canadian heavy crude. Trans Mountain’s spare capacity to Asia means pipeline competition for crude-by-rail remains intense in the near term. But if Alberta production continues to grow (it hit 4.1 million bpd in 2025) up 166,000 bpd year-over-year, and pipeline expansions lag, rail will be the marginal outlet once again. The fact that 60% of TMX volumes still flow to established U.S. refineries also confirms that pricing dynamics and refinery configurations continue to favor Gulf Coast markets over newer Asian buyers. Rail serves both markets: stranded barrels to U.S. refineries when pipelines are full, and opportunistic movements to Asia when premiums justify the economics.
Source: Canada Development Investment Corporation – PFL Analytics
We are Watching the UP and NS
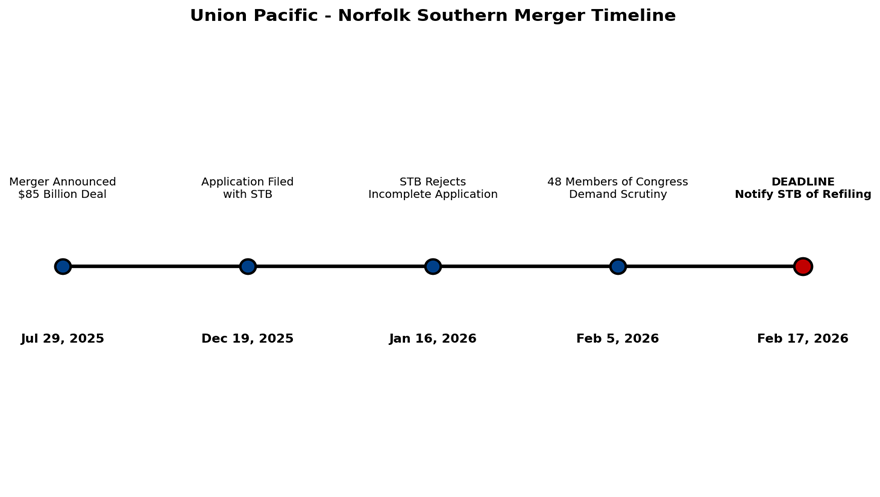
Forty-eight members of Congress sent a letter to the Surface Transportation Board on Wednesday, February 5, urging “rigorous and comprehensive review” of Union Pacific’s proposed $85 billion acquisition of Norfolk Southern. Representative Dusty Johnson (R-SD), who led the effort, made his position crystal clear: “I am inherently skeptical that consolidation in any market leads to better outcomes for customers.” The bipartisan letter warned that further rail consolidation could drive up prices for farmers, shippers, and consumers while degrading service quality across the network.
The political pressure comes as UP and NS face a critical deadline. The STB unanimously rejected their initial merger application on January 16th, ruling it incomplete because it lacked required market share projections and full copies of the merger agreement. The railroads have until Tuesday, February 17th to inform the STB whether they plan to refile. Any revised application must be submitted by June 22nd. Union Pacific CEO Jim Vena has called the rejection a “short-term blip” and insists the deal will still close in the first half of 2027 as originally planned.
This is the first major Class I merger to be evaluated under the STB’s tougher 2001 rules, which require that any combination enhance competition, not just maintain it. The proposed transaction would create the first true transcontinental railroad, linking the Pacific Coast directly to the Atlantic Seaboard and effectively ending the “Chicago Interchange” where freight changes hands between eastern and western carriers. The combined entity would control nearly half of U.S. rail freight, a level of concentration that has shipper groups, competing railroads, and now Congress is pushing back hard.
Opposition extends well beyond the 48 House members. Senate Minority Leader Chuck Schumer has condemned the merger as a “hostile takeover of America’s infrastructure” that threatens “dangerous consolidation and monopoly power.” All four competing Class I railroads—BNSF, CSX, Canadian National, and CPKC—have filed comments opposing the deal. Agricultural associations and other shipper groups have expressed alarm over potential rate increases and service degradation, particularly for captive shippers with no alternative rail access.
The stakes are enormous. Union Pacific’s merger agreement includes a $2.5 billion reverse termination fee payable to Norfolk Southern if the STB rejects the deal or imposes conditions too onerous to accept. For the railcar industry, approval would fundamentally reshape routing options, service commitments, and competitive dynamics across North America. The STB’s handling of this case will set the template for any future Class I consolidation—assuming there are any railroads left to merge. With Congress now formally weighing in and the February 17th deadline looming, the pressure on Union Pacific to deliver a complete application has never been higher.
Source: Surface Transportation Board – PFL Analytics
We are Watching CPKC
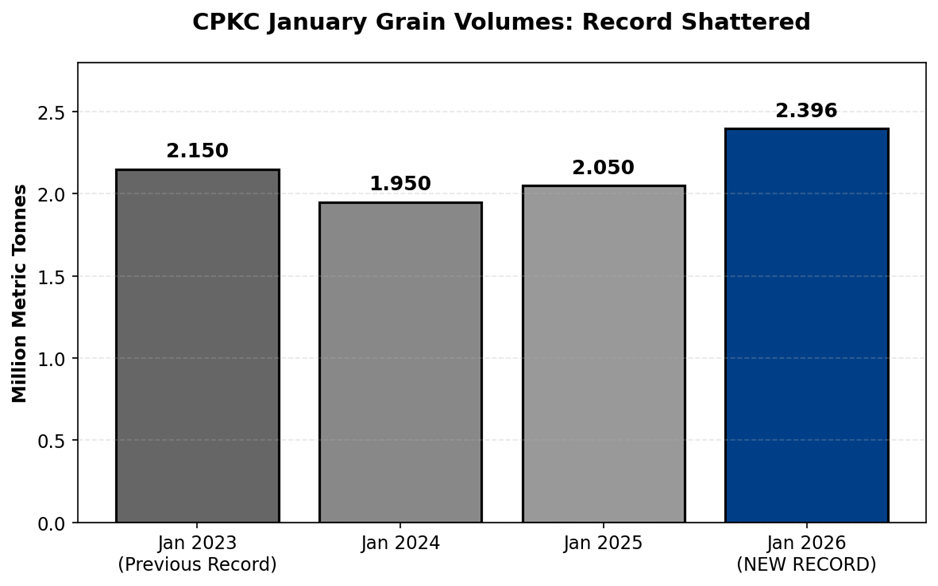
January is typically one of the toughest months for grain movements. Colder temperatures increase diluent demand for oil sands bitumen, creating competition for rail capacity. Despite that, both CPKC and CN delivered record or near-record volumes. CN reported its second-best January on record at 2.72 million metric tonnes, just short of the 2.85 million tonne record from January 2020.
The railways are running flat out. CPKC noted that “all members of the grain supply chain continue operating at full capacity to maintain momentum”—industry speak for ‘we’re maxed out.’ CN credited operational adjustments and its 2025-2026 Winter Plan for keeping service levels up during extreme cold. Both carriers exceeded their supply chain capacity targets in their annual grain service plans.
Record winter grain movements signal tight capacity heading into spring when export programs intensify and domestic movements for livestock feed and processing ramp up. Add in Carney’s China trade deal—which slashed tariffs on Canadian canola from 84%to 15%and eliminated 100% of tariffs on canola meal – and you’ve got strong demand ahead. Canola is one of Western Canada’s largest rail export commodities, and tariff relief should support robust carload volumes to Pacific ports as China resumes large-scale purchases.
For hopper car lessors, this translates to sustained utilization and limited availability for spot movements. CPKC is investing C$500 million in high-capacity hopper cars and 100 new Tier 4 locomotives for the 2025-2026 grain year, planning to move up to 34 million metric tonnes based on current crop forecasts. CN is targeting 27-29.5 million metric tonnes. Over 90%of agricultural products in Canada move by rail—grain is the single largest commodity segment. When the system runs this hot, everyone with cars in the fleet benefits.
We are Watching CT Derailment Put Safety Back in the Headlines
Ten to fourteen freight cars derailed last Thursday morning in Mansfield, Connecticut near Route 32, with four cars carrying liquid propane ending up in the Willimantic River. The New England Central Railroad train was hauling 41 cars total when the rear cars detached around 9:20 a.m. Six of the derailed cars carried liquid propane; others were loaded with lumber, grain, and food-grade grease. One grease car leaked about 2,500 gallons, but it was contained. No propane leaks were detected as of midday Thursday.
Authorities issued a shelter-in-place order for residents within a half mile of the site. The cleanup is expected to take several days given the hard-to-reach location and frigid conditions. Cranes and specialized equipment began arriving Thursday evening. No injuries were reported, though the conductor and engineer were aboard when it happened.
Derailments remain the most common type of rail accident, accounting for 71% of all incidents reported to the FRA since 1975. The number has declined from a 1970s peak of 9,400 per year, but roughly 1,300 trains still derail annually in the United States. The FRA testified to Congress that there’s been “stagnation in railroads’ safety performance” and incidents like East Palestine in February 2023 are not isolated. Nearly 70% of derailments occur in urban areas, affecting more than 12,000 cities, towns, and villages along the nation’s 140,000-mile rail network.
We are Watching the U.S. Department of Treasury
The U.S. Department of Treasury and Internal Revenue Service released proposed regulations last Monday for the 45Z clean fuel production tax credit, as updated by the One Big Beautiful Bill in mid-2025. A 60-day public comment period is open, with a public hearing scheduled for May 28th.
The proposed regulations confirm that transportation fuel produced after December 31, 2025 must be exclusively derived from feedstock produced or grown in the United States, Mexico, or Canada to qualify for 45Z. The credit starts at 20 cents per gallon for non-aviation fuels and 35 cents per gallon for sustainable aviation fuel (SAF) for fuel produced on or before December 31, 2025. For facilities meeting prevailing wage and apprenticeship requirements, the credit jumps to $1 per gallon for non-aviation fuels and $1.75 per gallon for SAF.
The SAF premium was eliminated as of January 1, 2026, capping the credit at 20 cents per gallon/$1 per gallon for all eligible fuels depending on whether wage requirements are met. The credit adjusts annually for inflation; the IRS announced in July 2025 that the inflation adjustment factor for calendar year 2025 boosts the credit to 21 cents and $1.06 per gallon for non-SAF fuels and 37 cents and $1.86 per gallon for SAF. The 2026 inflation factor has not yet been announced.
The proposed regulations also confirm the 45Z credit cannot be stacked with the 45Q tax credit for carbon capture, utilization and storage (CCUS). Eligible fuel must have lifecycle greenhouse gas emissions of no greater than 50 kilograms of CO2e per mmBtu, and cannot be produced from a fuel for which a section 45Z credit is allowable (i.e., no double-dipping on renewable diesel made from ethanol that already claimed 45Z).
For renewable natural gas (RNG), the proposed guidance specifies that the 45Z credit should be claimed by the processor that produces the fuel, not the party that compresses the resulting RNG. Similarly, for liquid fuels, the credit goes to the fuel producer, not the fuel blender. Electricity is not considered an eligible transportation fuel for 45Z purposes.
The regulations eliminate indirect land use change (ILUC) from lifecycle greenhouse gas emission calculations for fuels produced after December 31, 2025, as directed by the One Big Beautiful Bill. This is significant for corn ethanol and soy-based biodiesel, which faced high ILUC penalties under previous frameworks. The proposal also indicates that lifecycle greenhouse gas emissions rates for fuel derived from animal manure may be less than zero starting in 2026, a potential boon for biogas projects tied to livestock operations.
The IRS is seeking stakeholder input on feedstock tracking to ensure only fuels derived from feedstocks produced or grown in the U.S., Canada, and Mexico qualify. The Treasury Department and IRS are considering substantiation and recordkeeping requirements for feedstocks imported from Canada and Mexico, including used cooking oil (UCO), and request comments on possible approaches that minimize taxpayer burden while remaining administrable.
These regulations solidify the economic incentives for domestic renewable fuel production using North American feedstocks. Expect continued strong demand for railcar movements of vegetable oils, animal fats, UCO, and ethanol to renewable diesel and SAF production facilities. The elimination of ILUC and the potential for sub-zero carbon intensity scores for manure-based biogas make certain feedstocks significantly more valuable, which could drive new production facilities and logistics routes. Rail will play a key role in moving these feedstocks and finished fuels, particularly for facilities without pipeline access.
We are Watching Key Economic Indicators
Purchasing Managers Index (PMI)
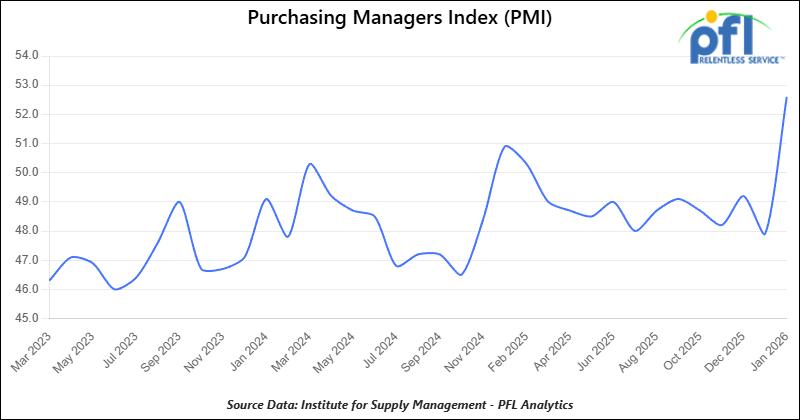
The Institute for Supply Management releases two PMI reports – one covering manufacturing and the other covering services. These reports are based on surveys of supply managers across the country and track changes in business activity. A reading above 50% on the index indicates expansion, while a reading below 50% signifies contraction, with a faster pace of change the farther the reading is from 50.
The Manufacturing PMI in January 2026 was 52.6%, up from 47.9% in December, moving back into expansion territory after an extended contraction and marking the highest reading since August 2022. On the Services PMI side, the most recent reading is 54.4% (December 2025), up from 52.6% in November, signaling continued expansion in the services sector at its strongest pace in over a year.
Lease Bids
- 30-50, 6000cf Steel Hopper located off of CSX or NS in East. For use in petcoke service. Period: 5 Years.
- 10, 2500CF Open Top Hopper located off of UP or BN in Texas. For use in aggregate service. Period: 5 years. Need Rapid Discharge Doors.
- 100, 21.9K 117J Tank located off of All Class 1s in Midwest. For use in CO2 service. Period: 6 months.
- 30-50, 30K 117J Tank located off of NS or CSX in Northeast. For use in C5 service. Period: 1 year.
- 20-50, 4000-5000 Covered Hopper located off of UP or BN in Houston. For use in Urea, Potash, Ammonium Sulfate service. Period: 6-12 Months.
Sales Bids
- 28, 3400CF Hopper Covered located off of UP BN in Texas. For use in Cement service. Cement Gates needed.
- 20, 17K Tank DOT111 located off of various class 1s in various locations. For use in corn syrup service.
- 120, Various Gondola Open-Top Aluminum Rotary located off of various class 1s in various locations. For use in Sulphur service. Built 2004 or later.
- 30, 29K Tank DOT111 located off of various class 1s in Chicago. For use in Veg Oil service.
Lease Offers
- 100, 30K CPC1232 Tanks located off of UP or BN in Texas. Last used in Diesel.
- 100, 30K DOT117J Tanks located off of UP or BN in Texas. Last used in Gasoline.
- 100, 29K DOT117J Tanks located off of UP or BN in Texas. Last used in Gasoline. Coiled and Insulated.
- 21, 6351 Covered Hopper located off of CN in Wisconsin. Last used in DDG. Available until February 2027.
- 29, 6500 Covered Hopper located off of CN in Wisconsin. Last used in DDG. Available until February 2027.
- 50, 20K DOT117J Tank located off of All Class 1s in Moving. Last used in Styrene.
- 29, 25.5K DOT117J Tank located off of UP or BN in Texas. Cars are currently clean. Cars are currently clean.
- 90, 30K DOT117J Tank located off of UP or BN in Corpus Christie. Last used in Diesel.
- 200, 340W DOT 112J Tank located off of All Class 1s in Multiple Locations. Last used in Propane and Butane. Cars are currently clean.
- 15, 6200CF Covered Hopper located off of All Class 1s in Wisconsin. Last used in Plastic. Cars are currently clean.
- 30, 6500CF Covered Hopper located off of All Class 1s in Wisconsin. Last used in Plastic. Cars are currently clean.
Sales Offers
- 50, 31.8K CPC1232 Tanks located off of UP or BN in TX. Last used in Multiple. Requal Due in 2025.
- 100, 4600CF Open Top Hoppers located off of BN or CSX in Southeast. Last used in Coal.
- 35, 3400CF Covered Hoppers located off of UP or BN in Midwest. Last used in Sand.
- 25, 30K 117J Tanks located off of CSX in Jackson, TN. Last used in Fuels. Newly Requalified.
Call PFL today to discuss your needs and our availability and market reach. Whether you are looking to lease cars, lease out cars, buy cars, or sell cars call PFL today at 239-390-2885
Live Railcar Markets
| CAT | Type | Capacity | GRL | QTY | LOC | Class | Prev. Use | Offer | Note |
|---|
PFL will be at the Following Conferences

- Where: Loews Arlington Hotel
- Attending: Brian Baker (239.297.4519), David Cohen (954-729-4774), and Curtis Chandler (239-405-3365)
- Conference Website

- Where: The Westin Galleria Dallas
- Attending: David Cohen (954-729-4774), and Curtis Chandler (239-405-3365)
- Conference Website

- Where: The Westin Galleria Dallas
- Attending: Brian Baker (239.297.4519)
- Conference Website