
“The power to question is the basis of all human progress.” – Indira Gandhi
Jobs Update
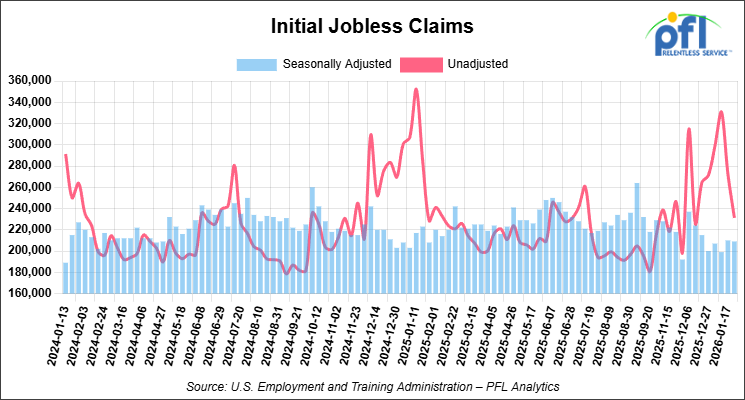
- Initial jobless claims seasonally adjusted for the week ending January 24, 2026 came in at 209,000, versus the adjusted number of 210,000 people from the week prior, down 1,000 people week over week.
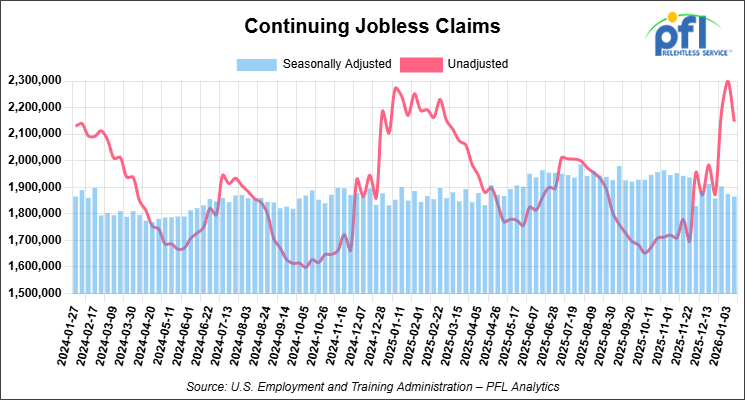
- Continuing jobless claims came in at 1,865,000, versus the adjusted number of 1,875,000 people from the week prior, down 10,000 week-over-week.
Stocks closed lower on Friday of last week and mixed week-over-week
The DOW closed lower on Friday of last week, down -179.09 points (-0.36%), closing out the week at 48,892.47, down -206.24 points week-over-week. The S&P 500 closed lower on Friday of last week, down -29.98 points (-0.43%), and closed out the week at 6,939.03, up 23.42 points week-over-week. The NASDAQ closed lower on Friday of last week, down -223.30 points (-0.94%), and closed out the week at 23,461.82, down -39.42 points week-over-week.
In overnight trading, DOW futures traded lower and are expected to open at 48,951 this morning down -57 points.
Crude oil closed lower on Friday of last week and higher week-over-week
West Texas Intermediate (WTI) crude closed down -0.21 per barrel (-0.32%), to close at $65.21 on Friday of last week, but up $4.14 week-over-week. Brent crude closed down -0.02 per barrel (-0.03%), to close at $70.69, but up $4.81 week-over-week.
One Exchange WCS (Western Canadian Select) for March delivery settled on Friday of last week at US$14.50 below the WTI-CMA (West Texas Intermediate – Calendar Month Average). The implied value was US$50.62 per barrel.
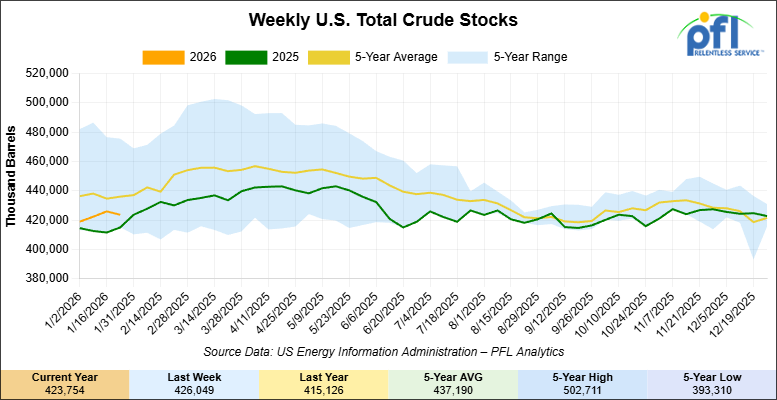
U.S. commercial crude oil inventories (excluding those in the Strategic Petroleum Reserve) decreased by 2.3 million barrels week-over-week. At 423.8 million barrels, U.S. crude oil inventories are 3% below the five-year average for this time of year.
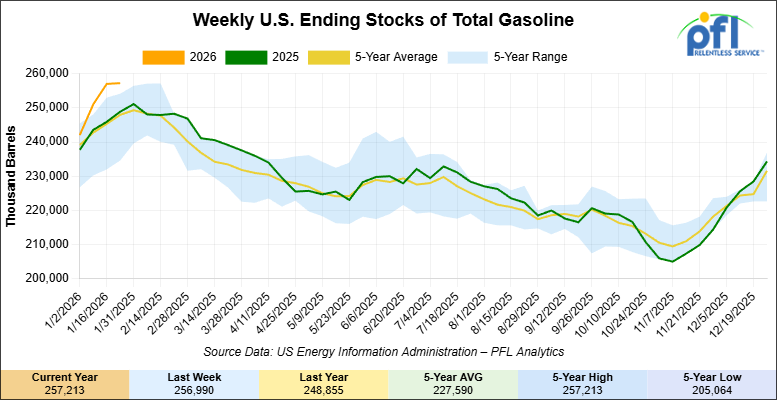
Total motor gasoline inventories increased by 200,000 barrels week-over-week and are 5% above the five-year average for this time of year.
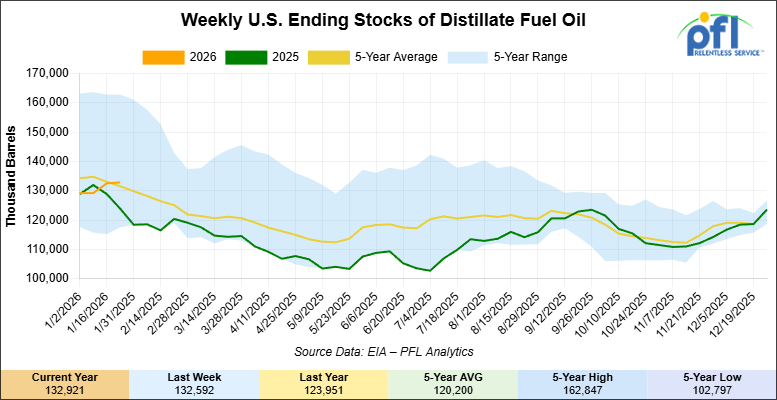
Distillate fuel inventories increased by 300,000 barrels week-over-week and are 1% above the five-year average for this time of year.
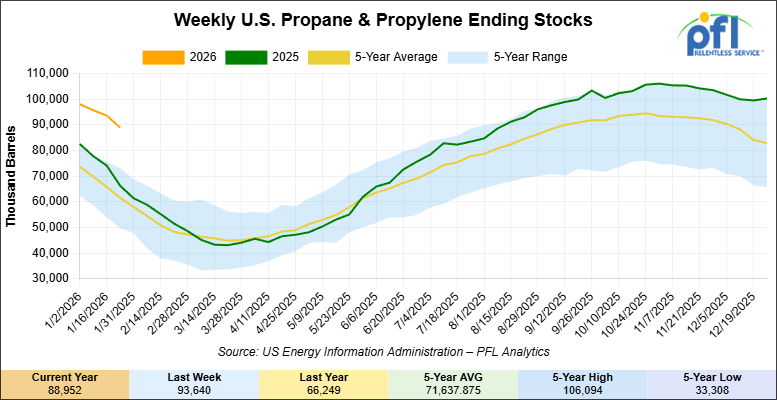
Propane/propylene inventories decreased 4.7 million barrels week-over-week and are 41% above the five-year average for this time of year.
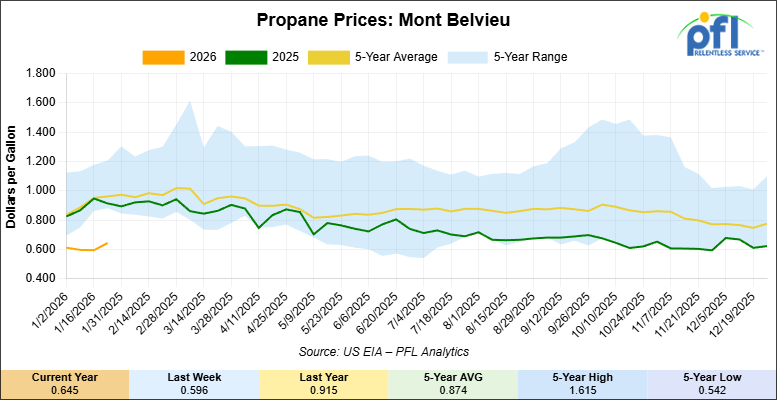
Propane prices closed at 64.5 cents per gallon on Friday of last week, up 4.9 cents per gallon week-over-week, but down 27 cents year-over-year.
Overall, total commercial petroleum inventories decreased by 6.8 million barrels week-over-week, during the week ending January 23, 2026.
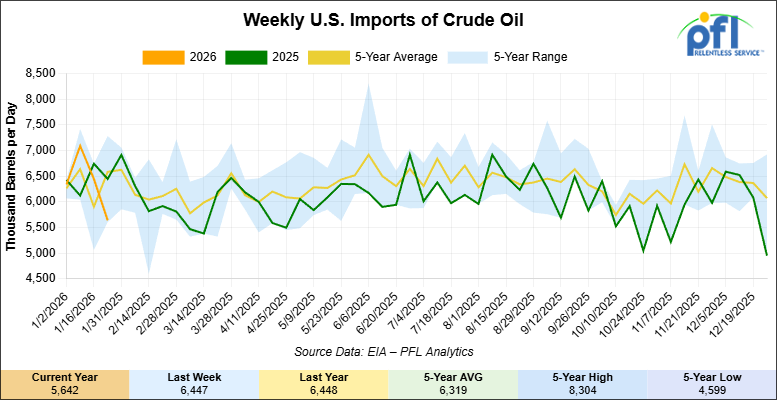
U.S. crude oil imports averaged 5.6 million barrels per day during the week ending January 23, 2026, a decrease of 804,000 barrels per day week-over-week. Over the past four weeks, crude oil imports averaged 6.4 million barrels per day, 0.9% less than the same four-week period last year. Total motor gasoline imports (including both finished gasoline and gasoline blending components) averaged 364,000 barrels per day, and distillate fuel imports averaged 253,000 barrels per day during the week ending January 23, 2026.
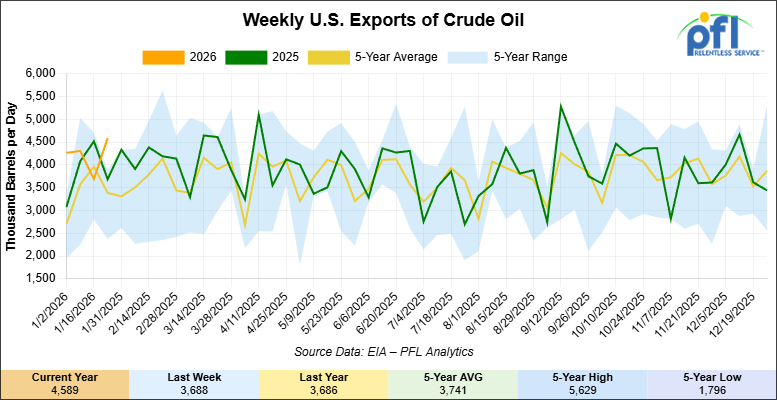
U.S. crude oil exports averaged 4.589 million barrels per day during the week ending January 23, 2026, an increase of 901,000 barrels per day week-over-week. Over the past four weeks, crude oil exports averaged 4.212 million barrels per day.
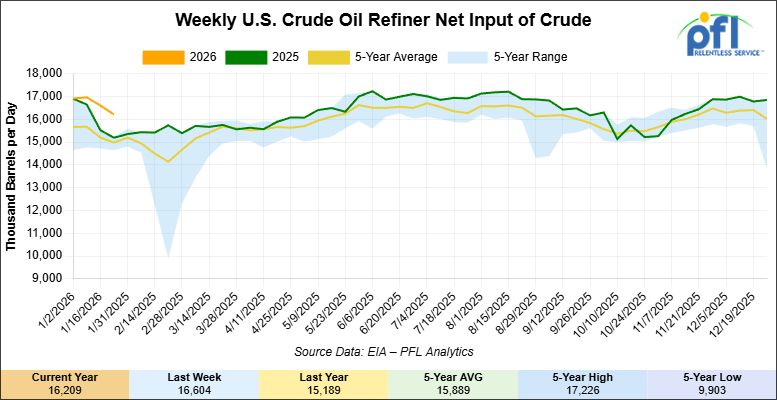
U.S. crude oil refinery inputs averaged 16.2 million barrels per day during the week ending January 23, 2026, which was 395,000 barrels per day less week-over-week.
WTI is poised to open at $61.74, down $3.47 per barrel from Friday’s close.
North American Rail Traffic
Week Ending January 28, 2026:
Total North American weekly rail volumes were up (+2.61%) in week 5, compared with the same week last year. Total Carloads for the week ending January 28, 2026 were 309,403, up (+9.05%) compared with the same week in 2024, while weekly Intermodal volume was 320,364, down (-2.93%) year over year. 4 of the AAR’s 11 major traffic categories posted year-over-year decreases. The largest decrease came from Forest Products (-16.26%), while the largest increase was Nonmetallic Minerals (+27.77%).
In the East, CSX’s total volumes were up (+11.40%), with the largest decrease coming from Metallic Ores and Metals (-11.06%), while the largest increase came from Nonmetallic Minerals (+29.74%). NS’s total volumes were up (+6.19%), with the largest increase coming from Nonmetallic Minerals (+32.21%), while the largest decrease came from Grain (-6.33%).
In the West, BNSF’s total volumes were up (+2.23%), with the largest increase coming from Nonmetallic Minerals (+35.61%), while the largest decrease came from Forest Products (-9.39%). UP’s total volumes were up (+1.39%), with the largest increase coming from Grain (+64.17%), while the largest decrease came from Intermodal Units (-13.72%).
In Canada, CN’s total volumes were down (-3.08%), with the largest increase coming from Grain (+65.86%), while the largest decrease came from Motor Vehicles and Parts (-18.80%). CPKCS’s total volumes were down (-21.47%), with the largest increase coming from Coal (+21.51%), while the largest decrease came from Forest Products (-64.86%).
Source Data: AAR – PFL Analytics
North American Rig Count Summary
Rig Count
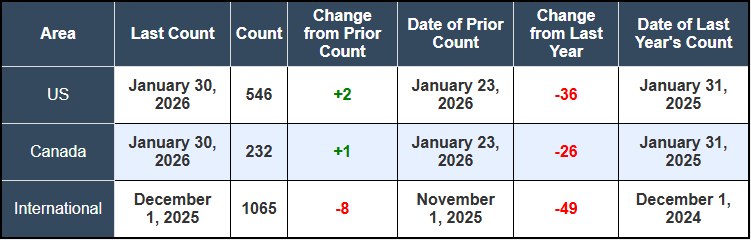
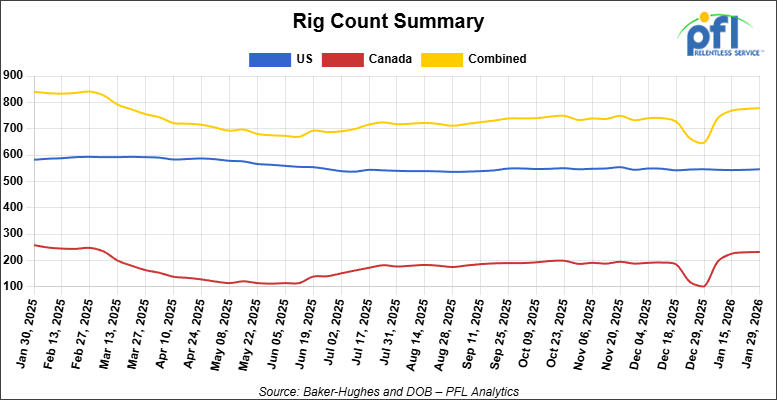
North American rig count was up by +3 rigs week-over-week. The U.S. rig count was up by +2 rigs week-over-week, but down by -36 rigs year-over-year. The U.S. currently has 546 active rigs. Canada’s rig count was up by +1 rig week-over-week, but down by -26 rigs year-over-year. Canada currently has 232 active rigs. Overall, year-over-year we are down by -62 rigs collectively.
We are watching a few things out there for you:
Happy Groundhog Day Folks
Well expect the record-setting cold Philadelphia has experienced in recent days to continue for the next six weeks, at least according to Punxsutawney Phil. The weather-predicting groundhog saw his shadow Monday outside his hole at Gobbler’s Knob in Punxsutawney, Pa. If you believe such things, that means the entire country – including our snow-covered section of the Northeast – can expect below-average temperatures for the next six weeks
We are Watching Petroleum Carloads
The four-week rolling average of petroleum carloads carried on the six largest North American railroads rose to 29,429 from 28,558, which was a increase of +871 rail cars week-over-week. Canadian volumes were mixed. CPKC’s shipments were higher by +10.0% week-over-week, CN’s volumes were lower by -2.0% week-over-week. U.S. shipments were also mixed. The NS had the largest percentage increase and was up by +3.0%. The CSX had the largest percentage decrease and was down by -6.0%.
We are Watching Canadian Crude Oil Exports by Rail
The Canadian Energy regulator reported on January 26, 2026, that 85,055 barrels were exported during the month of November 2026 up from 78,117 barrels in October of 2025, an increase of 6,938 barrels per day month over month.
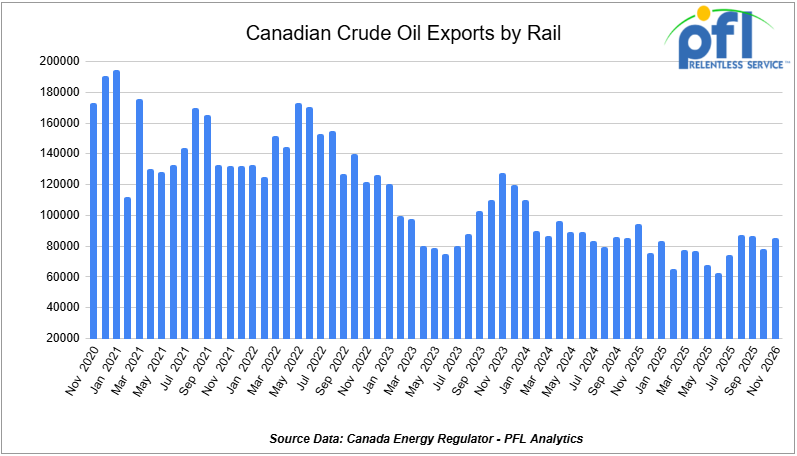
Crude by rail will always be necessary out of Canada for stranded oil not connected by pipelines. Raw bitumen, which is shipped as a non-haz product and is not able to flow in pipelines, is competitive with pipeline tolls and is a growing market to keep an eye on, particularly in light of Strathcona and Gibson announcing new projects. Other factors would be existing long-term contractual commitments and basis – we really need to see basis WTI-CMA (West Texas Intermediate – Calendar Month Average) blowout to -18 per barrel for sustained periods of time to make economic sense. Current rail rates from Alberta to the U.S. Gulf Coast have averaged $15.36 per barrel, making rail competitive whenever WCS-WTI spreads exceed $18 per barrel, including quality adjustments.
We Continue to Watch Oil and Gas
In the first month of 2026, the oil and gas industry has been shaped by a mix of strong earnings, geopolitical maneuvers, supply shifts, and strategic portfolio realignments. Despite the backdrop of global oversupply, Chevron and ExxonMobil are delivering results that topped expectations. They continued to deliver record production volumes — particularly in the Permian Basin and other key U.S. plays — even as profits softened compared with earlier peaks and refining margins fluctuated with market conditions. Their performance underscores how major integrated producers are navigating tight pricing environments and cost pressures.
At the same time, benchmark crude oil and natural gas prices climbed over recent weeks, influenced by weather-related production disruptions in the U.S. and geopolitical risk perceptions. Winter cold snaps in key producing regions temporarily constrained output, tightening balances and lifting prices, while concerns over broader supply reliability continued to support energy markets. These price movements reflect the ongoing tension between robust inventories and episodic supply constraints that can trigger rallies in both oil and gas benchmarks.
The repositioning of Venezuelan crude flows is rapidly reshaping international crude markets. Trading houses such as Trafigura have already sold their first cargoes of Venezuelan heavy crude under newly negotiated supply arrangements, with shipments destined for European refiners capable of processing viscous sour grades. Vitol is likewise moving Venezuelan cargos to Italy and to refiners in the U.S. Gulf Coast and Asia, capitalizing on authorized trade channels opening up after the U.S. eased longstanding sanctions on Venezuelan oil exports. These early shipments — part of a larger 50 million-barrel supply agreement brokered between Caracas and Washington — mark some of the first conventional crude flows out of Venezuela in years and signal how mainstream market forces are re-entering a once-frozen trade lane.
One company making headlines as of late is Valero. Valero’s recent announcement that it has engaged with three U.S. – authorized sellers of Venezuelan crude underscores a shift in heavy oil supply for Gulf Coast refiners. Valero expects these grades to make up a “pretty large part” of its heavy crude intake in the coming months. This shift could have real implications for rail markets, possibly displacing Canadian barrels that would normally be destined for the U.S. Gulf Coast – forcing those barrels to Eastern U.S. refineries or to be exported to Asian markets.
Canada is actively pivoting export strategies toward Asia, particularly China, as part of a broader effort to reduce its near-exclusive dependence on U.S. energy demand. Record production levels from Alberta’s oil sands, enabled by expanded pipeline capacity such as the Trans Mountain Extension, have boosted export volumes and helped Canadian producers diversify into longer-haul markets. However, challenges remain, including pipeline bottlenecks re-emerging under a global crude glut and continued debate over energy infrastructure expansions amid environmental and indigenous policy hurdles.
Alberta’s Premier Danielle Smith was speaking at a press conference on Friday of last week with Canada’s 13 Premiers (similar to a Governor here in the U.S.) and left wing Prime Minister Mark Carney, following two days of meetings in Ottawa to discuss trade diversification and other national issues. She said Kitimat will not be the terminus for a proposed Alberta-to–West Coast oil pipeline, citing overly complex marine navigation. Smith said a proposal to expand Enbridge’s mainline was “interesting” to ship crude by rail to the East Coast to access more European markets. She said more American routes “….kind of misses the point of the exercise. I suppose we could sell more to the United States, but why we’re all here is we’re trying to find a way to trade with each other (Provinces of Canada trading with other Provinces of Canada – believe it or not folks this does not happen very often!) and help each other and find new markets.” There was also continued talk of expanding the Port of Churchill, or a route through the Northwest Territories. She said Alberta aims to have its proposal ready by June and expects private-sector interest once approved.
We Continue to Watch Left Wing Canadian Prime Minister Carney
As our readers are aware, PFL has offices in Canada and does a bunch of work up in Canada and many ask what is wrong with Canada? What are they thinking? We will try and explain below the best we can:
Canada is living through one of history’s great economic contradictions. Commodity prices remain elevated across energy, agriculture, and critical minerals—the exact resources Canada holds in abundance. Oil is trading above $60 per barrel, natural gas recently spiked above $6 per MMBtu during cold snaps, potash prices remain firm on global food security concerns, and lithium, cobalt, and rare earth minerals command premiums as the world scrambles to secure battery supply chains.
Canada has it all! Canada ranks third globally in proven oil reserves, holds vast natural gas deposits, dominates global potash production, and possesses significant uranium and critical mineral resources that Western nations desperately need. Yet, despite this resource wealth and elevated global prices, ordinary Canadians are getting materially poorer. Housing costs have doubled in a decade, grocery prices have climbed 30% since 2020, and after-tax incomes are stagnant or declining in real terms for most households. In his first weeks as Prime Minister, Mark Carney announced a “Canada Groceries and Essentials Benefit”—providing families of four up to $1,890 in direct payments to cope with affordability pressures. The rebate is essentially an admission of policy failure: a resource-rich nation during a commodity boom requiring grocery subsidies for its middle class. What a joke!
The irony of Carney’s government is that it has made substantial course corrections on climate policy while leaving the structural impediments to resource development largely intact. Carney scrapped the consumer carbon tax on his first day in office – March 14, 2025 – after spending years as UN Special Envoy for Climate Action championing carbon pricing as essential to emissions reduction. Eight months later, in November 2025, he signed a memorandum of understanding with Alberta Premier Danielle Smith that scrapped the oil and gas sector emissions cap, suspended clean electricity regulations, and committed to adjusting the Oil Tanker Moratorium Act to facilitate a new Pacific pipeline. Environment Minister Steven Guilbeault resigned immediately after the deal was announced. Carney – the former central banker who wrote in his 2021 book that “meaningful carbon prices are a cornerstone of any effective policy framework”– eliminated both the consumer carbon tax and the sectoral emissions cap within his first year in office. The policy reversals were politically necessary; the consumer carbon tax had become toxic with voters amid inflation, and the emissions cap faced unified opposition from Alberta, Saskatchewan, and the oil industry. But, the flip-flops reveal a government reacting to political pressure rather than executing a coherent economic growth strategy.
Eliminating the carbon tax and emissions cap removes some costs and regulatory uncertainty, but these changes do not address the core problem: Canada’s regulatory and approval processes remain hostile to resource development, investment capital continues fleeing to more competitive jurisdictions, and the tax burden on high earners and businesses remains among the highest in the developed world. Major resource projects still take 10-15 years to permit and develop in Canada versus 3-5 years in Australia. LNG export terminals that could supply European and Asian markets face multi-year environmental reviews while U.S. Gulf Coast LNG capacity has grown from near-zero in 2015 to over 100 million tons per year today. Critical mineral projects essential for battery supply chains languish in approval processes while similar projects in Nevada or Western Australia move to production. The Liberals imposed emissions caps on the oil and gas sector in 2021, published draft regulations in 2024, then scrapped the entire framework in 2025 – creating three years of investment uncertainty that deterred capital deployment regardless of the ultimate policy outcome. Carney’s government has signaled openness to a new Pacific pipeline, approved an LNG expansion in British Columbia, and committed to streamlining approvals, but concrete action remains limited and timelines remain vague.
Meanwhile, federal program spending has increased from $250 billion annually in 2015 to over $500 billion today, while GDP growth has badly lagged population growth, producing declining per-capita income. Federal debt has climbed from $600 billion in 2015 to over $1.3 trillion, producing annual debt servicing costs exceeding $50 billion – more than Canada spends on national defense. The Liberal response under both Trudeau and Carney has been to increase taxes on high earners and corporations while expanding social programs, subsidies, and transfer payments. Combined federal-provincial top marginal income tax rates now exceed 53 percent in Ontario, Quebec, and British Columbia – among the highest in the developed world and materially above competing U.S. states. For professionals, entrepreneurs, and skilled workers, the after-tax economic proposition of staying in Canada versus relocating to the United States has deteriorated sharply. Doctors, engineers, tech workers, and finance professionals are leaving for higher after-tax incomes, lower costs of living, and jurisdictions that treat wealth creation as desirable rather than problematic.
This exodus mirrors California’s experience, where progressive tax policies and soaring costs drove unprecedented outmigration of high earners and businesses to Texas, Florida, Arizona, and Nevada between 2020 and 2025. It is still happening today with Wells Fargo announcing last week that they are moving their corporate offices from California to Florida. The migrants were disproportionately high earners—exactly the tax base California needs to fund its expansive social programs. Canada faces the same dynamic. Statistics Canada data shows net emigration of Canadian residents to the United States has turned sharply negative, with tens of thousands more Canadians moving south than Americans moving north annually. These are working-age professionals and entrepreneurs concluding that Canada’s tax burden, cost of living, and economic opportunities no longer justify staying. The Liberal government’s solution—grocery rebates, direct payments, and expanded subsidies—accelerates the problem by increasing the tax burden on those who remain while doing nothing to address the structural productivity and competitiveness issues driving the exodus. Redistribution requires wealth creation; Canada is attempting redistribution while constraining the sectors that create wealth.
What Canada needs is a fundamental reorientation toward economic growth, resource development, and productivity improvement.
First, embrace resource extraction and export as a strategic economic priority. Approving LNG export terminals on the West Coast would position Canada to supply Asian and European markets currently served by Qatar, Australia, and the United States. Canadian natural gas is among the lowest-emission in the world due to strict regulations and modern production techniques, yet Canada exports virtually none in liquefied form while U.S. Gulf Coast LNG capacity has exploded. Critical minerals—lithium, cobalt, nickel, rare earths—are essential for electric vehicle batteries, defense systems, and renewable energy infrastructure. Western nations have identified supply chain vulnerability to China as a national security issue and are willing to pay premiums for North American supply. Yet Canadian critical mineral projects take 10-15 years to permit versus 3-5 years in Australia. Streamlining approvals to 2-3 years for major projects would unlock tens of billions in private investment without sacrificing environmental review. At the same time, why not make it a year or even months? Canada has been studying the environment for years!
Second, rebuild the tax system to retain talent and attract investment. Reducing top marginal rates to 45 percent combined federal-provincial would slow the brain drain and signal that Canada values wealth creators. Increasing capital cost allowances, eliminating interprovincial trade barriers, and reducing regulatory compliance costs would improve the business investment climate. These are competitive necessities for a country hemorrhaging talent and capital to more favorable jurisdictions.
Third, invest in infrastructure that enables resource development rather than constraining it. Pipeline capacity determines whether Canadian crude sells at global prices or persistent discounts. Rail capacity determines whether grain and potash reach export markets during demand windows or sit in storage. Port terminals determine whether critical minerals move efficiently to buyers or queue for weeks. LNG export terminals determine whether Canadian gas reaches premium Asian markets or gets sold at domestic spot prices. The Liberal approach created under 10 years of a Trudeau government – blocked pipelines, underfund rail, deferred port expansions, slowed LNG approvals – created bottlenecks preventing Canada from capturing full value from its resource base. Carney said he has shifted toward infrastructure support, but concrete action remains limited, we have seen nothing but talk. A government serious about prosperity would approve projects, expedite permitting, and work with provinces and industry to remove barriers.
Fourth, recognize that fiscal sustainability requires economic growth, not borrowing and redistribution. Transfer payments, social programs, and debt servicing consume increasing shares of federal revenue while the tax base erodes through emigration and underinvestment. Growing the economy through resource development, infrastructure investment, and productivity improvements makes social programs affordable; borrowing to fund rebates while strangling wealth-creating sectors leads to stagnation, higher taxes, or both.
If Canada pursues these policies, rail car market implications are substantial. Increased oil sands production requires unit trains of diluent inbound and crude or dilbit outbound when pipeline capacity fills. LNG facility construction and operation generate specialty carloads of equipment, materials, and chemicals. Critical mineral mines require inbound reagents and outbound concentrates. Potash production growth increases covered hopper demand for movements to Vancouver and export terminals. Grain volumes rise when farmers respond to strong global prices and have adequate logistics to move product. Forest products, steel, manufactured goods, and intermodal freight all benefit from a stronger overall economy with higher investment and employment. Conversely, if Canada continues muddling through – removing some regulatory barriers while maintaining others, cutting some taxes while raising others, approving some projects while deferring others – the structural demand environment for rail transportation remains weak. Crude-by-rail becomes a niche market managing pipeline constraints rather than a growth opportunity. Grain movements stay limited by production uncertainty. Specialty carloads tied to mining, manufacturing, and construction face headwinds as projects migrate to more competitive jurisdictions or do not proceed.
Left wing Carney’s November deal with Alberta, his March elimination of the consumer carbon tax, and his January grocery rebate announcement encapsulate the challenge. The Prime Minister has abandoned climate policies he spent a decade championing—not because the science changed, but because the politics did. He travels abroad securing tariff reductions and lecturing global elites, then returns home to announce payments helping Canadians afford food. The policy reversals suggest responsiveness to political reality, but they do not constitute an economic growth strategy. Canada does not need grocery rebates, trade deals with China, or speeches about sovereignty—it needs policies that enable the country to develop its resources, attract investment, retain talent, and build infrastructure required to capitalize on the most favorable commodity environment in decades. Until that happens, Canadians will grow poorer despite living in one of the most resource-rich nations on earth, and the rail car industry will watch potential demand growth migrate to the United States while Canadian volumes stagnate. The opportunity is generational; the risk of squandering it through incoherence and half-measures is real. Left Wing Carney needs a wake-up call, or Canada needs a real leader. Stay tuned to PFL we are always watching this one!
We are Watching Private Equity
Adding a strategic twist to the industry landscape, U.S. private equity giant The Carlyle Group agreed to buy most of Russia’s Lukoil’s international assets, a sweeping portfolio spanning oilfields, refineries, and downstream holdings across Europe, the Middle East, Africa, and Central Asia. Lukoil, Russia’s second-largest oil producer, has been compelled to divest these assets under mounting Western sanctions aimed at curtailing Russian hydrocarbon revenues tied to the Ukraine conflict. The sale — still subject to U.S. Treasury Office of Foreign Assets Control (OFAC) approval and due diligence — would mark a rare transfer of major global energy assets to Western capital markets, with implications for ownership patterns, refinery feedstock control, and energy security across multiple regions.
We are watching Chemical Companies
Dow’s announcement that it will cut roughly 4,500–5,000 jobs globally is being described as part of a broader effort to reduce costs, simplify operations, and rely more heavily on automation and AI. The move follows a tough earnings year and is expected to include meaningful impacts at Gulf Coast operations, especially the Freeport area.
While the announcement isn’t about rail directly, it fits a pattern that rail-shipping manufacturers, especially in chemicals, have been moving toward for some time.
When companies reduce headcount and push for leaner operations, plants tend to run with less buffer. Production is scheduled more tightly, staffing is thinner, and there’s less room for delays or inefficiencies.
For rail, this often shows up as:
● Shipments that are less steady and more start-and-stop;
● Cars being held while production or sales plans are adjusted;
● More repositioning of equipment as plans change.
Volumes don’t necessarily fall off a cliff, but the flow becomes less predictable.
Gulf Coast Impacts:
Dow’s Gulf Coast footprint is heavily tied to rail and export activity. When large sites in that region adjust staffing or operating models, the effects usually show up indirectly, through changes in timing, staging, and how long railcars sit between moves.
These kinds of shifts are common during restructurings. Rail becomes the place where mismatches between production and demand are worked through, often quietly and over weeks or months rather than all at once.
Automation:
Dow has pointed to AI and automation as tools to improve planning and efficiency. While better planning can help, it also tends to tighten the system. When everything is optimized closely, there’s less tolerance for disruption, whether that’s weather, service issues, or sudden demand changes.
In those environments, rail networks are often asked to adapt quickly, even if overall shipment levels don’t change much.
A Familiar Industry Story:
Dow isn’t alone. Across industrial and chemical manufacturing, companies are cutting costs, simplifying operations, and trying to do more with less. These moves don’t always make headlines in rail data, but they do influence how rail assets are used day-to-day.
The result is a market where rail isn’t just moving product from A to B, it’s helping manage timing, pauses, and adjustments when plans don’t line up perfectly.
That dynamic continues to shape rail activity across the chemical sector, and Dow’s announcement is another example of it playing out in real time.
We Are Watching Key Economic Indicators
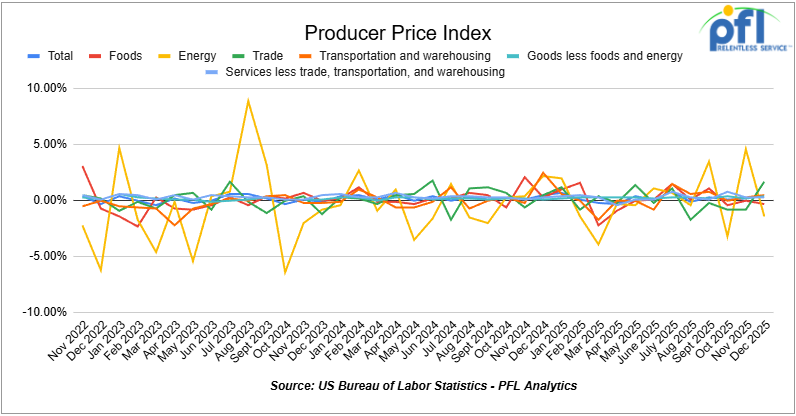
Producer Price Index
In December 2025, the Producer Price Index (PPI) for final demand rose 0.5% month over month, accelerating from the 0.2% increase in November and indicating firmer upstream inflation pressures to close the year. Core PPI (final demand less foods, energy, and trade services) increased 0.4% month over month, matching November’s pace. The monthly increase was driven primarily by services, which rose 0.7%, while goods were unchanged (0.0%). Within goods, food prices declined 0.3% and energy prices fell 1.4%, while goods less food and energy increased 0.4%. Within services, trade margins rose 1.7%, transportation and warehousing increased 0.5%, and services excluding trade, transportation, and warehousing rose 0.3%.
In December 2025, the Consumer Price Index (CPI) increased 0.3% month over month, matching November’s gain, and was up 2.7% year over year, easing from the prior month. Core CPI (all items less food and energy) rose 0.2% month over month and was up 2.6% year over year. Shelter remained the largest contributor, increasing 0.4% for the month. Food prices rose 0.3%, with food at home up 0.4% and food away from home up 0.2%. Energy prices increased 0.4%, led by a 1.1% rise in gasoline prices.
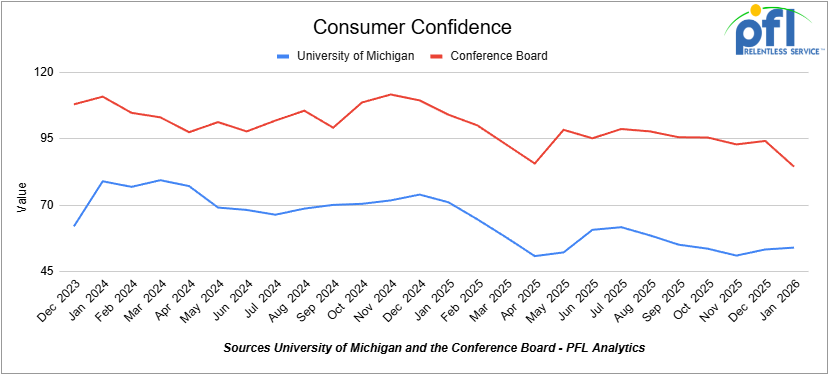
Consumer Confidence
The Index of Consumer Sentiment from the University of Michigan increased from 53.3 in December to 54.0 in January.
The Conference Board Consumer Confidence Index decreased from 94.2 in December to 84.5 in January.
Lease Bids
- 30-50, 6000cf Steel Hopper located off of CSX or NS in East. For use in petcoke service. Period: 5 Years.
- 10, 2500CF Open Top Hopper located off of UP or BN in Texas. For use in aggregate service. Period: 5 years. Need Rapid Discharge Doors.
- 100, 21.9K 117J Tank located off of All Class 1s in Midwest. For use in CO2 service. Period: 6 months.
- 30-50, 30K 117J Tank located off of NS or CSX in Northeast. For use in C5 service. Period: 1 year.
- 60, 33K 340W Tank located off of BNSF in UT/AZ. For use in Propane service. Period: Trip Lease.
Sales Bids
- 28, 3400CF Hopper Covered located off of UP BN in Texas. For use in Cement service. Cement Gates needed.
- 20, 17K Tank DOT111 located off of various class 1s in various locations. For use in corn syrup service.
- 120, Various Gondola Open-Top Aluminum Rotary located off of various class 1s in various locations. For use in Sulphur service. Built 2004 or later.
- 30, 29K Tank DOT111 located off of various class 1s in Chicago. For use in Veg Oil service.
Lease Offers
- 100, 30K CPC1232 Tanks located off of UP or BN in Texas. Last used in Diesel.
- 100, 30K DOT117J Tanks located off of UP or BN in Texas. Last used in Gasoline.
- 100, 29K DOT117J Tanks located off of UP or BN in Texas. Last used in Gasoline. Coiled and Insulated.
- 36, 6351 Covered Hopper located off of CN in Wisconsin. Last used in Grain. through 2/27.
- 29, 6580 Covered Hopper located off of CN in Wisconsin. Last used in Grain. through 2/26.
- 18, 6580 Covered Hopper located off of CN in Wisconsin. Last used in Grain. through 2/27.
- 9, 5400 Covered Hopper located off of CN in Wisconsin. Last used in Grain. through 2/27.
- 21, 6351 Covered Hopper located off of CN in Wisconsin. Last used in DDG. Available until February 2027.
- 29, 6500 Covered Hopper located off of CN in Wisconsin. Last used in DDG. Available until February 2027.
- 50, 5380 Covered Hopper located off of UP or BN in Houston. Last used in Fertilizer. Cars are currently clean. Available until February.
- 50, 20K DOT117J Tank located off of All Class 1s in Moving. Last used in Styrene.
- 29, 25.5K DOT117J Tank located off of UP or BN in Texas. Cars are currently clean. Cars are currently clean.
- 90, 30K DOT117J Tank located off of UP or BN in Corpus Christie. Last used in Diesel.
Sales Offers
- 21, 50′ Boxcar Plate Cs located off of various class 1s in NM. End of Life.
- 3, 50′ Boxcar Plate Cs located off of various class 1s in multiple locations. End of Life.
- 27, 50′ Boxcar Plate Cs located off of various class 1s in PQ. End of Life.
- 100, 3250 Covered Hoppers located off of various class 1s in multiple locations. Sand Cars.
- 5, 2740 Mill Gondolas located off of various class 1s in NC. End of Life.
- 1, 2260 Mill Gondolas located off of various class 1s in AL. End of Life.
- 30, 2740 Mill Gondolas located off of various class 1s in multiple locations. End of Life.
- 21, 2740 Mill Gondolas located off of various class 1s in WA. End of Life.
- 9, 4750 Covered Hoppers located off of various class 1s in multiple locations. End of Life.
- 5, 4750 Covered Hoppers located off of various class 1s in multiple locations. End of Life.
- 50, 31.8K Tank CPC 1232s located off of UP or BN in TX. Requal Due in 2025.
- 100, 4600CF Open Top Hoppers located off of BN or CSX in Southeast.
Call PFL today to discuss your needs and our availability and market reach. Whether you are looking to lease cars, lease out cars, buy cars, or sell cars call PFL today at 239-390-2885
Live Railcar Markets
| CAT | Type | Capacity | GRL | QTY | LOC | Class | Prev. Use | Offer | Note |
|---|
PFL will be at the Following Conferences

- Where: Loews Arlington Hotel
- Attending: Brian Baker (239.297.4519), David Cohen (954-729-4774), and Curtis Chandler (239-405-3365)
- Conference Website

- Where: The Westin Galleria Dallas
- Attending: David Cohen (954-729-4774), and Curtis Chandler (239-405-3365)
- Conference Website

- Where: The Westin Galleria Dallas
- Attending: Brian Baker (239.297.4519)
- Conference Website